
Second Quarter 2015 Earnings Conference Call
CB
Published · 23 slides · 0 views

1 / 1



Description
Second Quarter 2015 Earnings Conference Call August 4, 2015 2 Safe Harbor Statement Some of our comments constitute forward-looking statements that reflect managements current views and estimates of future economic circumstances, industry
Related Topics
Share
Embed code
Download this presentation From Below
"Second Quarter 2015 Earnings Conference Call" is the property of its rightful owner. Permission is granted to download and print the materials on this website for personal, non-commercial use only, and to display it on your personal computer provided you do not modify the materials and that you retain all copyright notices contained in the materials. By downloading content from our website, you accept the terms of this agreement.
Presentation Transcript
01
Second Quarter 2015 Earnings Conference Call
August 4, 2015<br>
August 4, 2015<br>
02
2 Safe Harbor Statement Some of our comments constitute forward-looking statements that reflect management’s current views and estimates of future economic circumstances, industry conditions, Company performance and financial results.
These statements are based on many assumptions and factors that are subject to risk and uncertainties. ADM has provided additional information in its reports on file with the SEC concerning assumptions and factors that could cause actual results to differ materially from those in this presentation, and you should carefully review the assumptions and factors in our SEC reports.
To the extent permitted under applicable law, ADM assumes no obligation to update any forward-looking statements as a result of new information or future events.<br>
These statements are based on many assumptions and factors that are subject to risk and uncertainties. ADM has provided additional information in its reports on file with the SEC concerning assumptions and factors that could cause actual results to differ materially from those in this presentation, and you should carefully review the assumptions and factors in our SEC reports.
To the extent permitted under applicable law, ADM assumes no obligation to update any forward-looking statements as a result of new information or future events.<br>
03
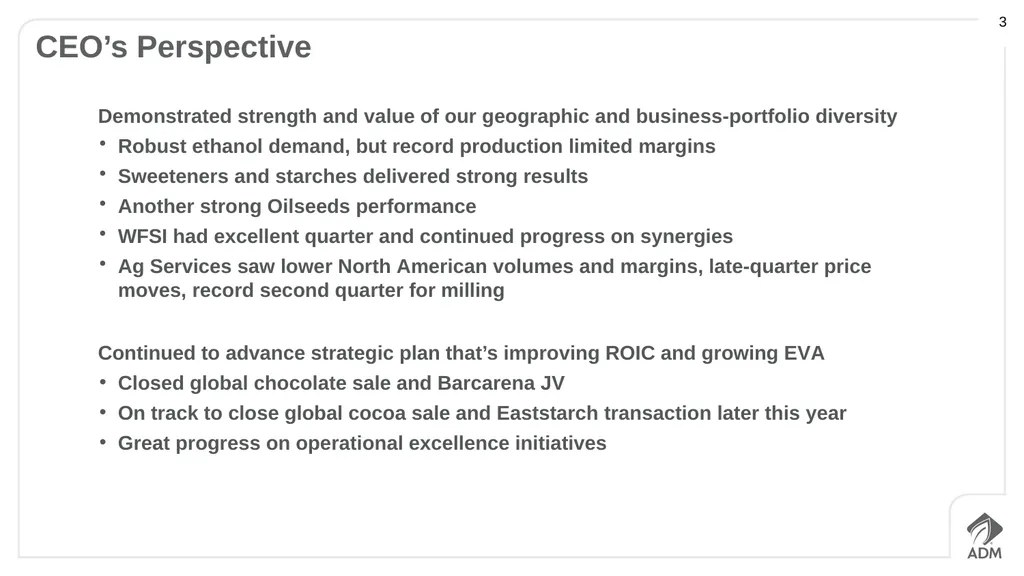
3 CEO’s Perspective Demonstrated strength and value of our geographic and business-portfolio diversity
Robust ethanol demand, but record production limited margins
Sweeteners and starches delivered strong results
Another strong Oilseeds performance
WFSI had excellent quarter and continued progress on synergies
Ag Services saw lower North American volumes and margins, late-quarter price moves, record second quarter for milling
Continued to advance strategic plan that’s improving ROIC and growing EVA
Closed global chocolate sale and Barcarena JV
On track to close global cocoa sale and Eaststarch transaction later this year
Great progress on operational excellence initiatives<br>
Robust ethanol demand, but record production limited margins
Sweeteners and starches delivered strong results
Another strong Oilseeds performance
WFSI had excellent quarter and continued progress on synergies
Ag Services saw lower North American volumes and margins, late-quarter price moves, record second quarter for milling
Continued to advance strategic plan that’s improving ROIC and growing EVA
Closed global chocolate sale and Barcarena JV
On track to close global cocoa sale and Eaststarch transaction later this year
Great progress on operational excellence initiatives<br>
04
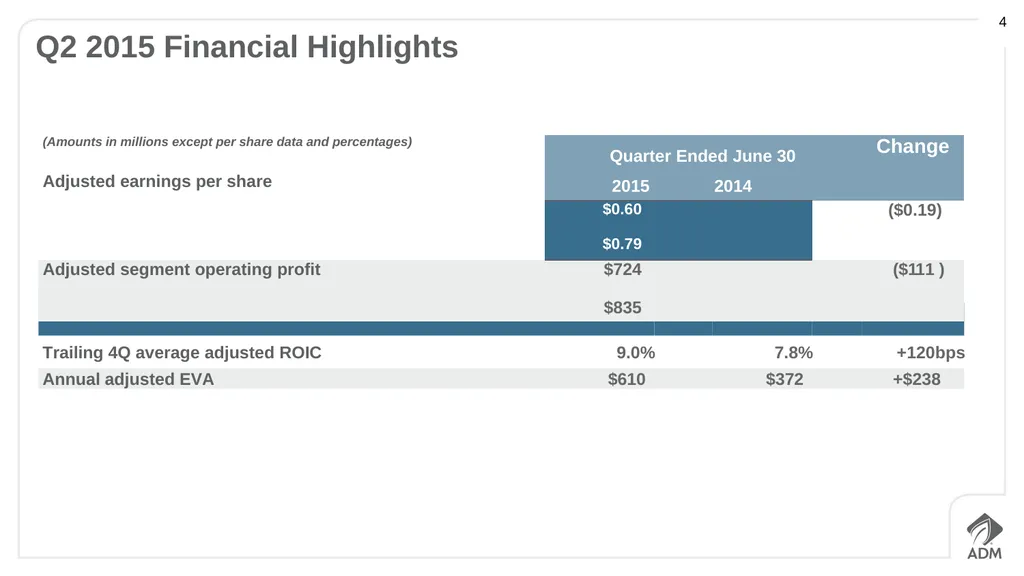
4 Q2 2015 Financial Highlights Effective tax rate 27% 28% Trailing 4Q average adjusted ROIC 9.0% 7.8% +120bps Annual adjusted EVA $610 $372 +$238<br>
05
5
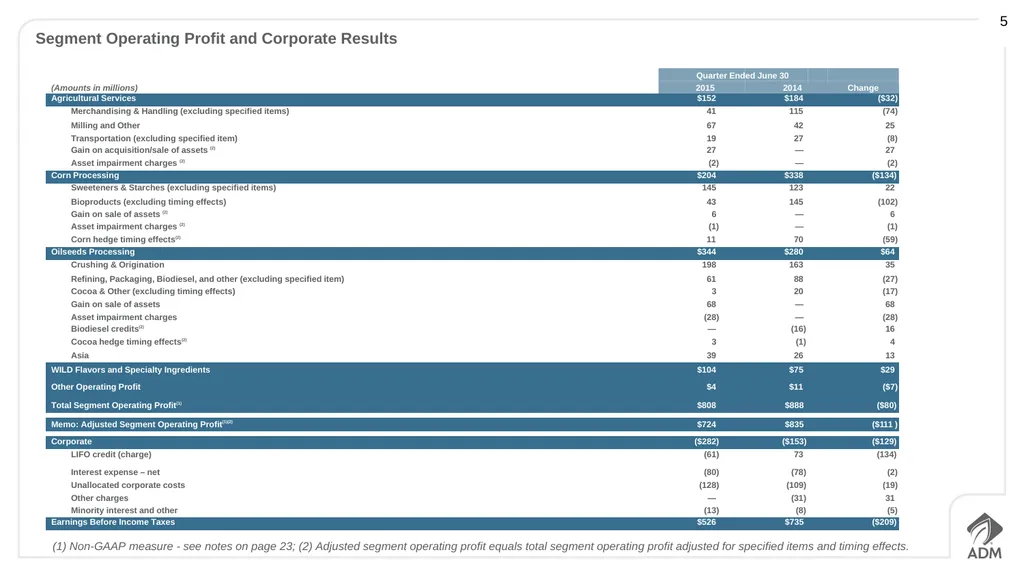
Segment Operating Profit and Corporate Results Quarter Ended June 30 (1) Non-GAAP measure - see notes on page 23; (2) Adjusted segment operating profit equals total segment operating profit adjusted for specified items and timing effects.<br>
Segment Operating Profit and Corporate Results Quarter Ended June 30 (1) Non-GAAP measure - see notes on page 23; (2) Adjusted segment operating profit equals total segment operating profit adjusted for specified items and timing effects.<br>
06
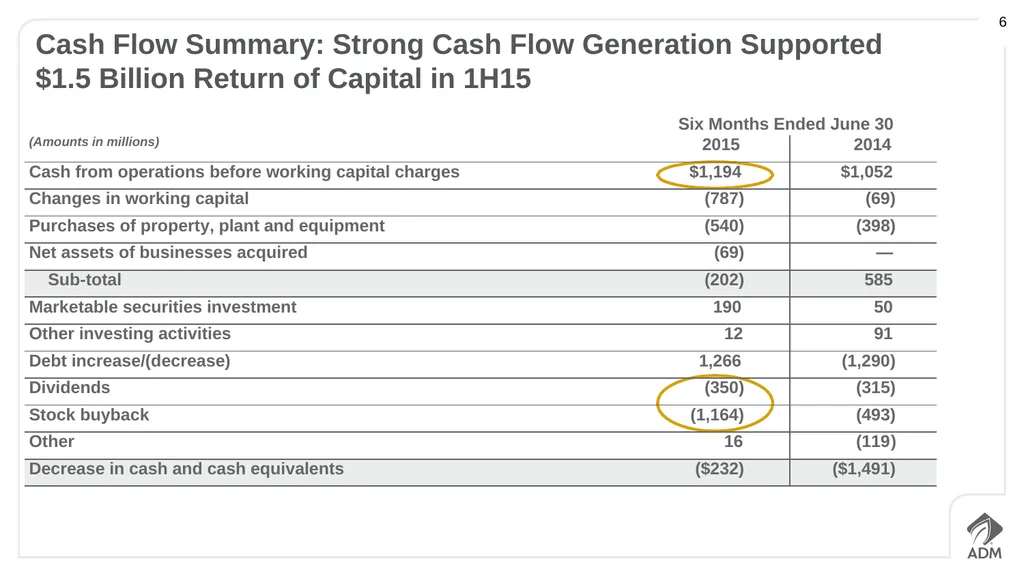
6 Cash Flow Summary: Strong Cash Flow Generation Supported
$1.5 Billion Return of Capital in 1H15 Six Months Ended June 30<br>
$1.5 Billion Return of Capital in 1H15 Six Months Ended June 30<br>
07
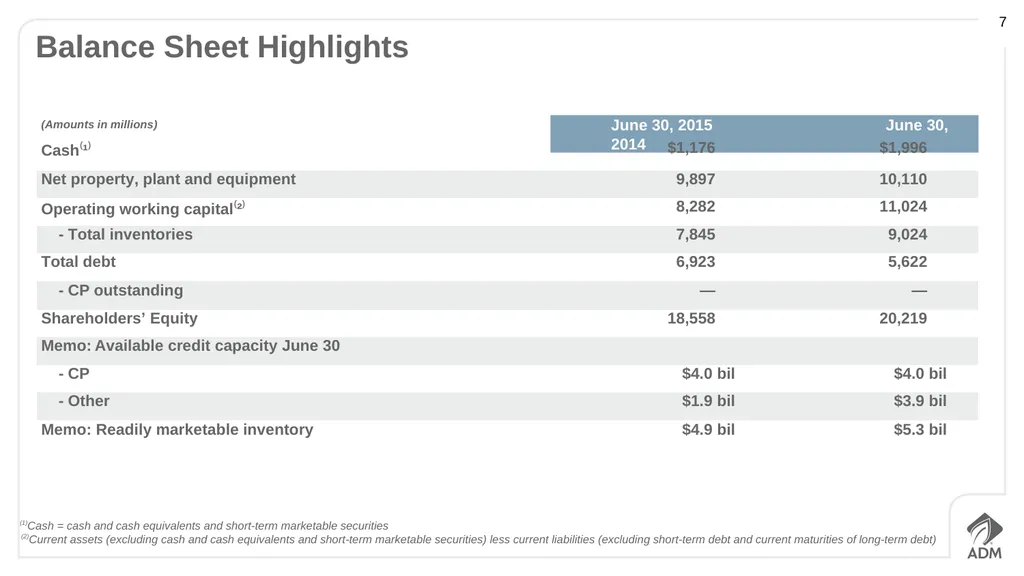
7 Balance Sheet Highlights (Amounts in millions) June 30, 2015 June 30, 2014 (1)Cash = cash and cash equivalents and short-term marketable securities
(2)Current assets (excluding cash and cash equivalents and short-term marketable securities) less current liabilities (excluding short-term debt and current maturities of long-term debt)<br>
(2)Current assets (excluding cash and cash equivalents and short-term marketable securities) less current liabilities (excluding short-term debt and current maturities of long-term debt)<br>
08
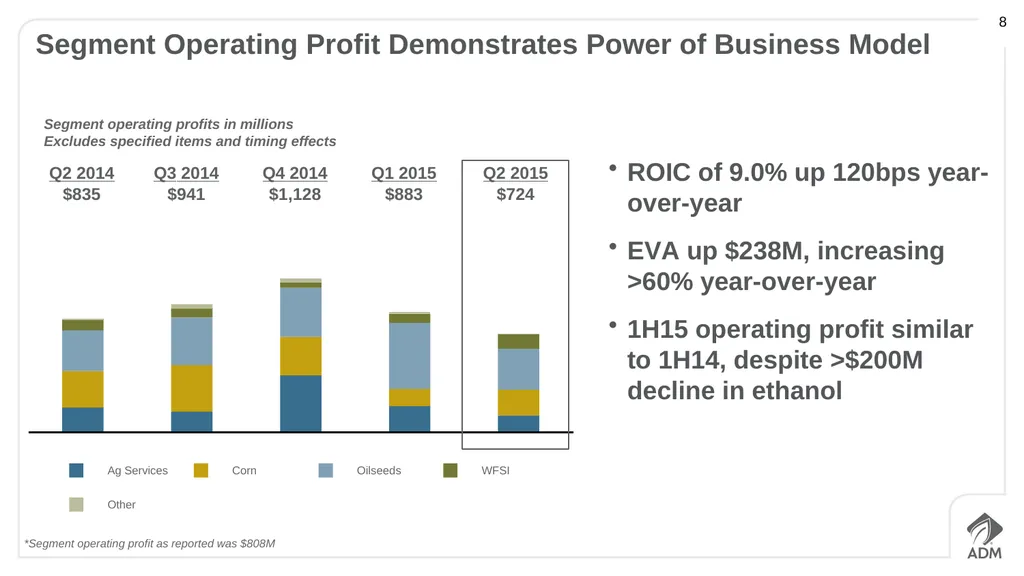
8 Q2 2014
$835 Q3 2014
$941 Q4 2014
$1,128 Q1 2015
$883 Q2 2015
$724 Ag Services Corn Oilseeds WFSI Other Segment Operating Profit Demonstrates Power of Business Model ROIC of 9.0% up 120bps year- over-year
EVA up $238M, increasing
>60% year-over-year
1H15 operating profit similar to 1H14, despite >$200M decline in ethanol Segment operating profits in millions Excludes specified items and timing effects *Segment operating profit as reported was $808M<br>
$835 Q3 2014
$941 Q4 2014
$1,128 Q1 2015
$883 Q2 2015
$724 Ag Services Corn Oilseeds WFSI Other Segment Operating Profit Demonstrates Power of Business Model ROIC of 9.0% up 120bps year- over-year
EVA up $238M, increasing
>60% year-over-year
1H15 operating profit similar to 1H14, despite >$200M decline in ethanol Segment operating profits in millions Excludes specified items and timing effects *Segment operating profit as reported was $808M<br>
09
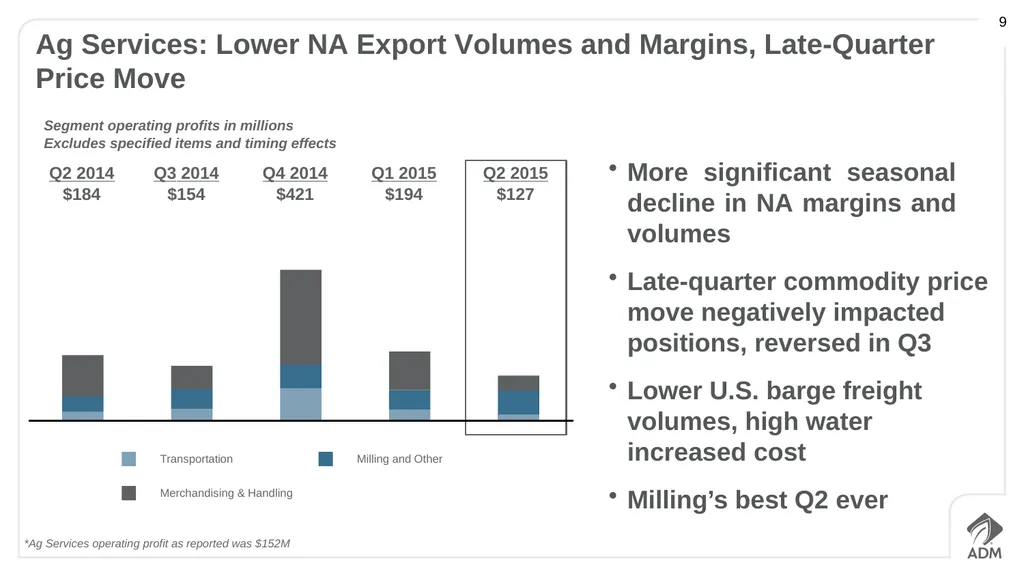
9 Q2 2014
$184 Q3 2014
$154 Q4 2014
$421 Q1 2015
$194 Q2 2015
$127 Ag Services: Lower NA Export Volumes and Margins, Late-Quarter Price Move More significant seasonal decline in NA margins and volumes
Late-quarter commodity price move negatively impacted positions, reversed in Q3
Lower U.S. barge freight volumes, high water increased cost
Milling’s best Q2 ever Segment operating profits in millions Excludes specified items and timing effects *Ag Services operating profit as reported was $152M Transportation Milling and Other Merchandising & Handling<br>
$184 Q3 2014
$154 Q4 2014
$421 Q1 2015
$194 Q2 2015
$127 Ag Services: Lower NA Export Volumes and Margins, Late-Quarter Price Move More significant seasonal decline in NA margins and volumes
Late-quarter commodity price move negatively impacted positions, reversed in Q3
Lower U.S. barge freight volumes, high water increased cost
Milling’s best Q2 ever Segment operating profits in millions Excludes specified items and timing effects *Ag Services operating profit as reported was $152M Transportation Milling and Other Merchandising & Handling<br>
10
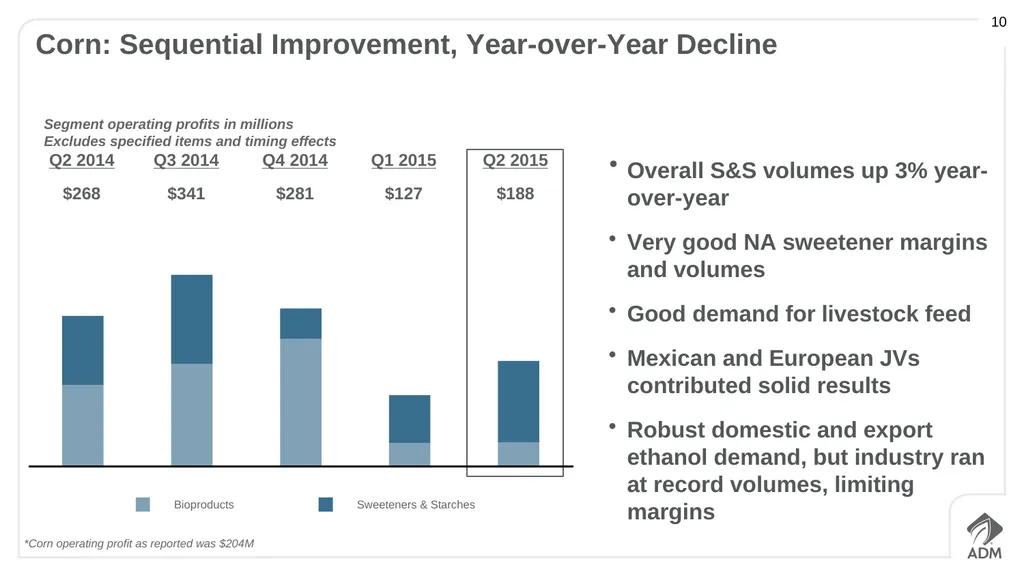
10 Corn: Sequential Improvement, Year-over-Year Decline Overall S&S volumes up 3% year- over-year
Very good NA sweetener margins and volumes
Good demand for livestock feed
Mexican and European JVs contributed solid results
Robust domestic and export ethanol demand, but industry ran at record volumes, limiting margins Segment operating profits in millions Excludes specified items and timing effects *Corn operating profit as reported was $204M Bioproducts Sweeteners & Starches<br>
Very good NA sweetener margins and volumes
Good demand for livestock feed
Mexican and European JVs contributed solid results
Robust domestic and export ethanol demand, but industry ran at record volumes, limiting margins Segment operating profits in millions Excludes specified items and timing effects *Corn operating profit as reported was $204M Bioproducts Sweeteners & Starches<br>
11
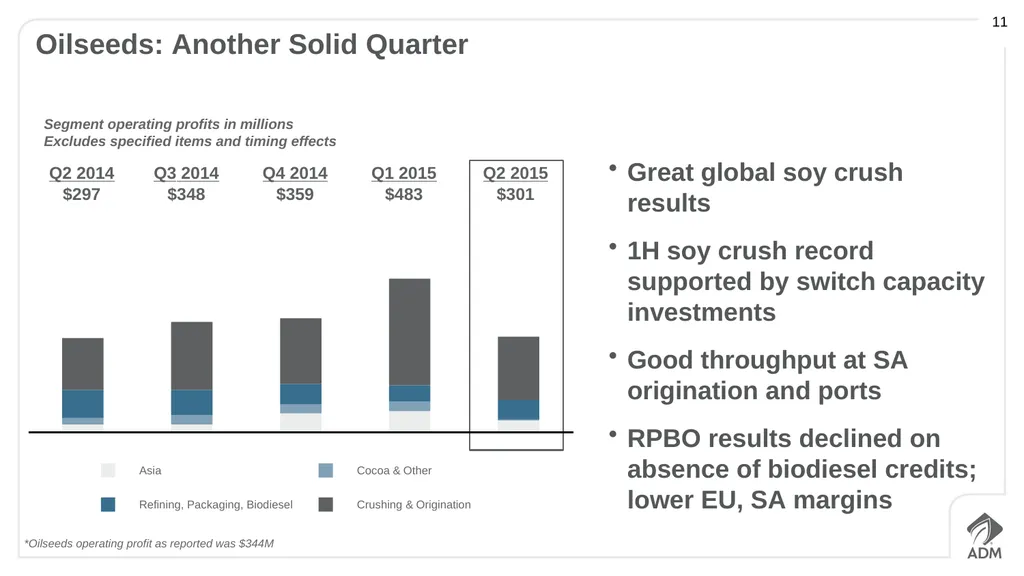
11 Q2 2014
$297 Q3 2014
$348 Q4 2014
$359 Q1 2015
$483 Q2 2015
$301 Oilseeds: Another Solid Quarter Great global soy crush results
1H soy crush record supported by switch capacity investments
Good throughput at SA origination and ports
RPBO results declined on absence of biodiesel credits; lower EU, SA margins Segment operating profits in millions Excludes specified items and timing effects *Oilseeds operating profit as reported was $344M Asia Cocoa & Other Refining, Packaging, Biodiesel Crushing & Origination<br>
$297 Q3 2014
$348 Q4 2014
$359 Q1 2015
$483 Q2 2015
$301 Oilseeds: Another Solid Quarter Great global soy crush results
1H soy crush record supported by switch capacity investments
Good throughput at SA origination and ports
RPBO results declined on absence of biodiesel credits; lower EU, SA margins Segment operating profits in millions Excludes specified items and timing effects *Oilseeds operating profit as reported was $344M Asia Cocoa & Other Refining, Packaging, Biodiesel Crushing & Origination<br>
12
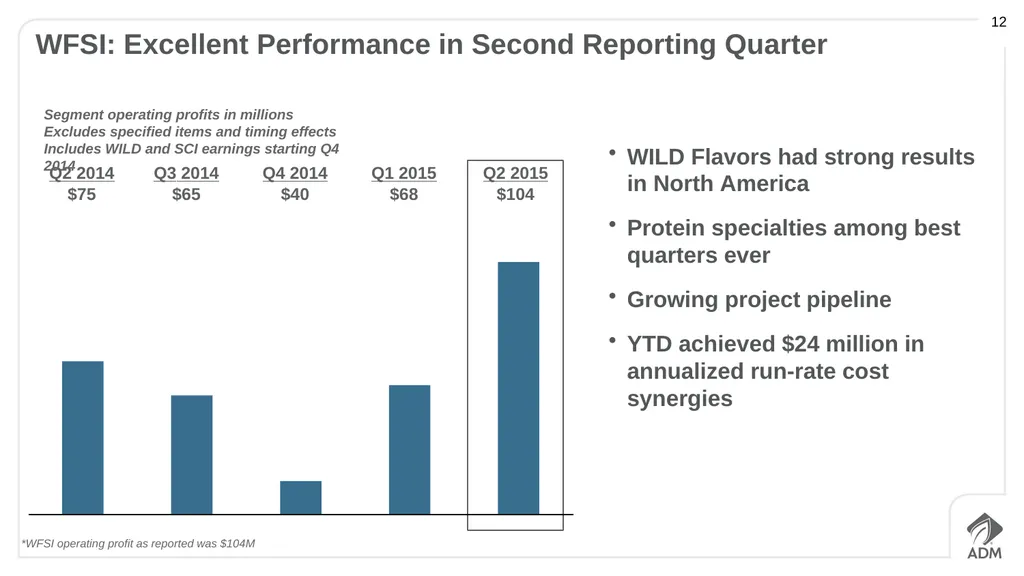
12 Q2 2014
$75 Q3 2014
$65 Q4 2014
$40 Q1 2015
$68 Q2 2015
$104 WFSI: Excellent Performance in Second Reporting Quarter WILD Flavors had strong results in North America
Protein specialties among best quarters ever
Growing project pipeline
YTD achieved $24 million in annualized run-rate cost synergies Segment operating profits in millions Excludes specified items and timing effects
Includes WILD and SCI earnings starting Q4 2014 *WFSI operating profit as reported was $104M<br>
$75 Q3 2014
$65 Q4 2014
$40 Q1 2015
$68 Q2 2015
$104 WFSI: Excellent Performance in Second Reporting Quarter WILD Flavors had strong results in North America
Protein specialties among best quarters ever
Growing project pipeline
YTD achieved $24 million in annualized run-rate cost synergies Segment operating profits in millions Excludes specified items and timing effects
Includes WILD and SCI earnings starting Q4 2014 *WFSI operating profit as reported was $104M<br>
13
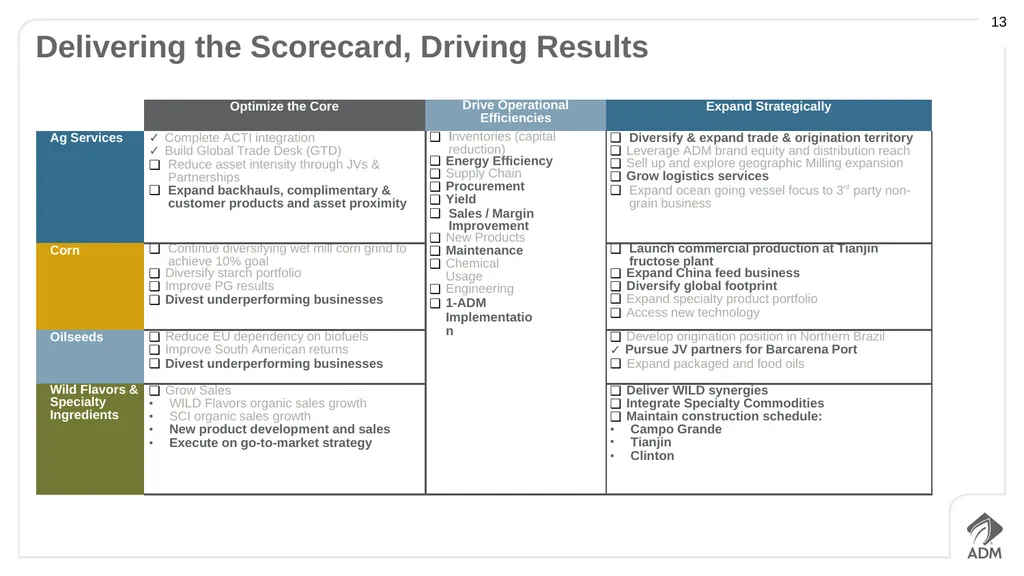
13 Delivering the Scorecard, Driving Results<br>
14
Looking Ahead<br>
15
15 Upcoming Investor Events Cleveland Research Ag Summit
Chicago, August 13
Farm Progress Show
Decatur, September 1-3
Credit Suisse Retail Round-up
Chicago, September 24<br>
Chicago, August 13
Farm Progress Show
Decatur, September 1-3
Credit Suisse Retail Round-up
Chicago, September 24<br>
16
Appendix<br>
17
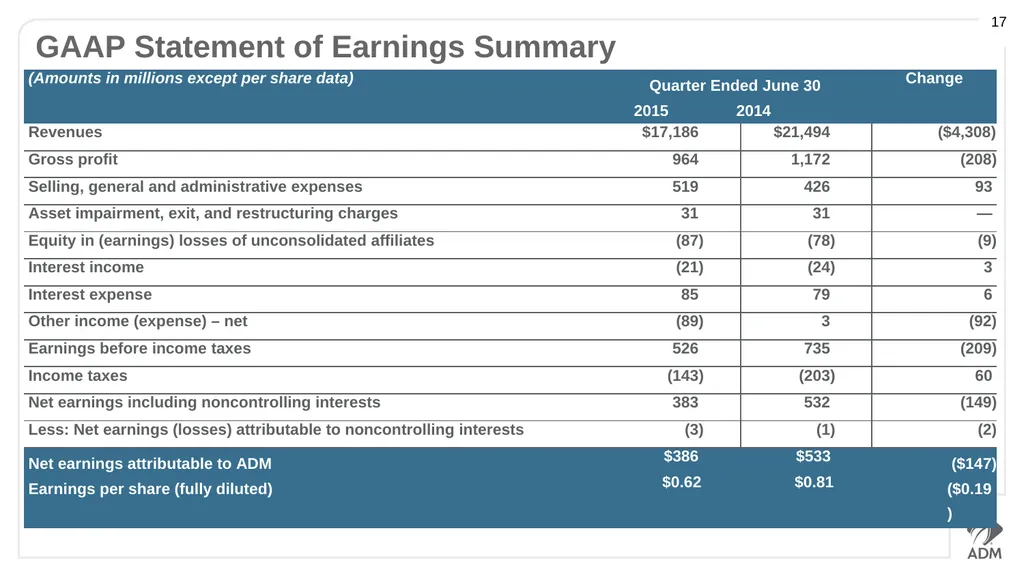
17 GAAP Statement of Earnings Summary<br>
18
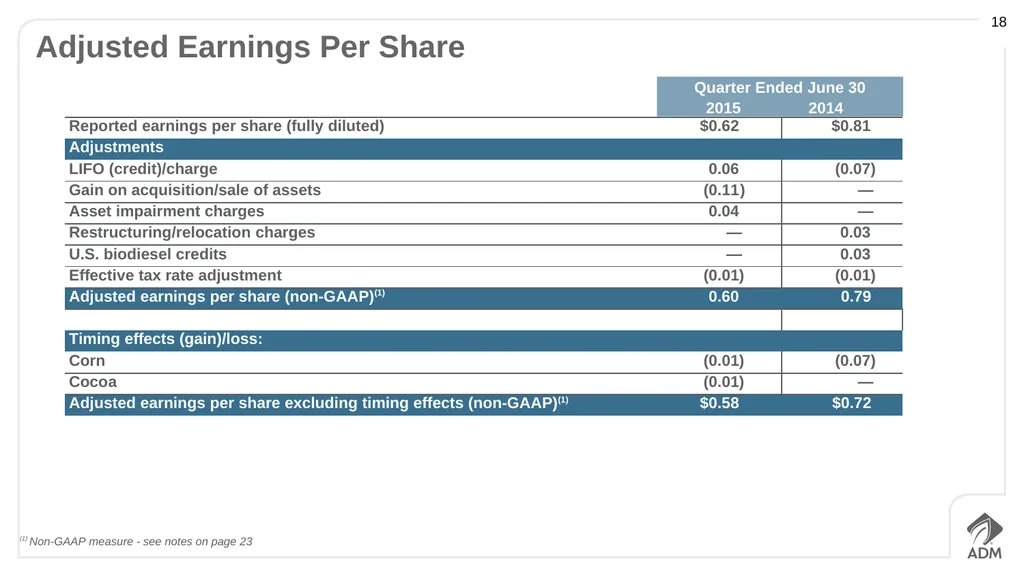
18 Adjusted Earnings Per Share Quarter Ended June 30 2015 2014 (1) Non-GAAP measure - see notes on page 23<br>
19
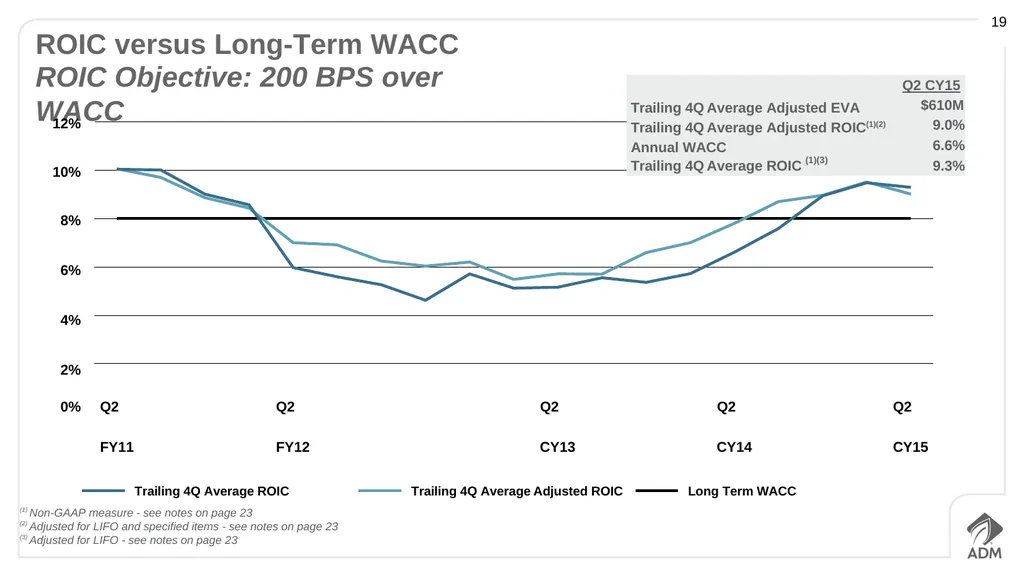
19 ROIC versus Long-Term WACC ROIC Objective: 200 BPS over WACC (1) Non-GAAP measure - see notes on page 23
(2) Adjusted for LIFO and specified items - see notes on page 23
(3) Adjusted for LIFO - see notes on page 23 Trailing 4Q Average ROIC Trailing 4Q Average Adjusted ROIC Long Term WACC 12% 10% 8%
6%
4%
2% Q2 CY15
$610M Trailing 4Q Average Adjusted EVA Trailing 4Q Average Adjusted ROIC(1)(2) Annual WACC 9.0% 6.6% Trailing 4Q Average ROIC (1)(3) 9.3%<br>
(2) Adjusted for LIFO and specified items - see notes on page 23
(3) Adjusted for LIFO - see notes on page 23 Trailing 4Q Average ROIC Trailing 4Q Average Adjusted ROIC Long Term WACC 12% 10% 8%
6%
4%
2% Q2 CY15
$610M Trailing 4Q Average Adjusted EVA Trailing 4Q Average Adjusted ROIC(1)(2) Annual WACC 9.0% 6.6% Trailing 4Q Average ROIC (1)(3) 9.3%<br>
20
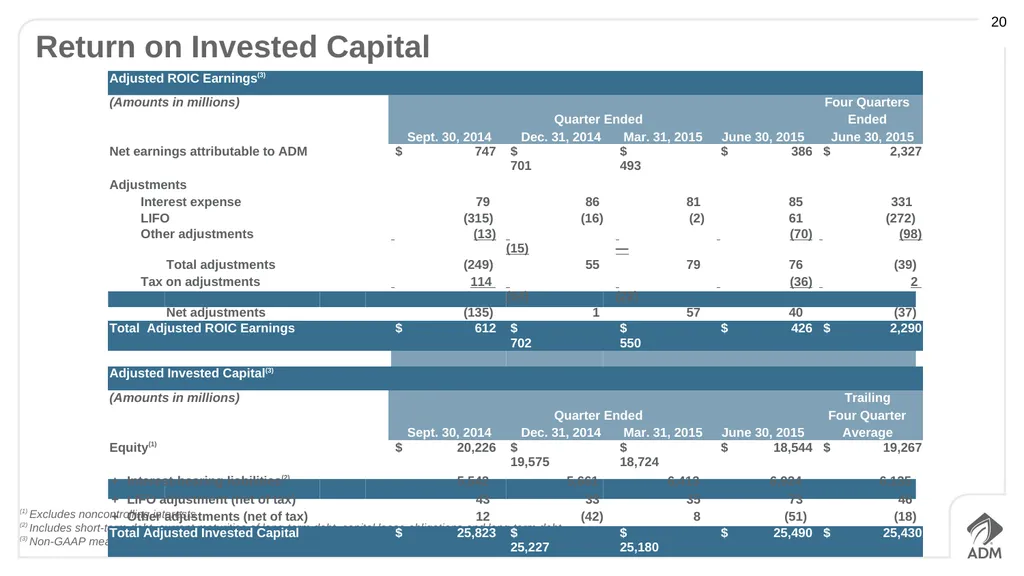
20 Return on Invested Capital (1) Excludes noncontrolling interests
(2) Includes short-term debt, current maturities of long-term debt, capital lease obligations and long-term debt
(3) Non-GAAP measure – see notes on page 23<br>
(2) Includes short-term debt, current maturities of long-term debt, capital lease obligations and long-term debt
(3) Non-GAAP measure – see notes on page 23<br>
21
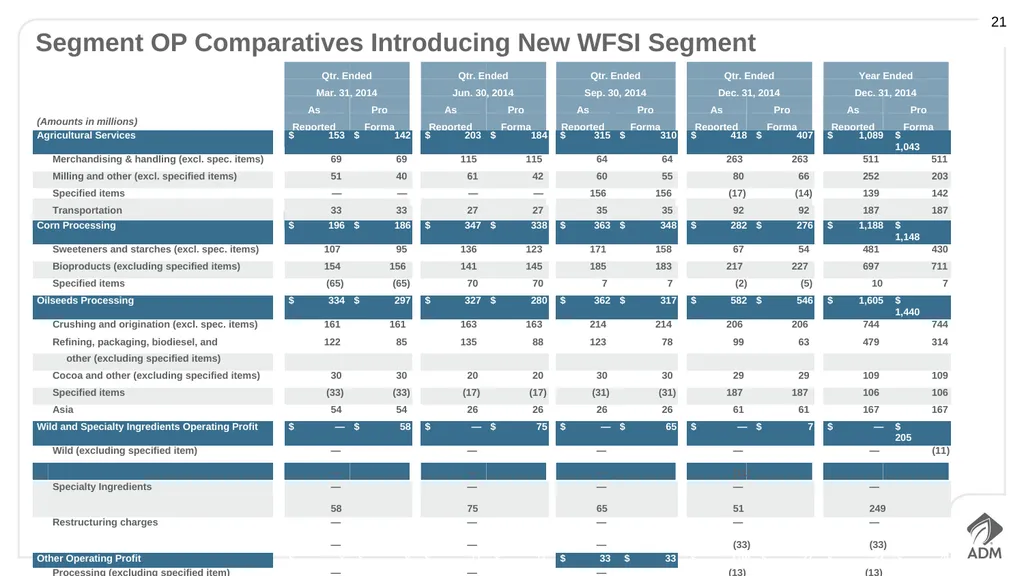
21 Segment OP Comparatives Introducing New WFSI Segment Qtr. Ended Mar. 31, 2014 Qtr. Ended Jun. 30, 2014 Qtr. Ended Sep. 30, 2014 Qtr. Ended Dec. 31, 2014 Year Ended Dec. 31, 2014 As Reported Pro Forma As Reported Pro Forma As Reported Pro Forma As Reported Pro Forma As Reported Pro Forma (Amounts in millions)<br>
22
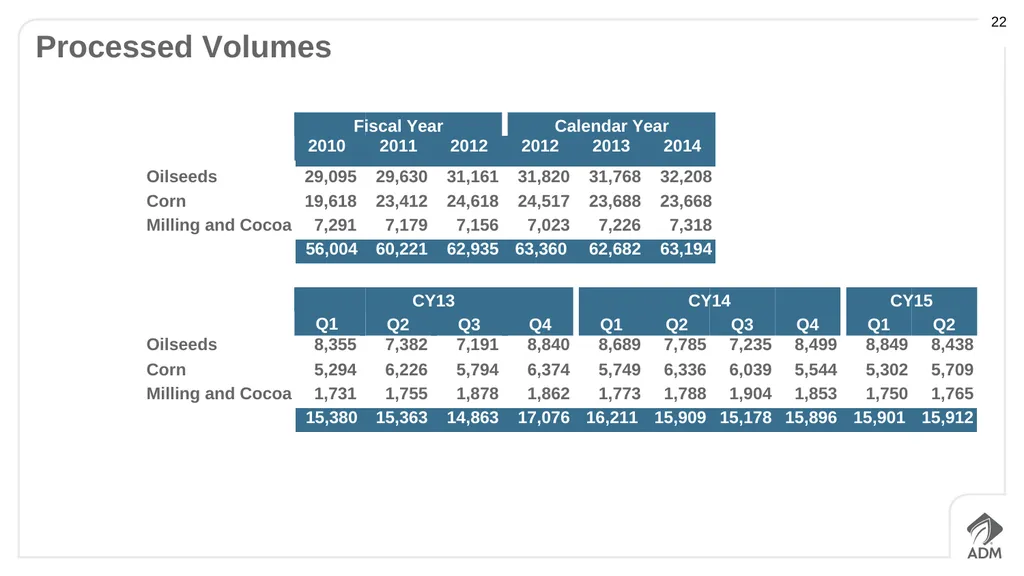
22 Processed Volumes Fiscal Year Calendar Year CY13 CY14 CY15 Q1 Q2 Q3 Q4 Q1 Q2 Q3 Q4 Q1 Q2<br>
23
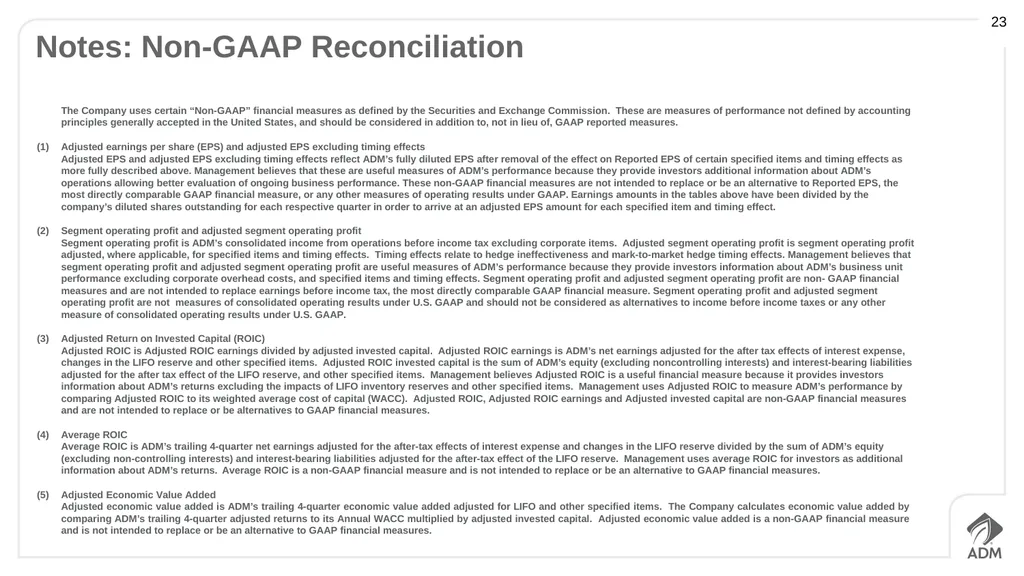
23 Notes: Non-GAAP Reconciliation The Company uses certain “Non-GAAP” financial measures as defined by the Securities and Exchange Commission. These are measures of performance not defined by accounting principles generally accepted in the United States, and should be considered in addition to, not in lieu of, GAAP reported measures.
Adjusted earnings per share (EPS) and adjusted EPS excluding timing effects
Adjusted EPS and adjusted EPS excluding timing effects reflect ADM’s fully diluted EPS after removal of the effect on Reported EPS of certain specified items and timing effects as more fully described above. Management believes that these are useful measures of ADM’s performance because they provide investors additional information about ADM’s operations allowing better evaluation of ongoing business performance. These non-GAAP financial measures are not intended to replace or be an alternative to Reported EPS, the most directly comparable GAAP financial measure, or any other measures of operating results under GAAP. Earnings amounts in the tables above have been divided by the company’s diluted shares outstanding for each respective quarter in order to arrive at an adjusted EPS amount for each specified item and timing effect.
Segment operating profit and adjusted segment operating profit
Segment operating profit is ADM’s consolidated income from operations before income tax excluding corporate items. Adjusted segment operating profit is segment operating profit adjusted, where applicable, for specified items and timing effects. Timing effects relate to hedge ineffectiveness and mark-to-market hedge timing effects. Management believes that segment operating profit and adjusted segment operating profit are useful measures of ADM’s performance because they provide investors information about ADM’s business unit performance excluding corporate overhead costs, and specified items and timing effects. Segment operating profit and adjusted segment operating profit are non- GAAP financial measures and are not intended to replace earnings before income tax, the most directly comparable GAAP financial measure. Segment operating profit and adjusted segment operating profit are not measures of consolidated operating results under U.S. GAAP and should not be considered as alternatives to income before income taxes or any other measure of consolidated operating results under U.S. GAAP.
Adjusted Return on Invested Capital (ROIC)
Adjusted ROIC is Adjusted ROIC earnings divided by adjusted invested capital. Adjusted ROIC earnings is ADM’s net earnings adjusted for the after tax effects of interest expense, changes in the LIFO reserve and other specified items. Adjusted ROIC invested capital is the sum of ADM’s equity (excluding noncontrolling interests) and interest-bearing liabilities adjusted for the after tax effect of the LIFO reserve, and other specified items. Management believes Adjusted ROIC is a useful financial measure because it provides investors information about ADM’s returns excluding the impacts of LIFO inventory reserves and other specified items. Management uses Adjusted ROIC to measure ADM’s performance by comparing Adjusted ROIC to its weighted average cost of capital (WACC). Adjusted ROIC, Adjusted ROIC earnings and Adjusted invested capital are non-GAAP financial measures and are not intended to replace or be alternatives to GAAP financial measures.
Average ROIC
Average ROIC is ADM’s trailing 4-quarter net earnings adjusted for the after-tax effects of interest expense and changes in the LIFO reserve divided by the sum of ADM’s equity (excluding non-controlling interests) and interest-bearing liabilities adjusted for the after-tax effect of the LIFO reserve. Management uses average ROIC for investors as additional information about ADM’s returns. Average ROIC is a non-GAAP financial measure and is not intended to replace or be an alternative to GAAP financial measures.
Adjusted Economic Value Added
Adjusted economic value added is ADM’s trailing 4-quarter economic value added adjusted for LIFO and other specified items. The Company calculates economic value added by comparing ADM’s trailing 4-quarter adjusted returns to its Annual WACC multiplied by adjusted invested capital. Adjusted economic value added is a non-GAAP financial measure and is not intended to replace or be an alternative to GAAP financial measures.<br>
Adjusted earnings per share (EPS) and adjusted EPS excluding timing effects
Adjusted EPS and adjusted EPS excluding timing effects reflect ADM’s fully diluted EPS after removal of the effect on Reported EPS of certain specified items and timing effects as more fully described above. Management believes that these are useful measures of ADM’s performance because they provide investors additional information about ADM’s operations allowing better evaluation of ongoing business performance. These non-GAAP financial measures are not intended to replace or be an alternative to Reported EPS, the most directly comparable GAAP financial measure, or any other measures of operating results under GAAP. Earnings amounts in the tables above have been divided by the company’s diluted shares outstanding for each respective quarter in order to arrive at an adjusted EPS amount for each specified item and timing effect.
Segment operating profit and adjusted segment operating profit
Segment operating profit is ADM’s consolidated income from operations before income tax excluding corporate items. Adjusted segment operating profit is segment operating profit adjusted, where applicable, for specified items and timing effects. Timing effects relate to hedge ineffectiveness and mark-to-market hedge timing effects. Management believes that segment operating profit and adjusted segment operating profit are useful measures of ADM’s performance because they provide investors information about ADM’s business unit performance excluding corporate overhead costs, and specified items and timing effects. Segment operating profit and adjusted segment operating profit are non- GAAP financial measures and are not intended to replace earnings before income tax, the most directly comparable GAAP financial measure. Segment operating profit and adjusted segment operating profit are not measures of consolidated operating results under U.S. GAAP and should not be considered as alternatives to income before income taxes or any other measure of consolidated operating results under U.S. GAAP.
Adjusted Return on Invested Capital (ROIC)
Adjusted ROIC is Adjusted ROIC earnings divided by adjusted invested capital. Adjusted ROIC earnings is ADM’s net earnings adjusted for the after tax effects of interest expense, changes in the LIFO reserve and other specified items. Adjusted ROIC invested capital is the sum of ADM’s equity (excluding noncontrolling interests) and interest-bearing liabilities adjusted for the after tax effect of the LIFO reserve, and other specified items. Management believes Adjusted ROIC is a useful financial measure because it provides investors information about ADM’s returns excluding the impacts of LIFO inventory reserves and other specified items. Management uses Adjusted ROIC to measure ADM’s performance by comparing Adjusted ROIC to its weighted average cost of capital (WACC). Adjusted ROIC, Adjusted ROIC earnings and Adjusted invested capital are non-GAAP financial measures and are not intended to replace or be alternatives to GAAP financial measures.
Average ROIC
Average ROIC is ADM’s trailing 4-quarter net earnings adjusted for the after-tax effects of interest expense and changes in the LIFO reserve divided by the sum of ADM’s equity (excluding non-controlling interests) and interest-bearing liabilities adjusted for the after-tax effect of the LIFO reserve. Management uses average ROIC for investors as additional information about ADM’s returns. Average ROIC is a non-GAAP financial measure and is not intended to replace or be an alternative to GAAP financial measures.
Adjusted Economic Value Added
Adjusted economic value added is ADM’s trailing 4-quarter economic value added adjusted for LIFO and other specified items. The Company calculates economic value added by comparing ADM’s trailing 4-quarter adjusted returns to its Annual WACC multiplied by adjusted invested capital. Adjusted economic value added is a non-GAAP financial measure and is not intended to replace or be an alternative to GAAP financial measures.<br>