
Session 4: Measurement, Measurement Error, and
SB
Published · 32 slides · 0 views
1 / 1

Description
Session 4: Measurement, Measurement Error, and Descriptive Statistics January 20, 2015 Vicki M. Young, Chief Operating Officer South Carolina Primary Health Care Association Presenter Vicki M. Young, PhD Chief Operating Officer South
Related Topics
Share
Embed code
Download this presentation From Below
"Session 4: Measurement, Measurement Error, and" is the property of its rightful owner. Permission is granted to download and print the materials on this website for personal, non-commercial use only, and to display it on your personal computer provided you do not modify the materials and that you retain all copyright notices contained in the materials. By downloading content from our website, you accept the terms of this agreement.
Presentation Transcript
01
Session 4: Measurement, Measurement Error, and Descriptive Statistics January 20, 2015
Vicki M. Young, Chief Operating Officer
South Carolina Primary Health Care Association<br>
Vicki M. Young, Chief Operating Officer
South Carolina Primary Health Care Association<br>
02
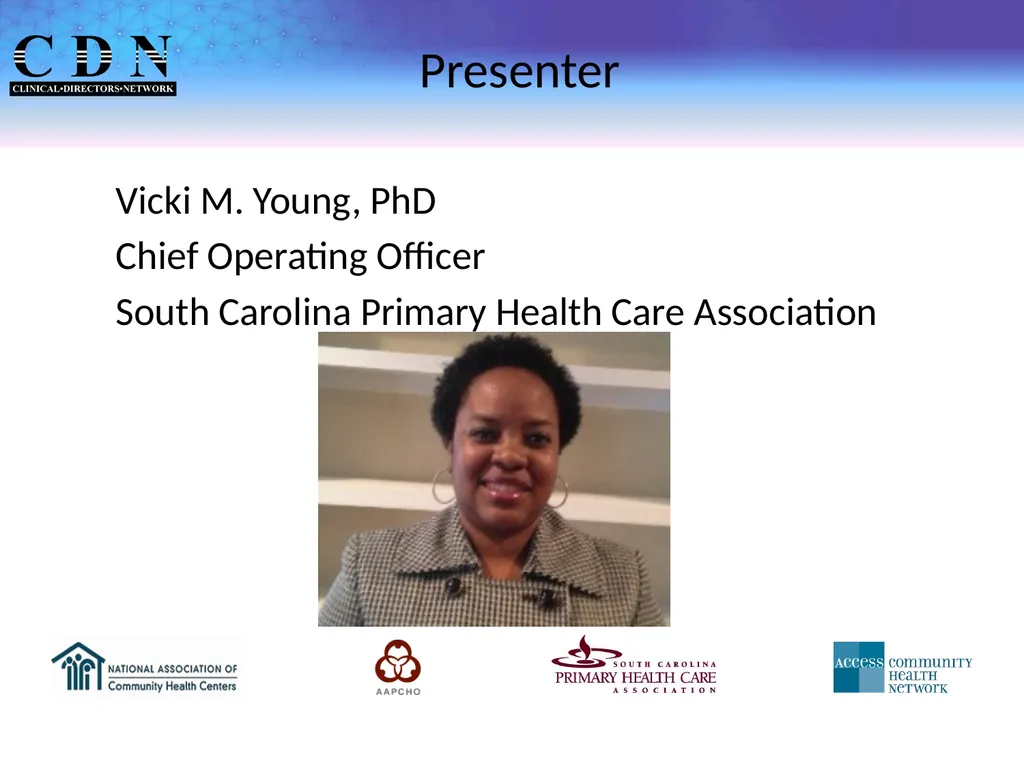
Presenter Vicki M. Young, PhD
Chief Operating Officer
South Carolina Primary Health Care Association<br>
Chief Operating Officer
South Carolina Primary Health Care Association<br>
03
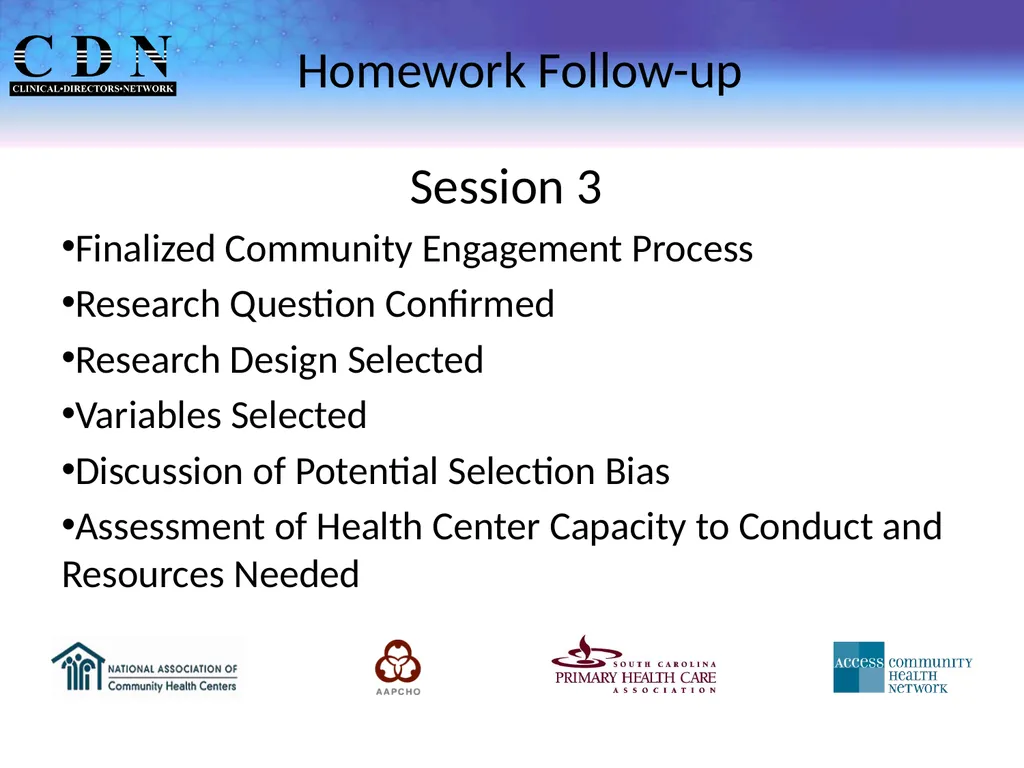
Homework Follow-up Session 3
Finalized Community Engagement Process
Research Question Confirmed
Research Design Selected
Variables Selected
Discussion of Potential Selection Bias
Assessment of Health Center Capacity to Conduct and Resources Needed<br>
Finalized Community Engagement Process
Research Question Confirmed
Research Design Selected
Variables Selected
Discussion of Potential Selection Bias
Assessment of Health Center Capacity to Conduct and Resources Needed<br>
04
Training Goals Review and Discuss Measurement in Health Services Research
Review Types of Measurement Error and Ways to Reduce Measurement Error
Review Descriptive Statistics Utilized in Health Services Research<br>
Review Types of Measurement Error and Ways to Reduce Measurement Error
Review Descriptive Statistics Utilized in Health Services Research<br>
05
MEASUREMENT<br>
06
Definition “Measurement is the process of specifying and operationalizing a given concept.”
In this instance, the research question (concept) is detailed to the point that all components of the question are defined
Source: Shi, L.(2008) Health Services Research Methods (2nd ed.). Delmar Cengage Learning<br>
In this instance, the research question (concept) is detailed to the point that all components of the question are defined
Source: Shi, L.(2008) Health Services Research Methods (2nd ed.). Delmar Cengage Learning<br>
07
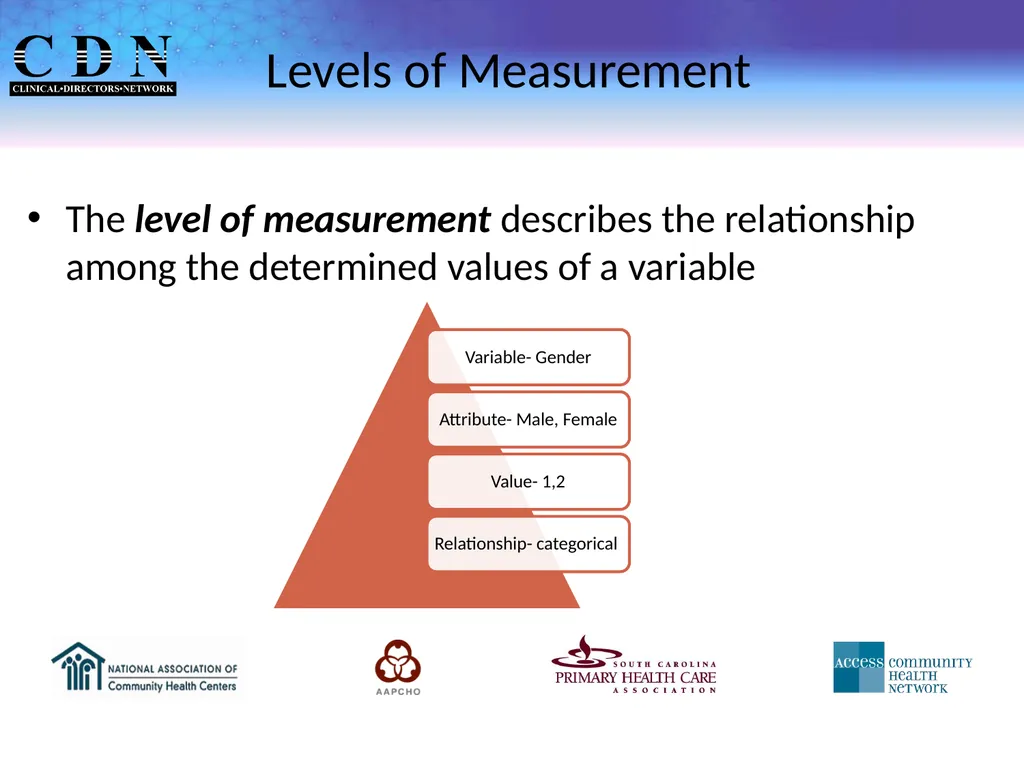
Levels of Measurement The level of measurement describes the relationship among the determined values of a variable<br>
08
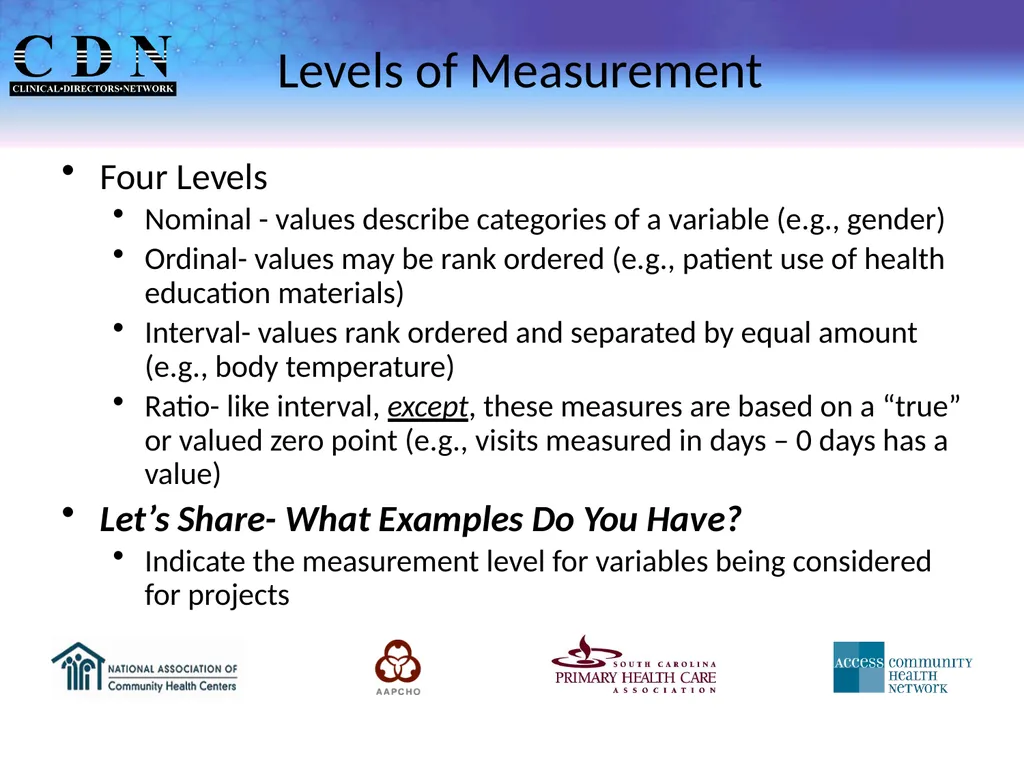
Levels of Measurement Four Levels
Nominal - values describe categories of a variable (e.g., gender)
Ordinal- values may be rank ordered (e.g., patient use of health education materials)
Interval- values rank ordered and separated by equal amount (e.g., body temperature)
Ratio- like interval, except, these measures are based on a “true” or valued zero point (e.g., visits measured in days – 0 days has a value)
Let’s Share- What Examples Do You Have?
Indicate the measurement level for variables being considered for projects<br>
Nominal - values describe categories of a variable (e.g., gender)
Ordinal- values may be rank ordered (e.g., patient use of health education materials)
Interval- values rank ordered and separated by equal amount (e.g., body temperature)
Ratio- like interval, except, these measures are based on a “true” or valued zero point (e.g., visits measured in days – 0 days has a value)
Let’s Share- What Examples Do You Have?
Indicate the measurement level for variables being considered for projects<br>
09
MEASUREMENT ERROR<br>
10
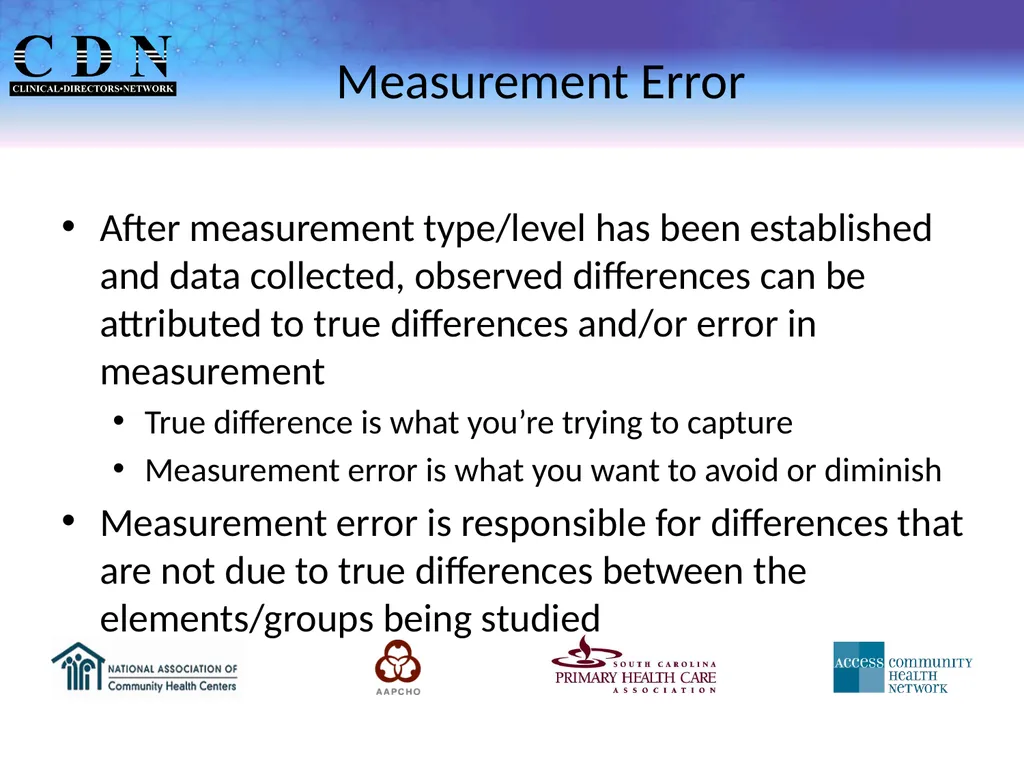
Measurement Error After measurement type/level has been established and data collected, observed differences can be attributed to true differences and/or error in measurement
True difference is what you’re trying to capture
Measurement error is what you want to avoid or diminish
Measurement error is responsible for differences that are not due to true differences between the elements/groups being studied<br>
True difference is what you’re trying to capture
Measurement error is what you want to avoid or diminish
Measurement error is responsible for differences that are not due to true differences between the elements/groups being studied<br>
11
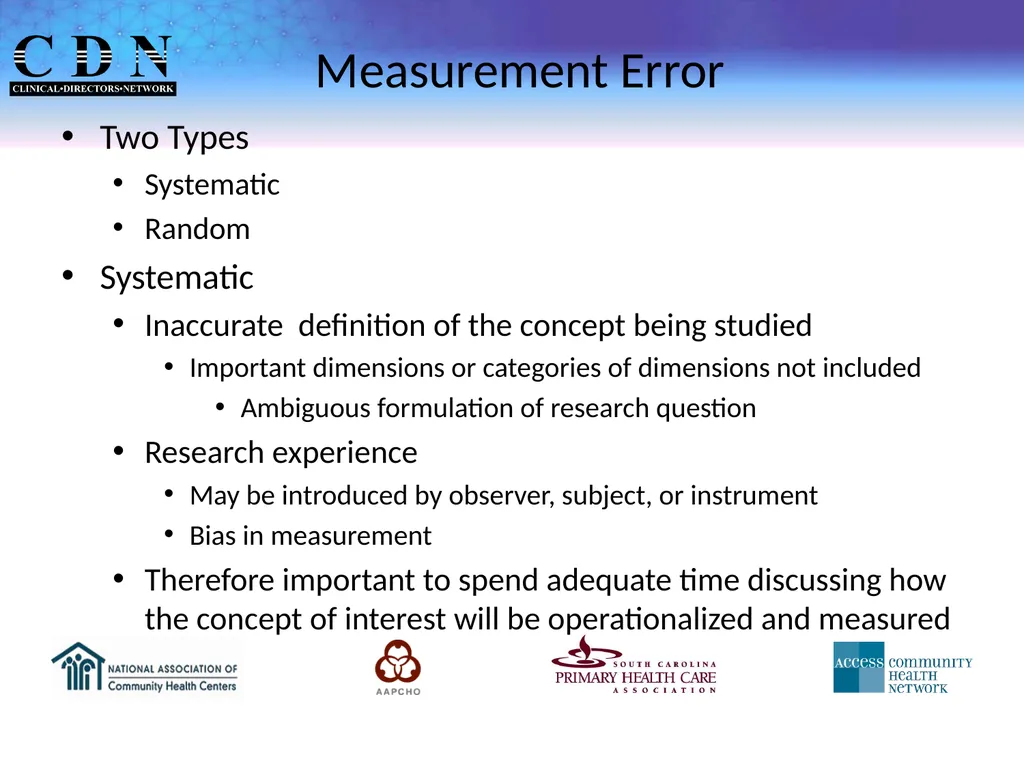
Measurement Error Two Types
Systematic
Random
Systematic
Inaccurate definition of the concept being studied
Important dimensions or categories of dimensions not included
Ambiguous formulation of research question
Research experience
May be introduced by observer, subject, or instrument
Bias in measurement
Therefore important to spend adequate time discussing how the concept of interest will be operationalized and measured<br>
Systematic
Random
Systematic
Inaccurate definition of the concept being studied
Important dimensions or categories of dimensions not included
Ambiguous formulation of research question
Research experience
May be introduced by observer, subject, or instrument
Bias in measurement
Therefore important to spend adequate time discussing how the concept of interest will be operationalized and measured<br>
12
Measurement Error Random (Non-systematic)
Characteristics of participants affect the measurement process
May be introduced by observer, subject, or instrument
Difference in attitude that affects the observation
Observer/Interview understanding in training
Systematic error is greater threat to a study than random error
Seek to reduce measurement error where possible
At a minimum, study the potential error so it can be addressed and/or described<br>
Characteristics of participants affect the measurement process
May be introduced by observer, subject, or instrument
Difference in attitude that affects the observation
Observer/Interview understanding in training
Systematic error is greater threat to a study than random error
Seek to reduce measurement error where possible
At a minimum, study the potential error so it can be addressed and/or described<br>
13
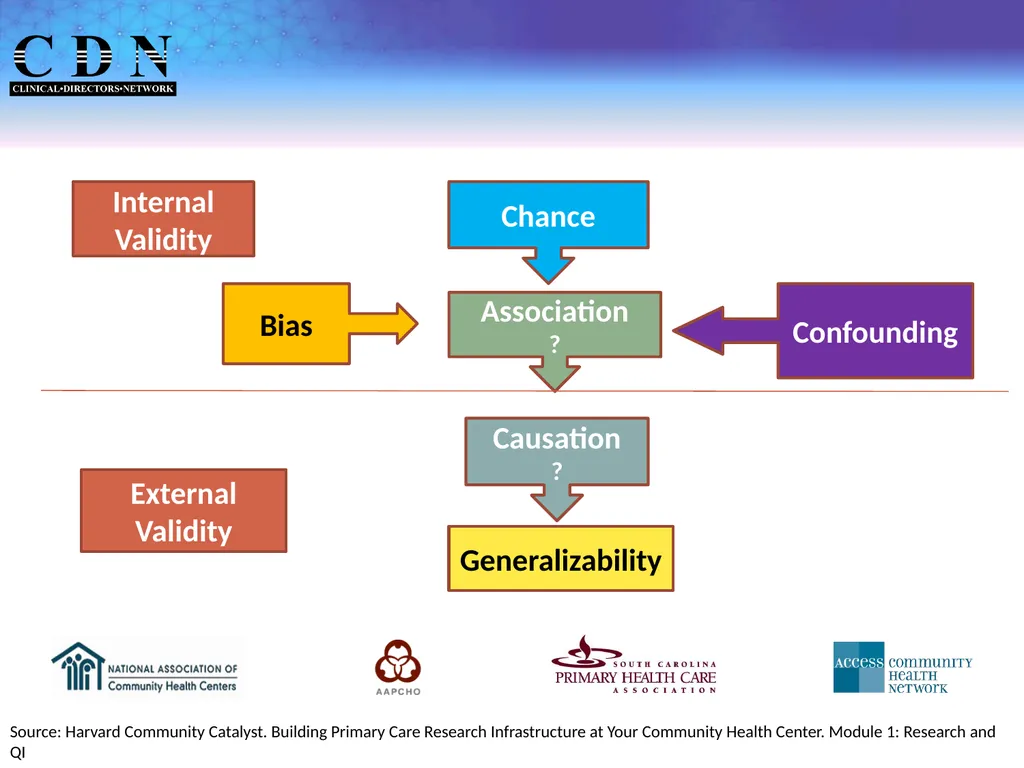
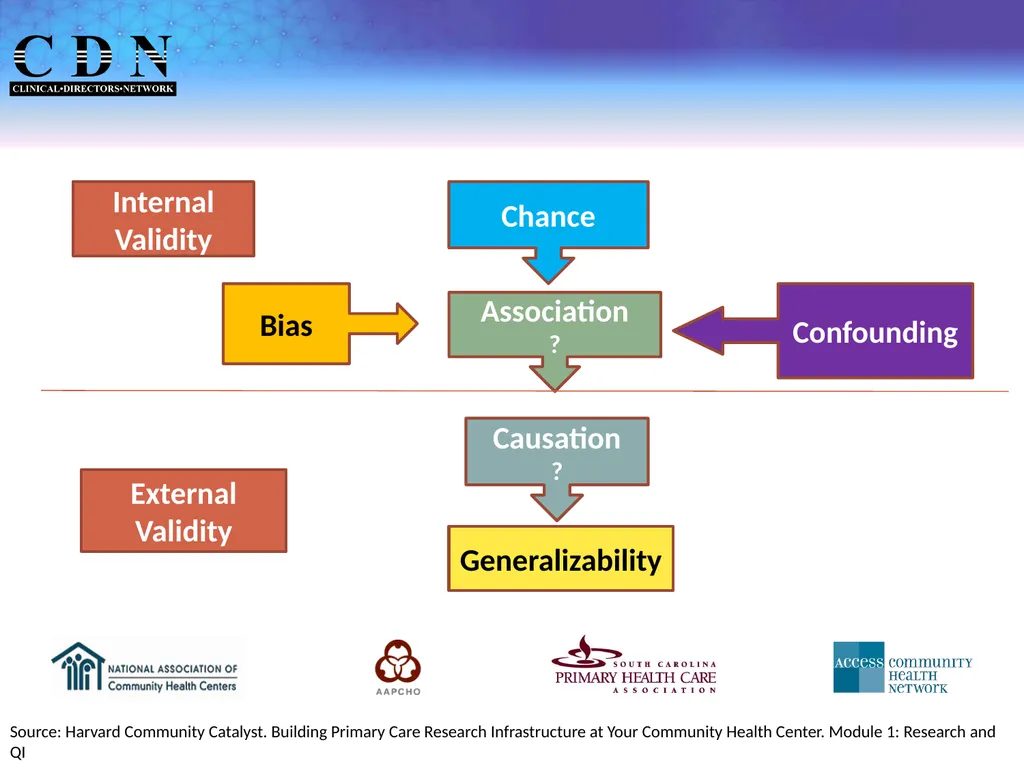
Generalizability External Validity Internal Validity Bias Confounding Causation
? Association
? Chance Source: Harvard Community Catalyst. Building Primary Care Research Infrastructure at Your Community Health Center. Module 1: Research and QI<br>
? Association
? Chance Source: Harvard Community Catalyst. Building Primary Care Research Infrastructure at Your Community Health Center. Module 1: Research and QI<br>
14
Reduction in Measurement Error Validate or Use Previously Validated Measurement Tool or Procedure
Train Observer/Researcher
Validate Data Entry
Take time to review data once entered
Conduct Statistical Procedures
Increased Repetition in Measurement
Greater number of data points
Use More than One Measure of the Same Variable<br>
Train Observer/Researcher
Validate Data Entry
Take time to review data once entered
Conduct Statistical Procedures
Increased Repetition in Measurement
Greater number of data points
Use More than One Measure of the Same Variable<br>
15
Descriptive Statistics<br>
16
Definition and Types Descriptive statistics quantitatively describe the main features of a collection of information or data.
Summarizes characteristics of groups in a manageable way
Univariate Analysis (examines characteristics of one variable at a time)
Central Tendency
Dispersion
Distribution
Central Tendency
Mode
Median
Mean
Source: Mann, P. S. (1995). Introductory Statistics (2nd ed.). Wiley<br>
Summarizes characteristics of groups in a manageable way
Univariate Analysis (examines characteristics of one variable at a time)
Central Tendency
Dispersion
Distribution
Central Tendency
Mode
Median
Mean
Source: Mann, P. S. (1995). Introductory Statistics (2nd ed.). Wiley<br>
17
Types (cont.) Dispersion /Variability
Range
Variance
Standard Deviation
Distribution
Frequency
Percentage<br>
Range
Variance
Standard Deviation
Distribution
Frequency
Percentage<br>
18
Measures of Central Tendency Provides summary of information about a central value
Mode
Value of the data points (distribution) that occurs most frequently
Most often used with nominal level data
Median
Mid-point of a distribution of data points
Most often used with ordinal, interval, and ratio level data
Not affected by extreme values<br>
Mode
Value of the data points (distribution) that occurs most frequently
Most often used with nominal level data
Median
Mid-point of a distribution of data points
Most often used with ordinal, interval, and ratio level data
Not affected by extreme values<br>
19
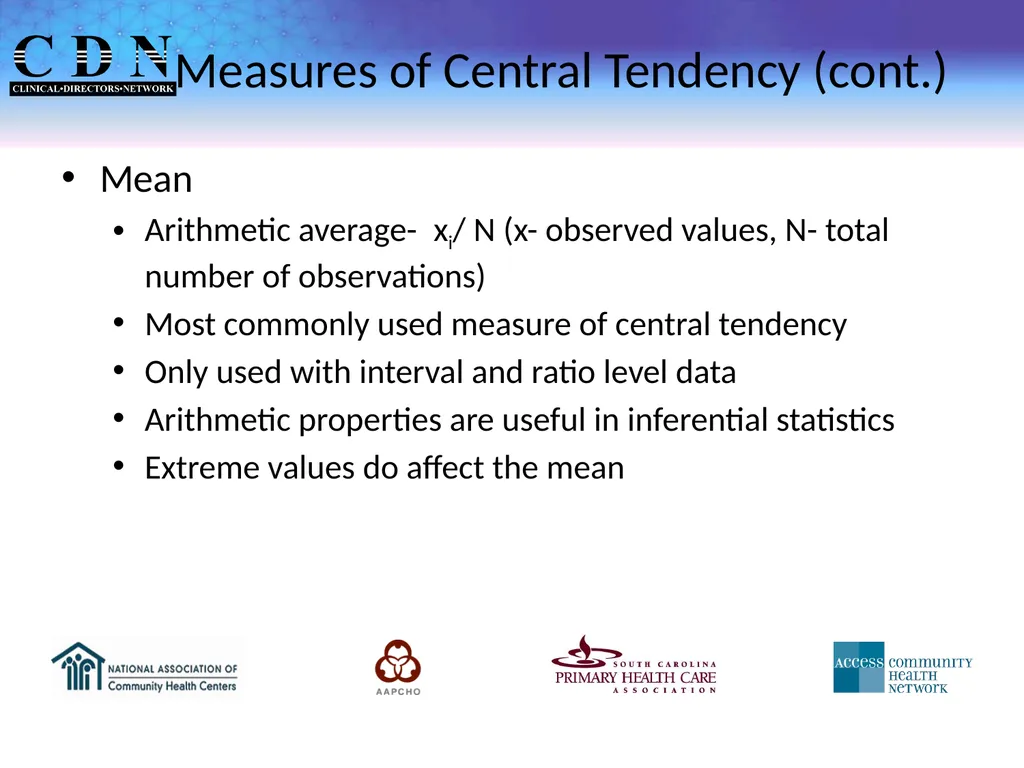
Measures of Central Tendency (cont.) Mean
Arithmetic average- xi/ N (x- observed values, N- total number of observations)
Most commonly used measure of central tendency
Only used with interval and ratio level data
Arithmetic properties are useful in inferential statistics
Extreme values do affect the mean<br>
Arithmetic average- xi/ N (x- observed values, N- total number of observations)
Most commonly used measure of central tendency
Only used with interval and ratio level data
Arithmetic properties are useful in inferential statistics
Extreme values do affect the mean<br>
20
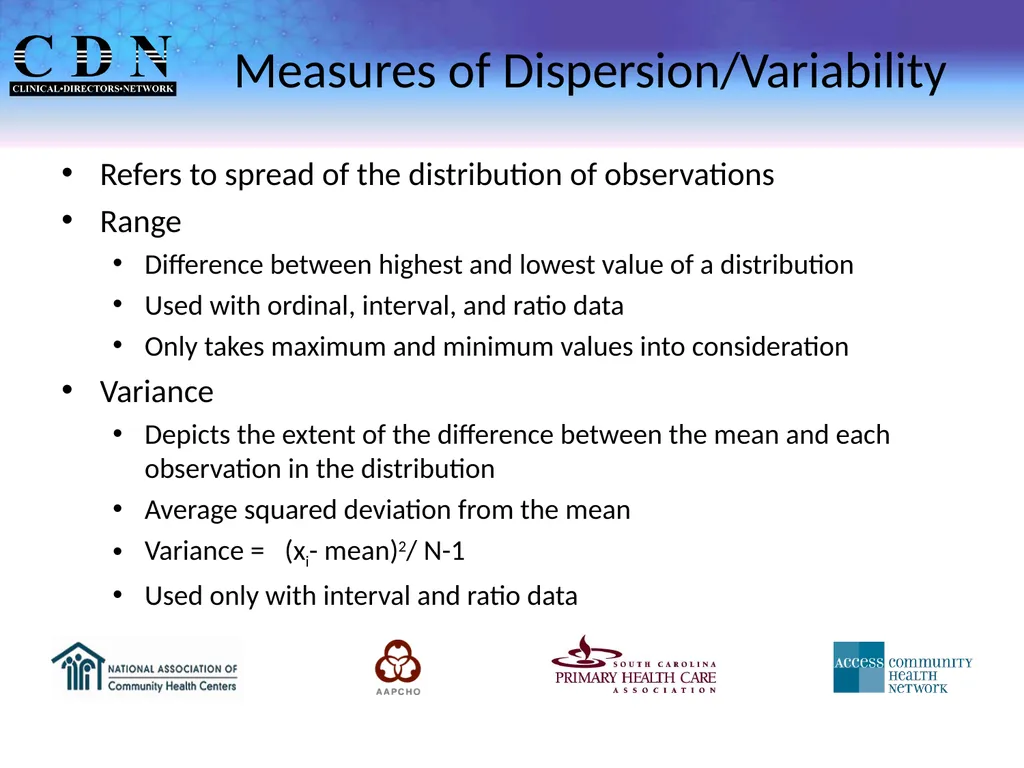
Measures of Dispersion/Variability Refers to spread of the distribution of observations
Range
Difference between highest and lowest value of a distribution
Used with ordinal, interval, and ratio data
Only takes maximum and minimum values into consideration
Variance
Depicts the extent of the difference between the mean and each observation in the distribution
Average squared deviation from the mean
Variance = (xi- mean)2/ N-1
Used only with interval and ratio data<br>
Range
Difference between highest and lowest value of a distribution
Used with ordinal, interval, and ratio data
Only takes maximum and minimum values into consideration
Variance
Depicts the extent of the difference between the mean and each observation in the distribution
Average squared deviation from the mean
Variance = (xi- mean)2/ N-1
Used only with interval and ratio data<br>
21
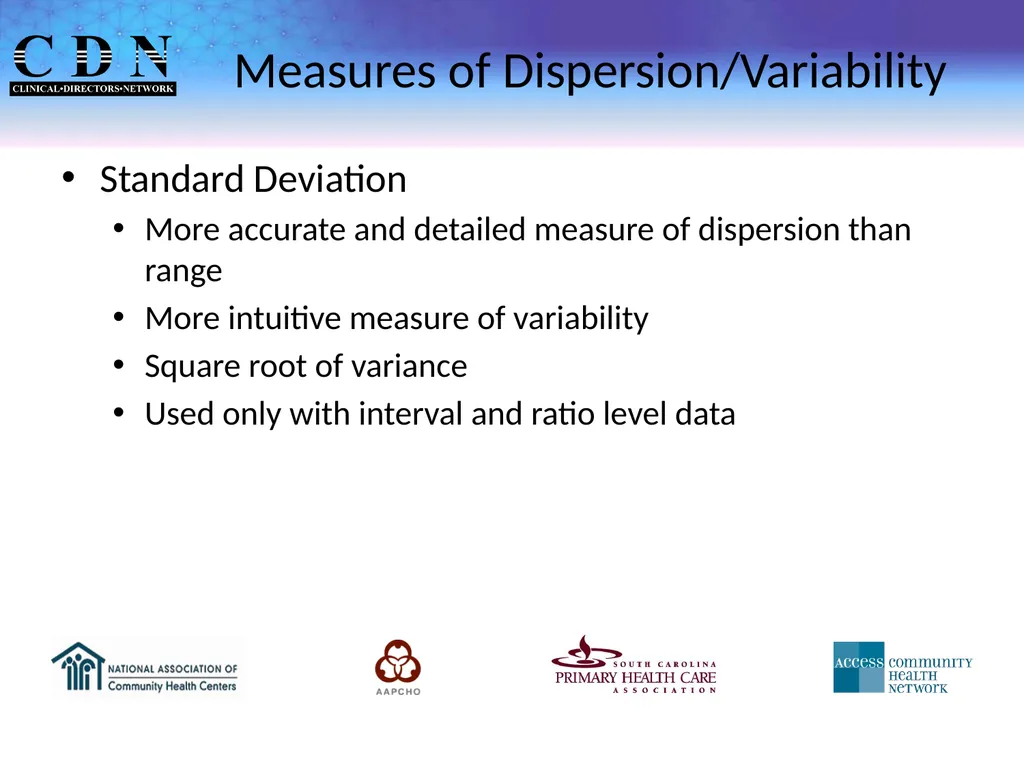
Measures of Dispersion/Variability Standard Deviation
More accurate and detailed measure of dispersion than range
More intuitive measure of variability
Square root of variance
Used only with interval and ratio level data<br>
More accurate and detailed measure of dispersion than range
More intuitive measure of variability
Square root of variance
Used only with interval and ratio level data<br>
22
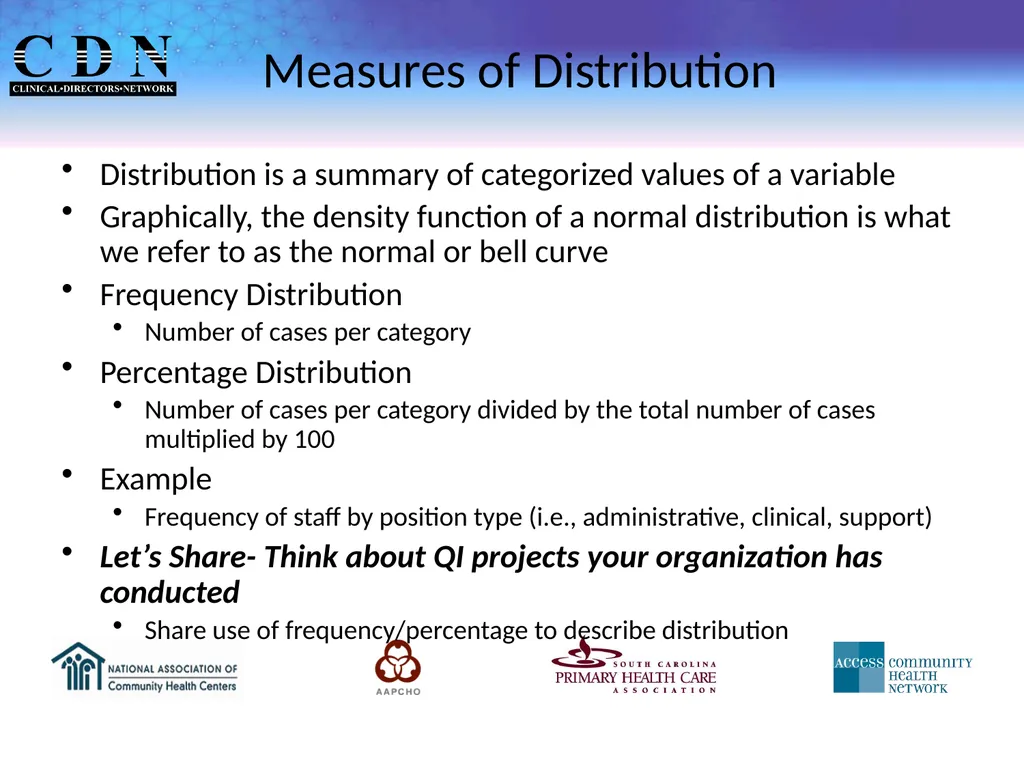
Measures of Distribution Distribution is a summary of categorized values of a variable
Graphically, the density function of a normal distribution is what we refer to as the normal or bell curve
Frequency Distribution
Number of cases per category
Percentage Distribution
Number of cases per category divided by the total number of cases multiplied by 100
Example
Frequency of staff by position type (i.e., administrative, clinical, support)
Let’s Share- Think about QI projects your organization has conducted
Share use of frequency/percentage to describe distribution<br>
Graphically, the density function of a normal distribution is what we refer to as the normal or bell curve
Frequency Distribution
Number of cases per category
Percentage Distribution
Number of cases per category divided by the total number of cases multiplied by 100
Example
Frequency of staff by position type (i.e., administrative, clinical, support)
Let’s Share- Think about QI projects your organization has conducted
Share use of frequency/percentage to describe distribution<br>
23
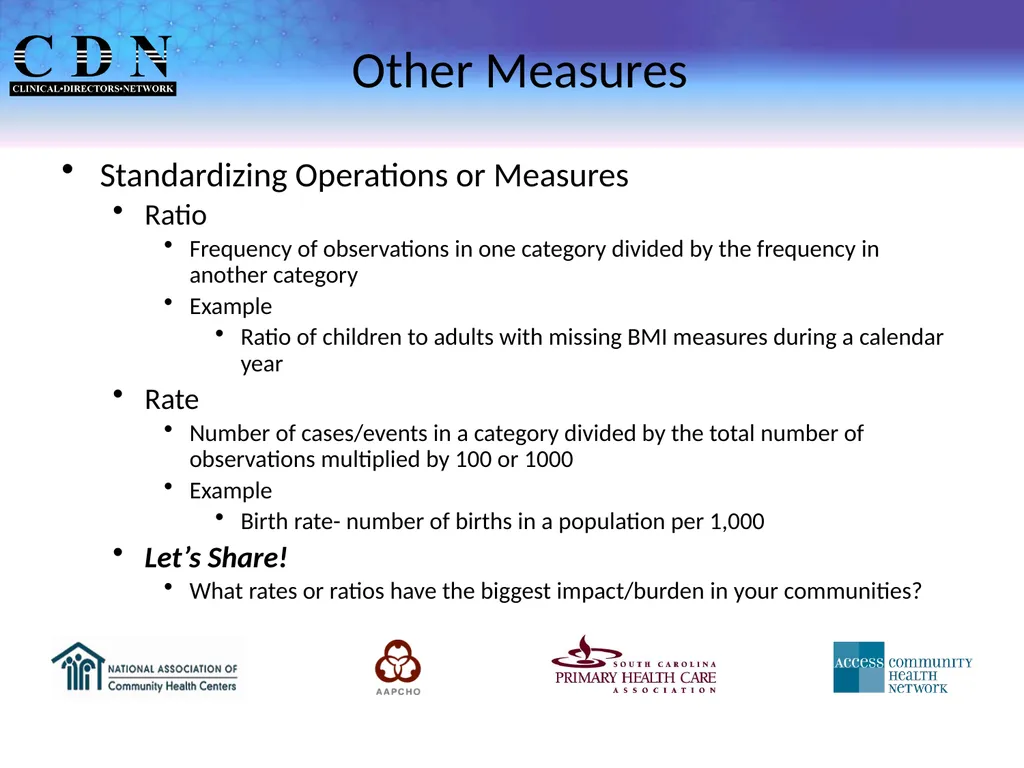
Other Measures Standardizing Operations or Measures
Ratio
Frequency of observations in one category divided by the frequency in another category
Example
Ratio of children to adults with missing BMI measures during a calendar year
Rate
Number of cases/events in a category divided by the total number of observations multiplied by 100 or 1000
Example
Birth rate- number of births in a population per 1,000
Let’s Share!
What rates or ratios have the biggest impact/burden in your communities?<br>
Ratio
Frequency of observations in one category divided by the frequency in another category
Example
Ratio of children to adults with missing BMI measures during a calendar year
Rate
Number of cases/events in a category divided by the total number of observations multiplied by 100 or 1000
Example
Birth rate- number of births in a population per 1,000
Let’s Share!
What rates or ratios have the biggest impact/burden in your communities?<br>
24
Other Measures Measures of Morbidity
Incidence
Number of NEW cases of a disease
Defined population
Specified time period
Prevalence
Number of cases of a disease
Defined population
Specific point in time
Measure of Risk
Attributable Risk
Difference in rate of a disease/condition in an exposed population and the rate in an unexposed population
Difference in risk of exposed and unexposed individuals<br>
Incidence
Number of NEW cases of a disease
Defined population
Specified time period
Prevalence
Number of cases of a disease
Defined population
Specific point in time
Measure of Risk
Attributable Risk
Difference in rate of a disease/condition in an exposed population and the rate in an unexposed population
Difference in risk of exposed and unexposed individuals<br>
25
Measure of Association Bivariate Measures
Relative Risk (RR)
Measures strength of association between independent variable (e.g., risk factor) and an outcome (occurrence of event)
Risk of developing an outcome based on exposure to independent variable
RR= Incidence in exposed group/ Incidence of disease in unexposed group
Use in prospective studies – randomized clinical trial or cohort study
Confidence Interval
Estimated range that is likely to include the value of the variable/indicator of interest
Calculated from sample data.
Source: Easton, V.J. Statistics Glossary (v1.1).<br>
Relative Risk (RR)
Measures strength of association between independent variable (e.g., risk factor) and an outcome (occurrence of event)
Risk of developing an outcome based on exposure to independent variable
RR= Incidence in exposed group/ Incidence of disease in unexposed group
Use in prospective studies – randomized clinical trial or cohort study
Confidence Interval
Estimated range that is likely to include the value of the variable/indicator of interest
Calculated from sample data.
Source: Easton, V.J. Statistics Glossary (v1.1).<br>
26
Measure of Association Bivariate Measures
Odds Ratio (OR)
Measures strength of association between independent variable and an outcome (occurrence of event)
Ratio of the odds of developing a disease (an outcome) given exposure ( independent variable) and the odds of developing the disease given non-exposure
Used in retrospective- case-control studies
In rare conditions, OR approximates the RR<br>
Odds Ratio (OR)
Measures strength of association between independent variable and an outcome (occurrence of event)
Ratio of the odds of developing a disease (an outcome) given exposure ( independent variable) and the odds of developing the disease given non-exposure
Used in retrospective- case-control studies
In rare conditions, OR approximates the RR<br>
27
Generalizability External Validity Internal Validity Bias Confounding Causation
? Association
? Chance Source: Harvard Community Catalyst. Building Primary Care Research Infrastructure at Your Community Health Center. Module 1: Research and QI<br>
? Association
? Chance Source: Harvard Community Catalyst. Building Primary Care Research Infrastructure at Your Community Health Center. Module 1: Research and QI<br>
28
Questions? Discussion<br>
29
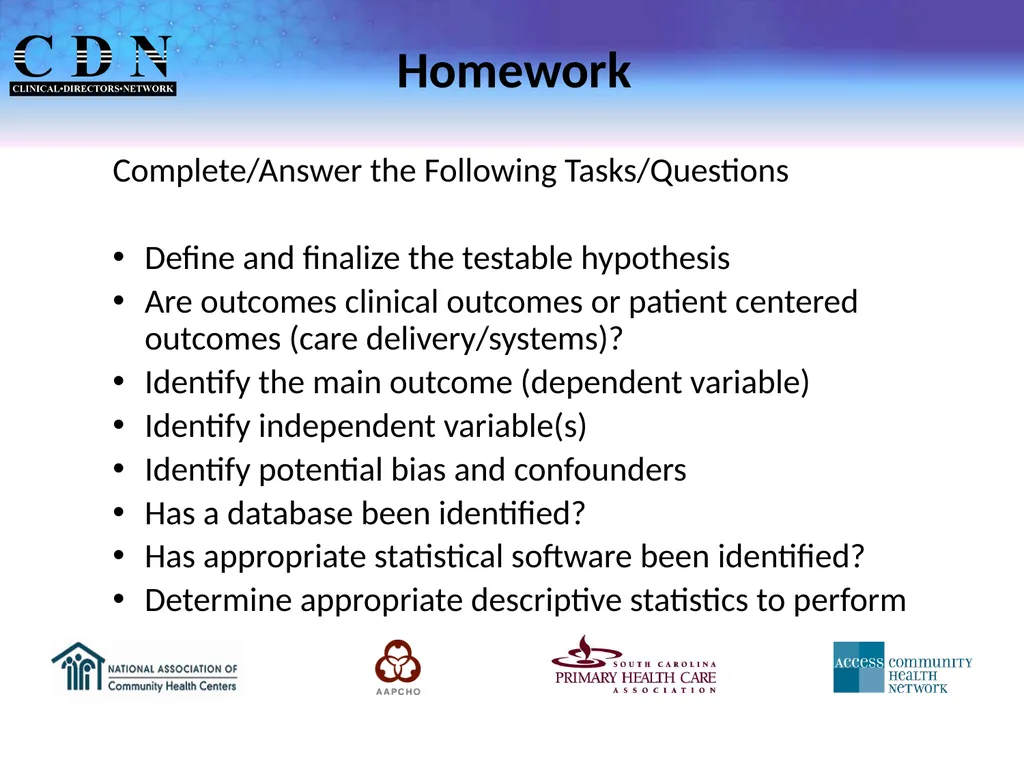
Homework Complete/Answer the Following Tasks/Questions
Define and finalize the testable hypothesis
Are outcomes clinical outcomes or patient centered outcomes (care delivery/systems)?
Identify the main outcome (dependent variable)
Identify independent variable(s)
Identify potential bias and confounders
Has a database been identified?
Has appropriate statistical software been identified?
Determine appropriate descriptive statistics to perform<br>
Define and finalize the testable hypothesis
Are outcomes clinical outcomes or patient centered outcomes (care delivery/systems)?
Identify the main outcome (dependent variable)
Identify independent variable(s)
Identify potential bias and confounders
Has a database been identified?
Has appropriate statistical software been identified?
Determine appropriate descriptive statistics to perform<br>
30
Sources
Shi, L.(2008) Health Services Research Methods (2nd ed.). Delmar Cengage Learning
Harvard Community Catalyst. Building Primary Care Research Infrastructure at Your Community Health Center. Module 1: Research and QI
Source: Mann, P. S. (1995). Introductory Statistics (2nd ed.). Wiley
Easton, V.J. Statistics Glossary (v1.1).<br>
Shi, L.(2008) Health Services Research Methods (2nd ed.). Delmar Cengage Learning
Harvard Community Catalyst. Building Primary Care Research Infrastructure at Your Community Health Center. Module 1: Research and QI
Source: Mann, P. S. (1995). Introductory Statistics (2nd ed.). Wiley
Easton, V.J. Statistics Glossary (v1.1).<br>
31
Next Webinar Sample Size, Power Calculations, and Sampling Methods
Tuesday, February 17th
3:30 – 5:00 pm EST<br>
Tuesday, February 17th
3:30 – 5:00 pm EST<br>
32
Vicki M. Young, PhD
Chief Operating Officer,
South Carolina Primary Health Care Association
T: (803) 788-2778
E: vickiy@scphca.org Thank You! 32<br>
Chief Operating Officer,
South Carolina Primary Health Care Association
T: (803) 788-2778
E: vickiy@scphca.org Thank You! 32<br>