
SNAPSHOT: Exhibition Industry India 2017 Status
MY
Published · 25 slides · 0 views

1 / 1
Description
SNAPSHOT: Exhibition Industry India 2017 Status Quo and Outlook The Indian Exhibition Industry - Open Seminar Expo 2018 HITEX, Hyderabad 10th May 2018 India economic performance gdp outlook 2020 Source: RBI, EAC research India emerged
Related Topics
Share
Embed code
Download this presentation From Below
"SNAPSHOT: Exhibition Industry India 2017 Status" is the property of its rightful owner. Permission is granted to download and print the materials on this website for personal, non-commercial use only, and to display it on your personal computer provided you do not modify the materials and that you retain all copyright notices contained in the materials. By downloading content from our website, you accept the terms of this agreement.
Presentation Transcript
01
SNAPSHOT: Exhibition Industry India 2017
Status Quo and Outlook The Indian Exhibition Industry - Open Seminar & Expo 2018 HITEX, Hyderabad 10th May 2018<br>
Status Quo and Outlook The Indian Exhibition Industry - Open Seminar & Expo 2018 HITEX, Hyderabad 10th May 2018<br>
02
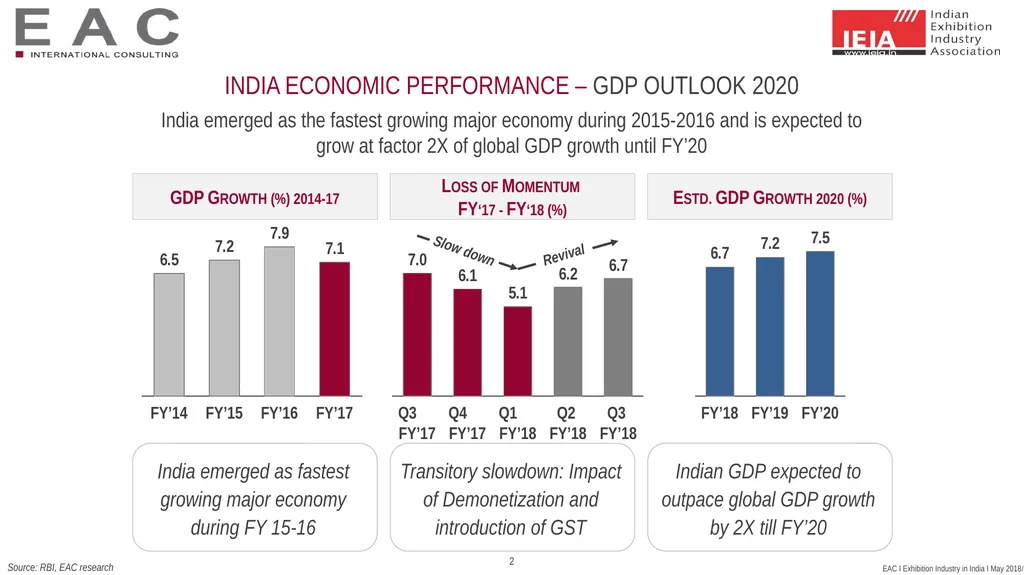
India economic performance – gdp outlook 2020 Source: RBI, EAC research India emerged as the fastest growing major economy during 2015-2016 and is expected to grow at factor 2X of global GDP growth until FY’20 GDP Growth (%) 2014-17 Loss of Momentum
FY‘17 - FY‘18 (%) Estd. GDP Growth 2020 (%) Indian GDP expected to outpace global GDP growth by 2X till FY’20 Transitory slowdown: Impact of Demonetization and introduction of GST India emerged as fastest growing major economy during FY 15-16 FY’14 FY’15 FY’16 FY’17 Q2
FY’18 Q3
FY’17 Q1
FY’18 Q4
FY’17 Q3
FY’18 FY’18 FY’19 FY’20 Slow down Revival 2<br>
FY‘17 - FY‘18 (%) Estd. GDP Growth 2020 (%) Indian GDP expected to outpace global GDP growth by 2X till FY’20 Transitory slowdown: Impact of Demonetization and introduction of GST India emerged as fastest growing major economy during FY 15-16 FY’14 FY’15 FY’16 FY’17 Q2
FY’18 Q3
FY’17 Q1
FY’18 Q4
FY’17 Q3
FY’18 FY’18 FY’19 FY’20 Slow down Revival 2<br>
03
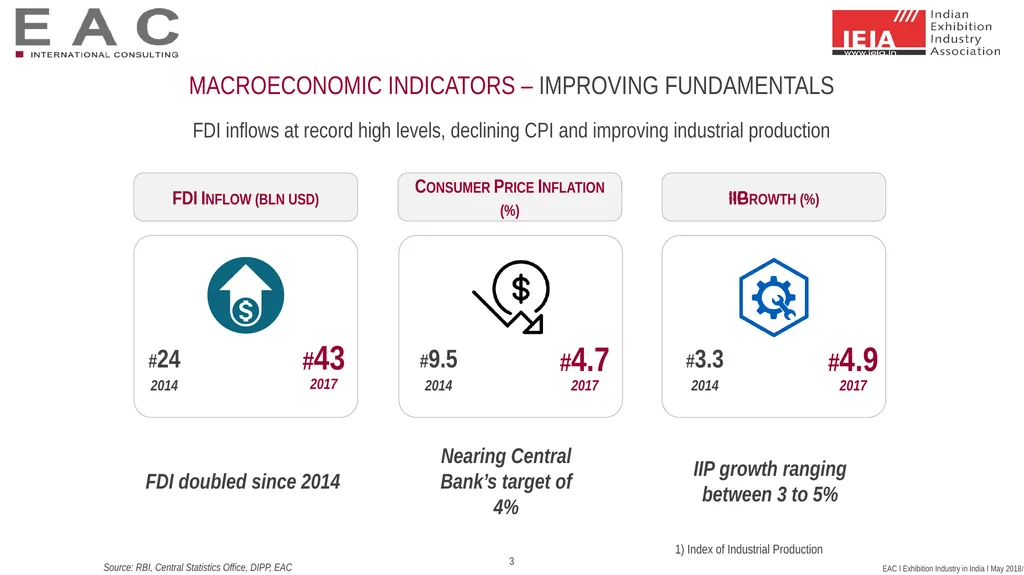
Macroeconomic indicators – Improving Fundamentals Source: RBI, Central Statistics Office, DIPP, EAC FDI inflows at record high levels, declining CPI and improving industrial production FDI Inflow (bln usd) #24 #43 FDI doubled since 2014 #9.5 #4.7 Nearing Central Bank’s target of 4% #3.3 #4.9 IIP growth ranging between 3 to 5% 2014 2017 2014 2017 2014 2017 Consumer Price Inflation (%) IIP1) Growth (%) 1) Index of Industrial Production 3<br>
04
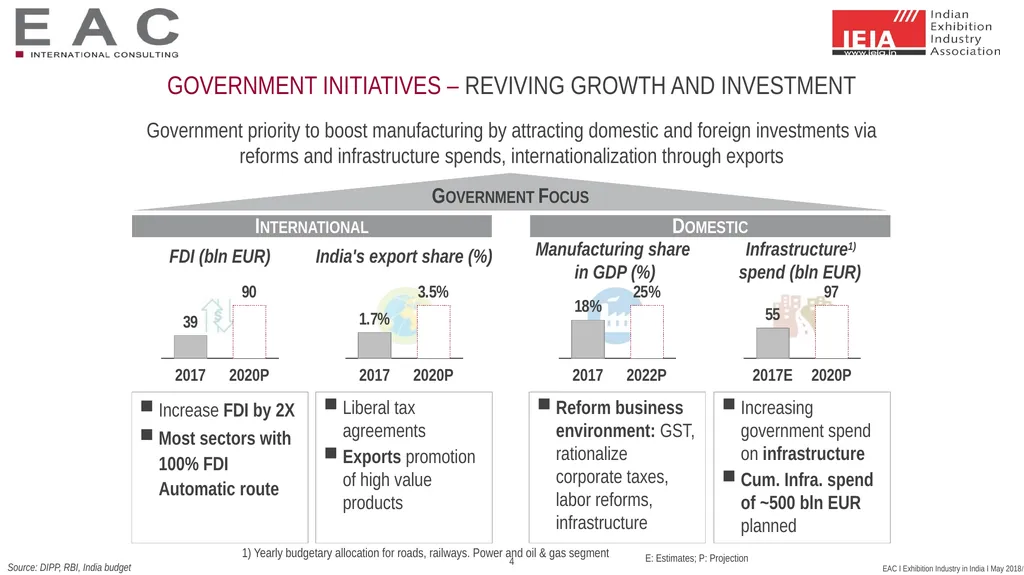
Government Initiatives – reviving growth and investment Source: DIPP, RBI, India budget Government priority to boost manufacturing by attracting domestic and foreign investments via reforms and infrastructure spends, internationalization through exports Increase FDI by 2X
Most sectors with 100% FDI Automatic route Liberal tax agreements
Exports promotion of high value products Reform business environment: GST, rationalize corporate taxes, labor reforms, infrastructure Increasing government spend on infrastructure
Cum. Infra. spend of ~500 bln EUR planned Government Focus International Domestic 2020P 2017 2017 2020P 2017 2022P 2020P 2017E FDI (bln EUR) India's export share (%) Manufacturing share
in GDP (%) Infrastructure1)
spend (bln EUR) E: Estimates; P: Projection 1) Yearly budgetary allocation for roads, railways. Power and oil & gas segment 4<br>
Most sectors with 100% FDI Automatic route Liberal tax agreements
Exports promotion of high value products Reform business environment: GST, rationalize corporate taxes, labor reforms, infrastructure Increasing government spend on infrastructure
Cum. Infra. spend of ~500 bln EUR planned Government Focus International Domestic 2020P 2017 2017 2020P 2017 2022P 2020P 2017E FDI (bln EUR) India's export share (%) Manufacturing share
in GDP (%) Infrastructure1)
spend (bln EUR) E: Estimates; P: Projection 1) Yearly budgetary allocation for roads, railways. Power and oil & gas segment 4<br>
05
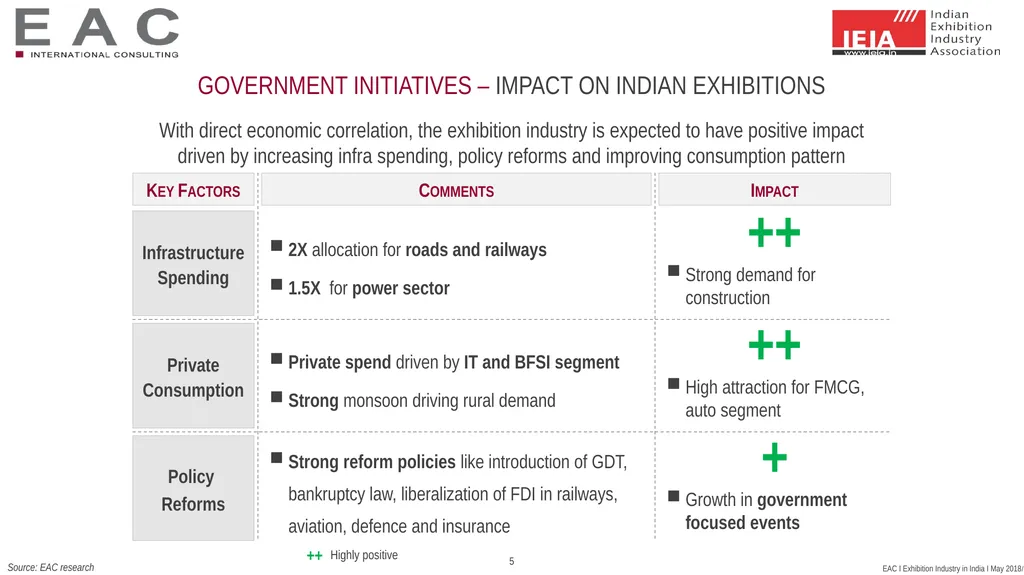
Source: EAC research With direct economic correlation, the exhibition industry is expected to have positive impact driven by increasing infra spending, policy reforms and improving consumption pattern Infrastructure Spending Key Factors Private Consumption Policy
Reforms 2X allocation for roads and railways
1.5X for power sector Comments Private spend driven by IT and BFSI segment
Strong monsoon driving rural demand Strong reform policies like introduction of GDT, bankruptcy law, liberalization of FDI in railways, aviation, defence and insurance Government initiatives – impact on Indian exhibitions Strong demand for construction Impact High attraction for FMCG, auto segment Growth in government focused events ++ ++ + ++ Highly positive 5<br>
Reforms 2X allocation for roads and railways
1.5X for power sector Comments Private spend driven by IT and BFSI segment
Strong monsoon driving rural demand Strong reform policies like introduction of GDT, bankruptcy law, liberalization of FDI in railways, aviation, defence and insurance Government initiatives – impact on Indian exhibitions Strong demand for construction Impact High attraction for FMCG, auto segment Growth in government focused events ++ ++ + ++ Highly positive 5<br>
06
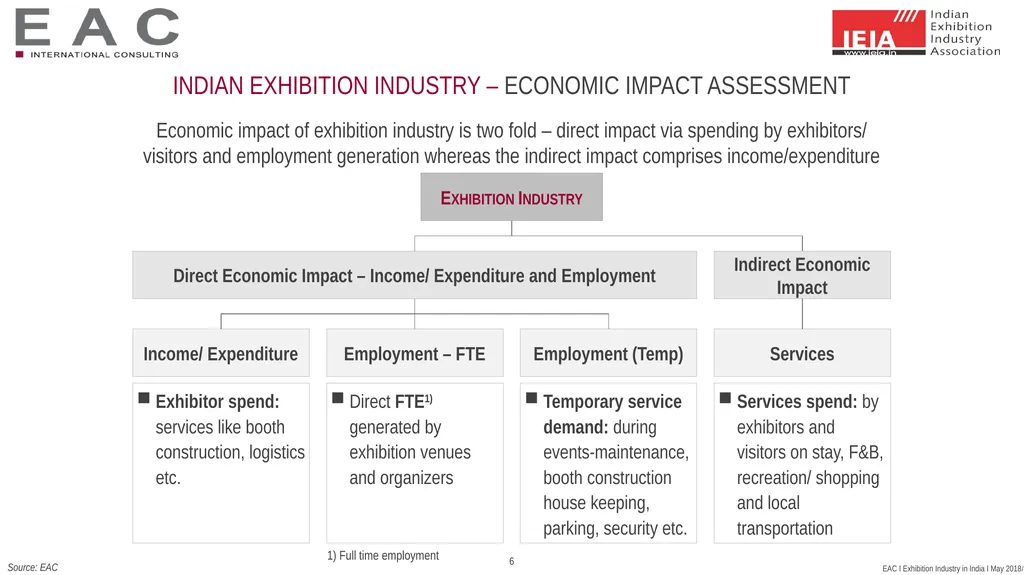
Indian Exhibition industry – economic impact assessment Source: EAC Economic impact of exhibition industry is two fold – direct impact via spending by exhibitors/ visitors and employment generation whereas the indirect impact comprises income/expenditure on related services Exhibition Industry Direct Economic Impact – Income/ Expenditure and Employment Income/ Expenditure Services Exhibitor spend: services like booth construction, logistics etc. Services spend: by exhibitors and visitors on stay, F&B, recreation/ shopping and local transportation Indirect Economic Impact Employment – FTE Employment (Temp) Direct FTE1) generated by exhibition venues and organizers Temporary service demand: during events-maintenance, booth construction house keeping, parking, security etc. 1) Full time employment 6<br>
07
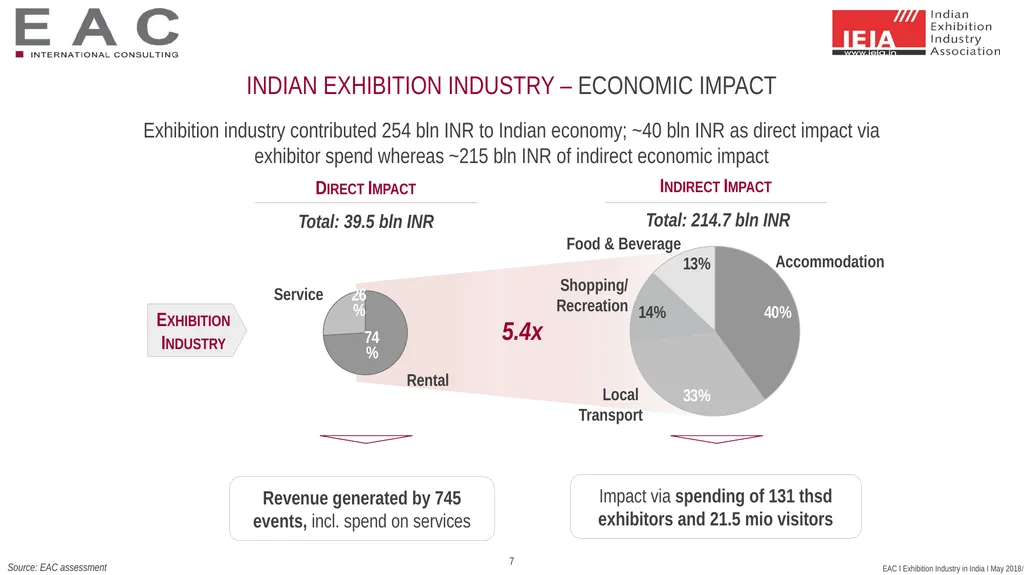
Source: EAC assessment Exhibition industry contributed 254 bln INR to Indian economy; ~40 bln INR as direct impact via exhibitor spend whereas ~215 bln INR of indirect economic impact 5.4x 7 Indian Exhibition industry – economic impact<br>
08
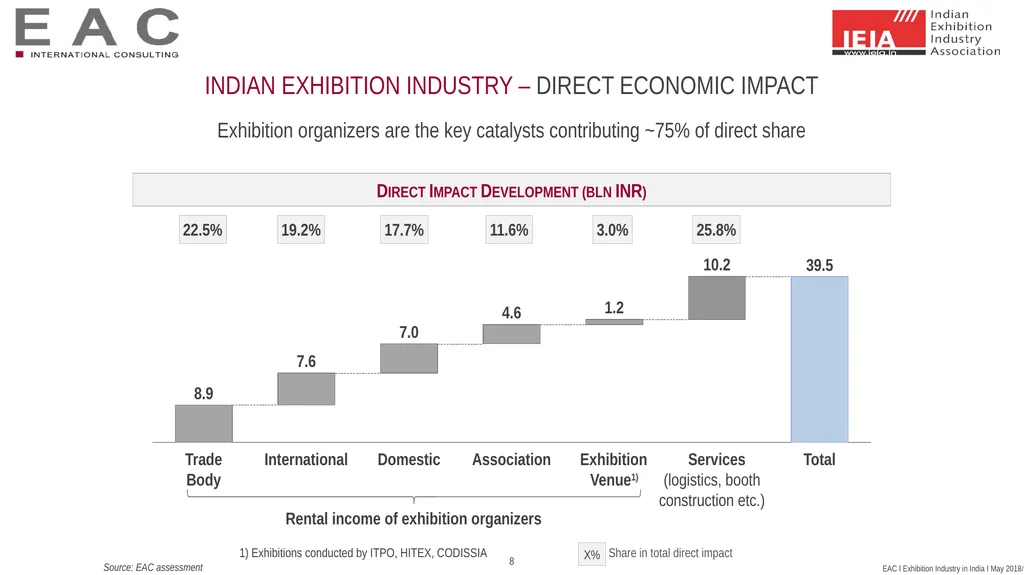
Indian Exhibition industry – direct economic impact Source: EAC assessment Exhibition organizers are the key catalysts contributing ~75% of direct share Direct Impact Development (bln INR) Association Trade
Body International Exhibition
Venue1) Domestic 7.6 Total Services 8.9 7.0 4.6 1.2 10.2 39.5 Rental income of exhibition organizers 1) Exhibitions conducted by ITPO, HITEX, CODISSIA (logistics, booth construction etc.) 25.8% 19.2% 17.7% 11.6% 3.0% 22.5% Share in total direct impact X% 8<br>
Body International Exhibition
Venue1) Domestic 7.6 Total Services 8.9 7.0 4.6 1.2 10.2 39.5 Rental income of exhibition organizers 1) Exhibitions conducted by ITPO, HITEX, CODISSIA (logistics, booth construction etc.) 25.8% 19.2% 17.7% 11.6% 3.0% 22.5% Share in total direct impact X% 8<br>
09
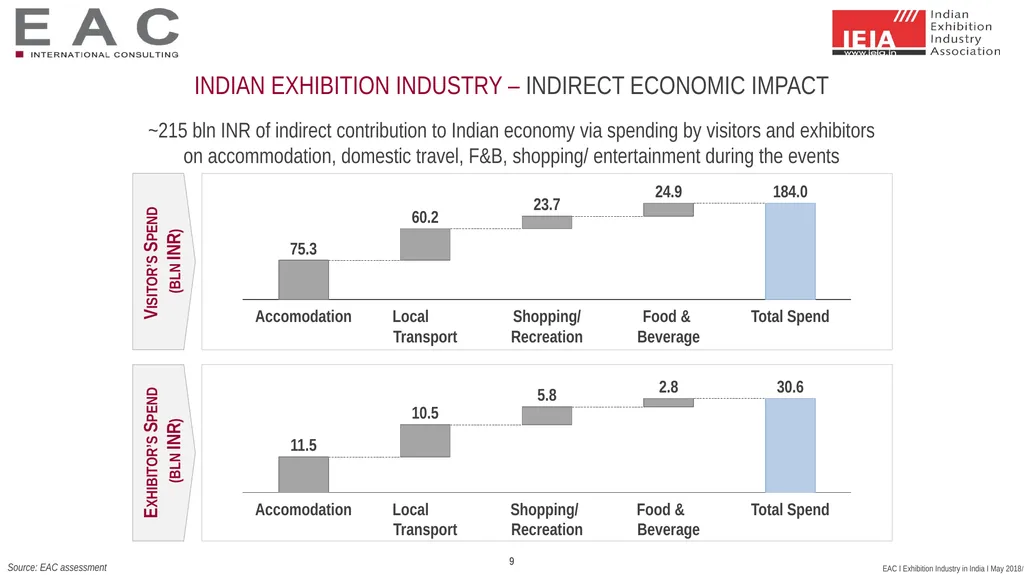
Indian Exhibition industry – indirect economic impact Source: EAC assessment ~215 bln INR of indirect contribution to Indian economy via spending by visitors and exhibitors on accommodation, domestic travel, F&B, shopping/ entertainment during the events 9 Visitor’s Spend
(bln INR) Exhibitor’s Spend
(bln INR) Shopping/
Recreation Local
Transport Accomodation Food &
Beverage Total Spend 75.3 60.2 23.7 24.9 184.0 5.8 Total Spend Accomodation Local
Transport Shopping/
Recreation Food &
Beverage 11.5 10.5 2.8 30.6 9<br>
(bln INR) Exhibitor’s Spend
(bln INR) Shopping/
Recreation Local
Transport Accomodation Food &
Beverage Total Spend 75.3 60.2 23.7 24.9 184.0 5.8 Total Spend Accomodation Local
Transport Shopping/
Recreation Food &
Beverage 11.5 10.5 2.8 30.6 9<br>
10
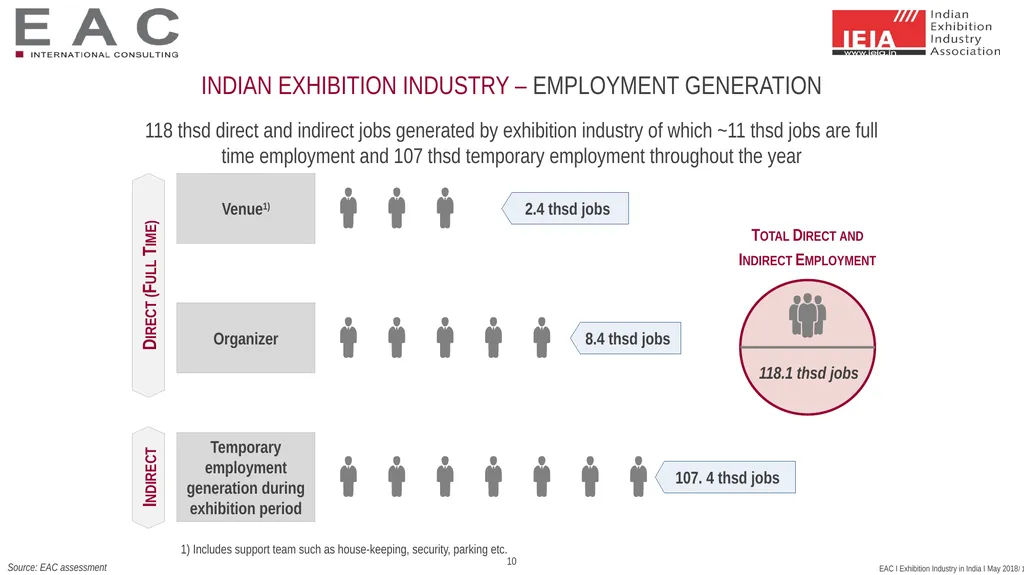
Indian exhibition industry – employment generation Source: EAC assessment 118 thsd direct and indirect jobs generated by exhibition industry of which ~11 thsd jobs are full time employment and 107 thsd temporary employment throughout the year Direct (Full Time) Indirect Venue1) Organizer Temporary employment generation during exhibition period 2.4 thsd jobs 8.4 thsd jobs 107. 4 thsd jobs 1) Includes support team such as house-keeping, security, parking etc. Total Direct and Indirect Employment 10<br>
11
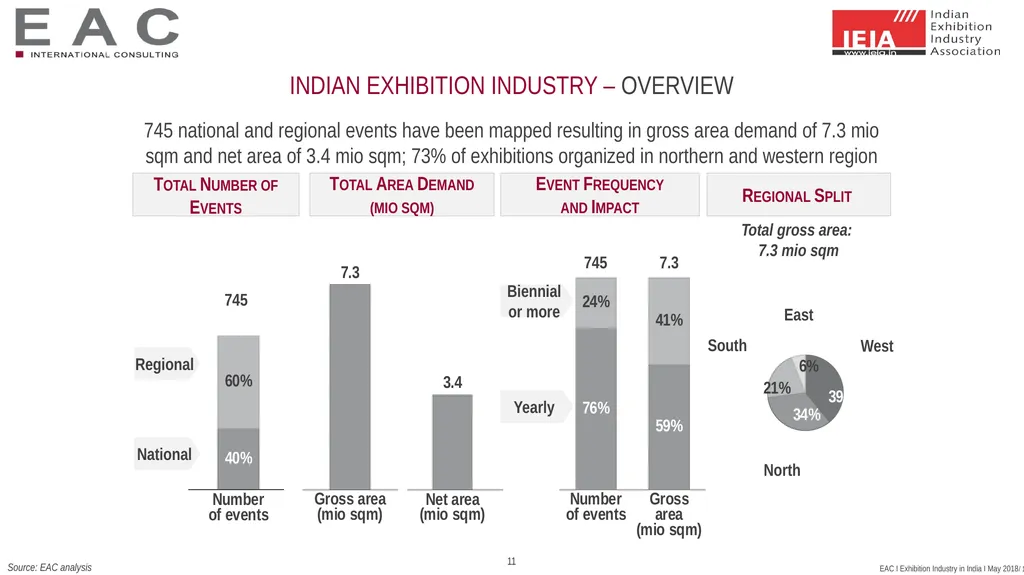
Indian exhibition industry – overview Source: EAC analysis 745 national and regional events have been mapped resulting in gross area demand of 7.3 mio sqm and net area of 3.4 mio sqm; 73% of exhibitions organized in northern and western region 11<br>
12
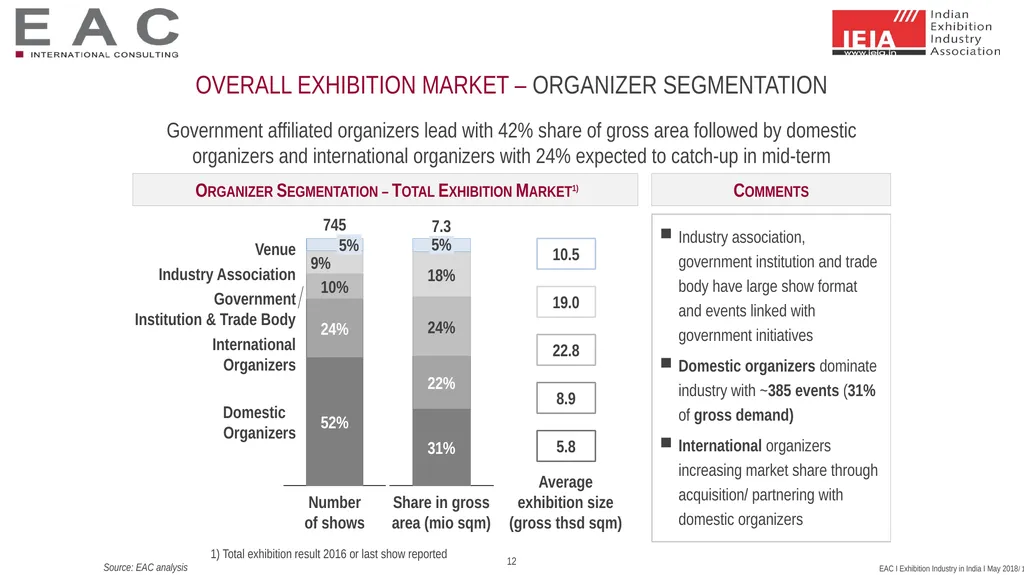
Overall Exhibition market – organizer segmentation Source: EAC analysis Government affiliated organizers lead with 42% share of gross area followed by domestic organizers and international organizers with 24% expected to catch-up in mid-term Organizer Segmentation – Total Exhibition Market1) Industry association, government institution and trade body have large show format and events linked with government initiatives
Domestic organizers dominate industry with ~385 events (31% of gross demand)
International organizers increasing market share through acquisition/ partnering with domestic organizers Comments 7.3 5% 18% 22% 24% 31% Share in gross area (mio sqm) Venue 10% 5% 9% 24% 52% Number of shows Industry Association Government
Institution & Trade Body International
Organizers Domestic
Organizers 745 10.5 19.0 22.8 8.9 5.8 1) Total exhibition result 2016 or last show reported Average exhibition size (gross thsd sqm) 12<br>
Domestic organizers dominate industry with ~385 events (31% of gross demand)
International organizers increasing market share through acquisition/ partnering with domestic organizers Comments 7.3 5% 18% 22% 24% 31% Share in gross area (mio sqm) Venue 10% 5% 9% 24% 52% Number of shows Industry Association Government
Institution & Trade Body International
Organizers Domestic
Organizers 745 10.5 19.0 22.8 8.9 5.8 1) Total exhibition result 2016 or last show reported Average exhibition size (gross thsd sqm) 12<br>
13
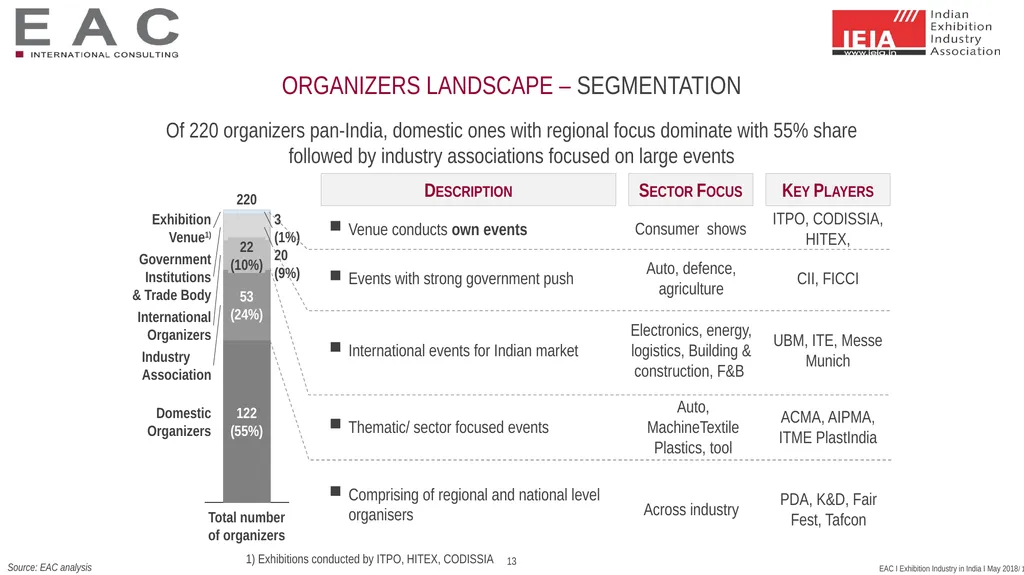
Organizers Landscape – segmentation Source: EAC analysis Of 220 organizers pan-India, domestic ones with regional focus dominate with 55% share followed by industry associations focused on large events ITPO, CODISSIA, HITEX, Key Players Consumer shows Sector Focus Venue conducts own events Description 20
(9%) 3
(1%) 122
(55%) Domestic
Organizers 22
(10%) 53
(24%) Total number of organizers Exhibition
Venue1) Government Institutions & Trade Body International
Organizers Industry
Association 220 CII, FICCI Auto, defence, agriculture Events with strong government push PDA, K&D, Fair Fest, Tafcon Across industry Comprising of regional and national level organisers ACMA, AIPMA, ITME PlastIndia Auto, MachineTextile Plastics, tool Thematic/ sector focused events UBM, ITE, Messe Munich Electronics, energy, logistics, Building & construction, F&B International events for Indian market 1) Exhibitions conducted by ITPO, HITEX, CODISSIA 13<br>
Venue1) Government Institutions & Trade Body International
Organizers Industry
Association 220 CII, FICCI Auto, defence, agriculture Events with strong government push PDA, K&D, Fair Fest, Tafcon Across industry Comprising of regional and national level organisers ACMA, AIPMA, ITME PlastIndia Auto, MachineTextile Plastics, tool Thematic/ sector focused events UBM, ITE, Messe Munich Electronics, energy, logistics, Building & construction, F&B International events for Indian market 1) Exhibitions conducted by ITPO, HITEX, CODISSIA 13<br>
14
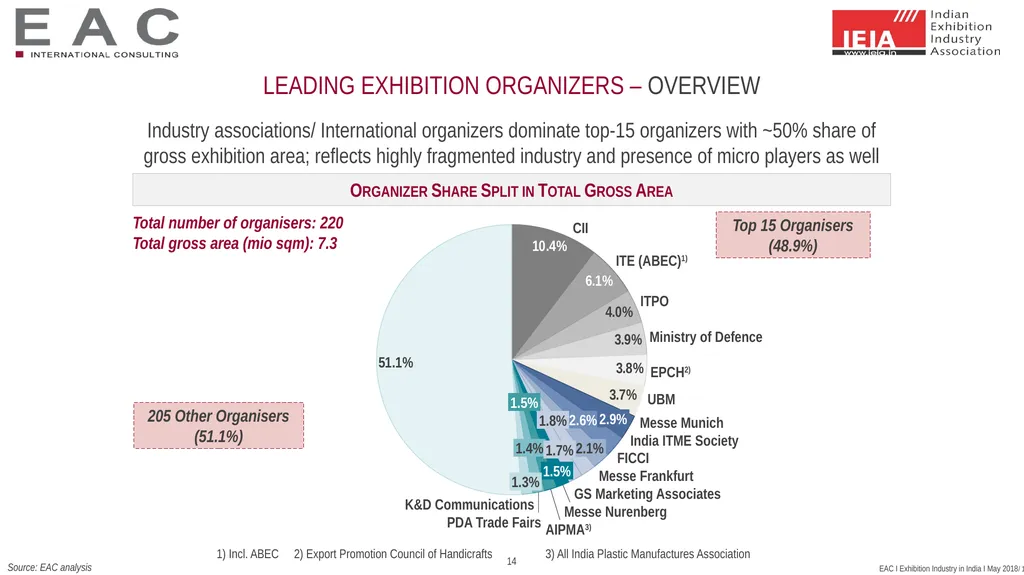
Source: EAC analysis Industry associations/ International organizers dominate top-15 organizers with ~50% share of gross exhibition area; reflects highly fragmented industry and presence of micro players as well Organizer Share Split in Total Gross Area 205 Other Organisers
(51.1%) Total number of organisers: 220
Total gross area (mio sqm): 7.3 CII 2.6% Messe Munich UBM ITE (ABEC)1) 2.9% ITPO Ministry of Defence EPCH2) 1.4% India ITME Society K&D Communications 2.1% FICCI 1.8% Messe Frankfurt 1.5% 1.7% GS Marketing Associates 1.5% Messe Nurenberg AIPMA3) PDA Trade Fairs 1.3% Top 15 Organisers (48.9%) 1) Incl. ABEC 2) Export Promotion Council of Handicrafts 3) All India Plastic Manufactures Association 14 Leading exhibition organizers – Overview<br>
Total gross area (mio sqm): 7.3 CII 2.6% Messe Munich UBM ITE (ABEC)1) 2.9% ITPO Ministry of Defence EPCH2) 1.4% India ITME Society K&D Communications 2.1% FICCI 1.8% Messe Frankfurt 1.5% 1.7% GS Marketing Associates 1.5% Messe Nurenberg AIPMA3) PDA Trade Fairs 1.3% Top 15 Organisers (48.9%) 1) Incl. ABEC 2) Export Promotion Council of Handicrafts 3) All India Plastic Manufactures Association 14 Leading exhibition organizers – Overview<br>
15
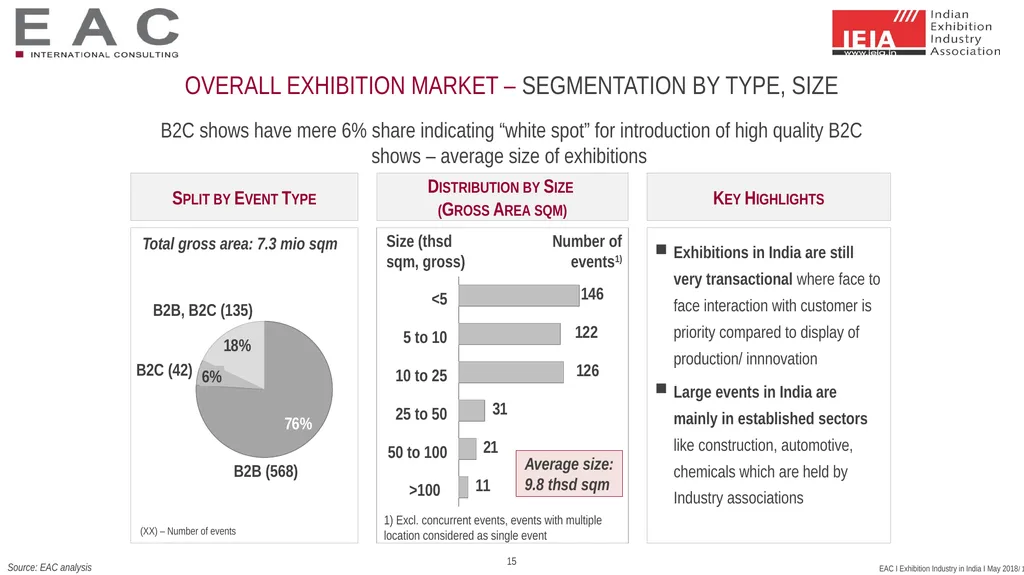
Overall exhibition Market – segmentation by type, size Source: EAC analysis B2C shows have mere 6% share indicating “white spot” for introduction of high quality B2C shows – average size of exhibitions Split by Event Type Total gross area: 7.3 mio sqm B2B (568) 6% B2B, B2C (135) B2C (42) Distribution by Size
(Gross Area sqm) 1) Excl. concurrent events, events with multiple location considered as single event Size (thsd sqm, gross) Number of events1) Key Highlights Exhibitions in India are still very transactional where face to face interaction with customer is priority compared to display of production/ innnovation
Large events in India are mainly in established sectors like construction, automotive, chemicals which are held by Industry associations (XX) – Number of events <5 5 to 10 10 to 25 50 to 100 25 to 50 >100 15 Average size: 9.8 thsd sqm<br>
(Gross Area sqm) 1) Excl. concurrent events, events with multiple location considered as single event Size (thsd sqm, gross) Number of events1) Key Highlights Exhibitions in India are still very transactional where face to face interaction with customer is priority compared to display of production/ innnovation
Large events in India are mainly in established sectors like construction, automotive, chemicals which are held by Industry associations (XX) – Number of events <5 5 to 10 10 to 25 50 to 100 25 to 50 >100 15 Average size: 9.8 thsd sqm<br>
16
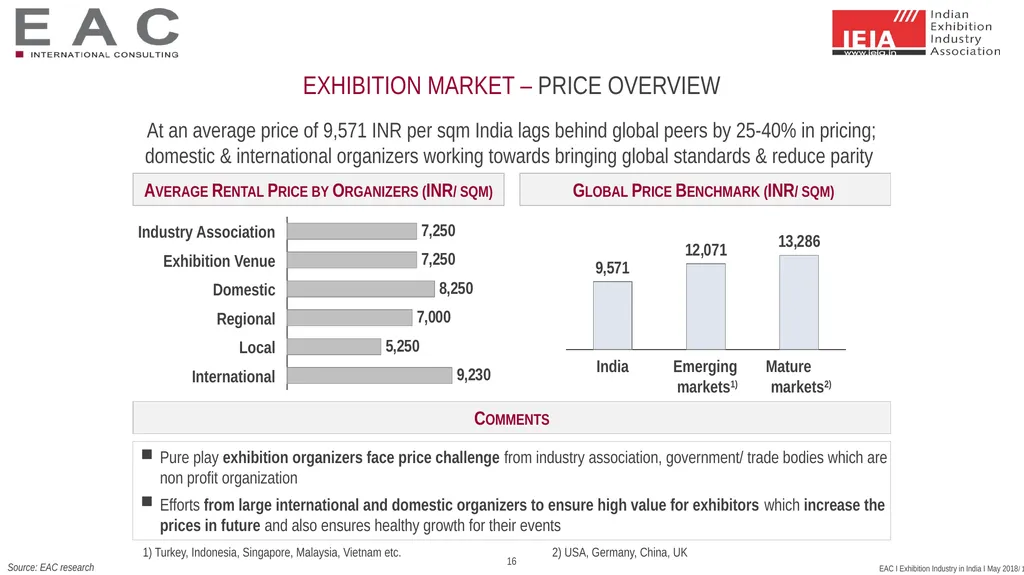
16 Exhibition Market – Price Overview Source: EAC research At an average price of 9,571 INR per sqm India lags behind global peers by 25-40% in pricing; domestic & international organizers working towards bringing global standards & reduce parity Average Rental Price by Organizers (INR/ sqm) Global Price Benchmark (INR/ sqm) Pure play exhibition organizers face price challenge from industry association, government/ trade bodies which are non profit organization
Efforts from large international and domestic organizers to ensure high value for exhibitors which increase the prices in future and also ensures healthy growth for their events Comments India Mature
markets2) Emerging
markets1) 1) Turkey, Indonesia, Singapore, Malaysia, Vietnam etc. 2) USA, Germany, China, UK Exhibition Venue Local Regional Industry Association Domestic International<br>
Efforts from large international and domestic organizers to ensure high value for exhibitors which increase the prices in future and also ensures healthy growth for their events Comments India Mature
markets2) Emerging
markets1) 1) Turkey, Indonesia, Singapore, Malaysia, Vietnam etc. 2) USA, Germany, China, UK Exhibition Venue Local Regional Industry Association Domestic International<br>
17
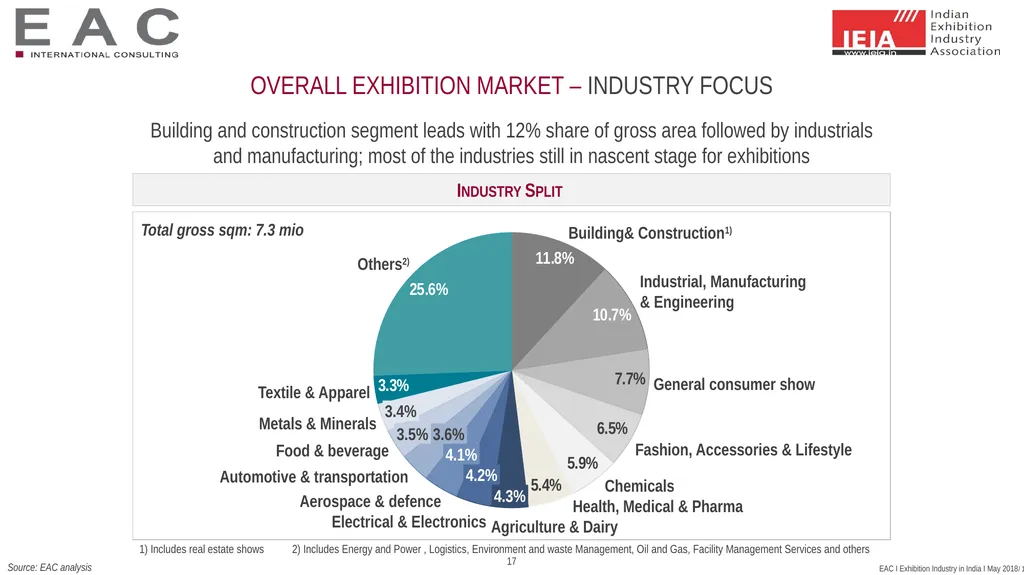
Overall exhibition Market – Industry Focus Source: EAC analysis Building and construction segment leads with 12% share of gross area followed by industrials and manufacturing; most of the industries still in nascent stage for exhibitions Industry Split 1) Includes real estate shows Total gross sqm: 7.3 mio Chemicals Building& Construction1) Fashion, Accessories & Lifestyle Industrial, Manufacturing
& Engineering 4.2% Others2) Health, Medical & Pharma 3.6% General consumer show 4.3% Agriculture & Dairy Electrical & Electronics 4.1% 3.4% Aerospace & defence Automotive & transportation 3.5% Food & beverage Metals & Minerals Textile & Apparel 2) Includes Energy and Power , Logistics, Environment and waste Management, Oil and Gas, Facility Management Services and others 17<br>
& Engineering 4.2% Others2) Health, Medical & Pharma 3.6% General consumer show 4.3% Agriculture & Dairy Electrical & Electronics 4.1% 3.4% Aerospace & defence Automotive & transportation 3.5% Food & beverage Metals & Minerals Textile & Apparel 2) Includes Energy and Power , Logistics, Environment and waste Management, Oil and Gas, Facility Management Services and others 17<br>
18
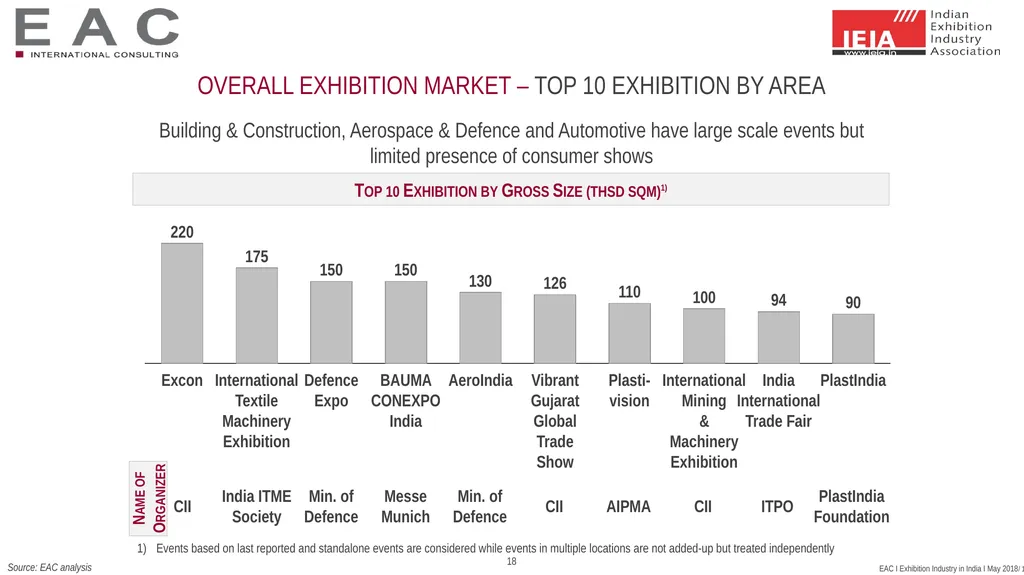
Overall exhibition Market – Top 10 Exhibition by area Source: EAC analysis Building & Construction, Aerospace & Defence and Automotive have large scale events but limited presence of consumer shows Plasti-
vision Excon AeroIndia International Textile
Machinery Exhibition BAUMA CONEXPO India Defence Expo Vibrant Gujarat Global Trade Show International Mining
&
Machinery Exhibition India International Trade Fair 94 PlastIndia 220 175 110 150 150 130 126 100 90 Top 10 Exhibition by Gross Size (thsd sqm)1) Events based on last reported and standalone events are considered while events in multiple locations are not added-up but treated independently 18 CII India ITME Society Min. of Defence Messe Munich Min. of Defence CII AIPMA CII ITPO PlastIndia Foundation Name of Organizer<br>
vision Excon AeroIndia International Textile
Machinery Exhibition BAUMA CONEXPO India Defence Expo Vibrant Gujarat Global Trade Show International Mining
&
Machinery Exhibition India International Trade Fair 94 PlastIndia 220 175 110 150 150 130 126 100 90 Top 10 Exhibition by Gross Size (thsd sqm)1) Events based on last reported and standalone events are considered while events in multiple locations are not added-up but treated independently 18 CII India ITME Society Min. of Defence Messe Munich Min. of Defence CII AIPMA CII ITPO PlastIndia Foundation Name of Organizer<br>
19
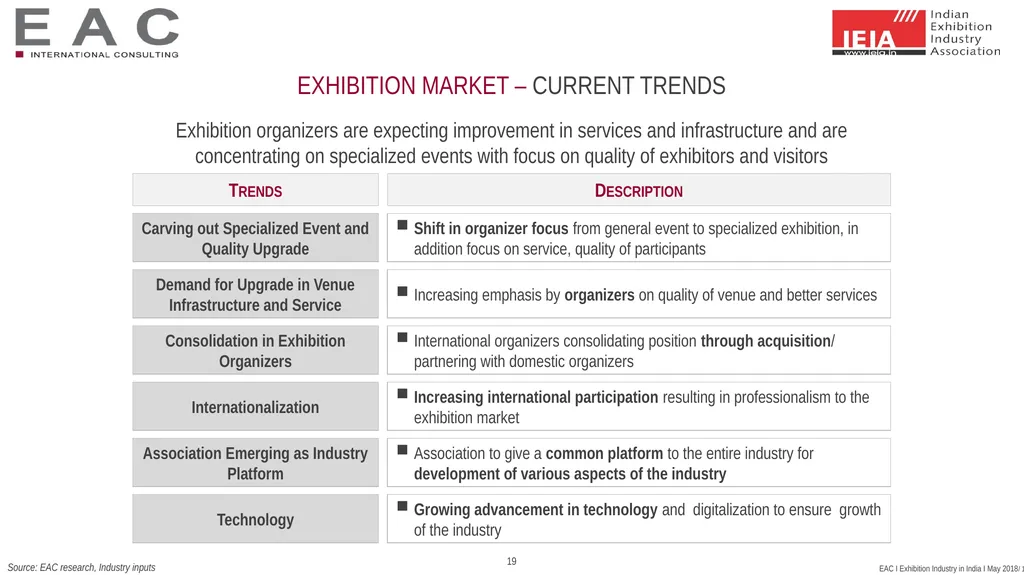
exhibition market – current trends Source: EAC research, Industry inputs Exhibition organizers are expecting improvement in services and infrastructure and are concentrating on specialized events with focus on quality of exhibitors and visitors Trends Carving out Specialized Event and Quality Upgrade Demand for Upgrade in Venue Infrastructure and Service Consolidation in Exhibition Organizers Description Shift in organizer focus from general event to specialized exhibition, in addition focus on service, quality of participants Increasing emphasis by organizers on quality of venue and better services International organizers consolidating position through acquisition/ partnering with domestic organizers Association Emerging as Industry Platform Association to give a common platform to the entire industry for development of various aspects of the industry Technology Internationalization Growing advancement in technology and digitalization to ensure growth of the industry Increasing international participation resulting in professionalism to the exhibition market 19<br>
20
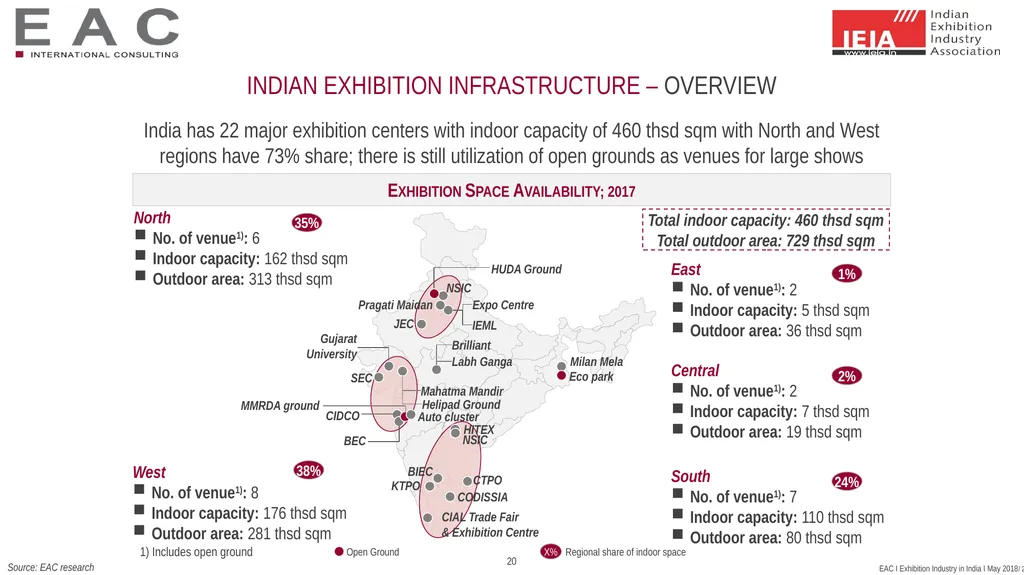
Indian Exhibition Infrastructure – overview Source: EAC research India has 22 major exhibition centers with indoor capacity of 460 thsd sqm with North and West regions have 73% share; there is still utilization of open grounds as venues for large shows Total indoor capacity: 460 thsd sqm
Total outdoor area: 729 thsd sqm Exhibition Space Availability; 2017 Open Ground X% Regional share of indoor space Expo Centre IEML JEC SEC BEC NSIC Pragati Maidan Milan Mela Eco park Helipad Ground HUDA Ground MMRDA ground CIDCO Gujarat University Mahatma Mandir HITEX CTPO CODISSIA BIEC KTPO NSIC North
No. of venue1): 6
Indoor capacity: 162 thsd sqm
Outdoor area: 313 thsd sqm 35% Central
No. of venue1): 2
Indoor capacity: 7 thsd sqm
Outdoor area: 19 thsd sqm 2% West
No. of venue1): 8
Indoor capacity: 176 thsd sqm
Outdoor area: 281 thsd sqm 38% South
No. of venue1): 7
Indoor capacity: 110 thsd sqm
Outdoor area: 80 thsd sqm 24% 1) Includes open ground Brilliant Labh Ganga Auto cluster East
No. of venue1): 2
Indoor capacity: 5 thsd sqm
Outdoor area: 36 thsd sqm 1% CIAL Trade Fair
& Exhibition Centre 20<br>
Total outdoor area: 729 thsd sqm Exhibition Space Availability; 2017 Open Ground X% Regional share of indoor space Expo Centre IEML JEC SEC BEC NSIC Pragati Maidan Milan Mela Eco park Helipad Ground HUDA Ground MMRDA ground CIDCO Gujarat University Mahatma Mandir HITEX CTPO CODISSIA BIEC KTPO NSIC North
No. of venue1): 6
Indoor capacity: 162 thsd sqm
Outdoor area: 313 thsd sqm 35% Central
No. of venue1): 2
Indoor capacity: 7 thsd sqm
Outdoor area: 19 thsd sqm 2% West
No. of venue1): 8
Indoor capacity: 176 thsd sqm
Outdoor area: 281 thsd sqm 38% South
No. of venue1): 7
Indoor capacity: 110 thsd sqm
Outdoor area: 80 thsd sqm 24% 1) Includes open ground Brilliant Labh Ganga Auto cluster East
No. of venue1): 2
Indoor capacity: 5 thsd sqm
Outdoor area: 36 thsd sqm 1% CIAL Trade Fair
& Exhibition Centre 20<br>
21
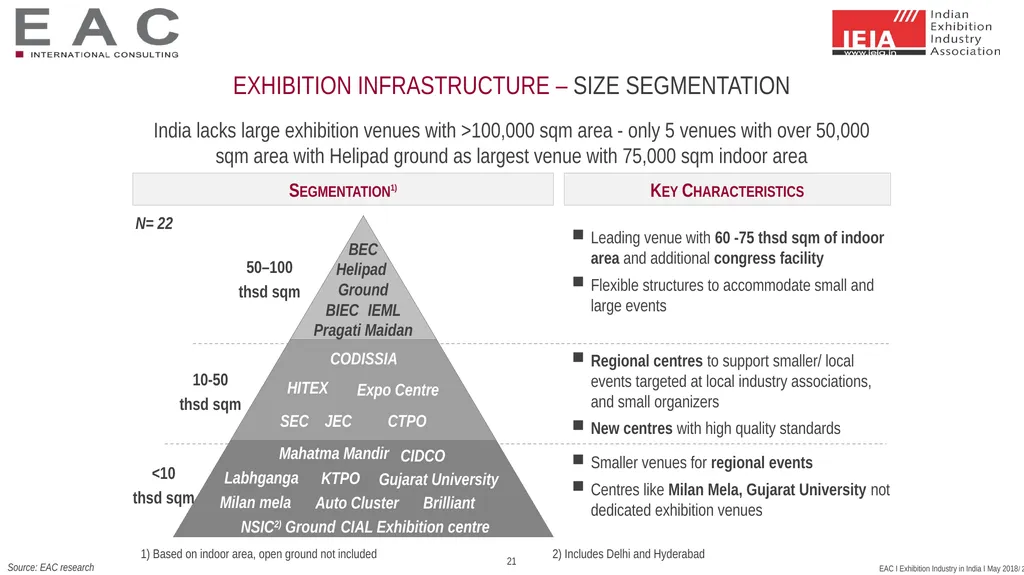
Exhibition Infrastructure – size segmentation Source: EAC research India lacks large exhibition venues with >100,000 sqm area - only 5 venues with over 50,000 sqm area with Helipad ground as largest venue with 75,000 sqm indoor area Segmentation1) Key Characteristics Leading venue with 60 -75 thsd sqm of indoor area and additional congress facility
Flexible structures to accommodate small and large events N= 22 Regional centres to support smaller/ local events targeted at local industry associations, and small organizers
New centres with high quality standards Smaller venues for regional events
Centres like Milan Mela, Gujarat University not dedicated exhibition venues <10 thsd sqm 10-50 thsd sqm 50–100 thsd sqm BEC Pragati Maidan Helipad
Ground BIEC IEML CODISSIA CTPO SEC HITEX Expo Centre JEC CIAL Exhibition centre 2) Includes Delhi and Hyderabad 1) Based on indoor area, open ground not included Mahatma Mandir Gujarat University Milan mela NSIC2) Ground KTPO CIDCO Labhganga Auto Cluster Brilliant 21<br>
Flexible structures to accommodate small and large events N= 22 Regional centres to support smaller/ local events targeted at local industry associations, and small organizers
New centres with high quality standards Smaller venues for regional events
Centres like Milan Mela, Gujarat University not dedicated exhibition venues <10 thsd sqm 10-50 thsd sqm 50–100 thsd sqm BEC Pragati Maidan Helipad
Ground BIEC IEML CODISSIA CTPO SEC HITEX Expo Centre JEC CIAL Exhibition centre 2) Includes Delhi and Hyderabad 1) Based on indoor area, open ground not included Mahatma Mandir Gujarat University Milan mela NSIC2) Ground KTPO CIDCO Labhganga Auto Cluster Brilliant 21<br>
22
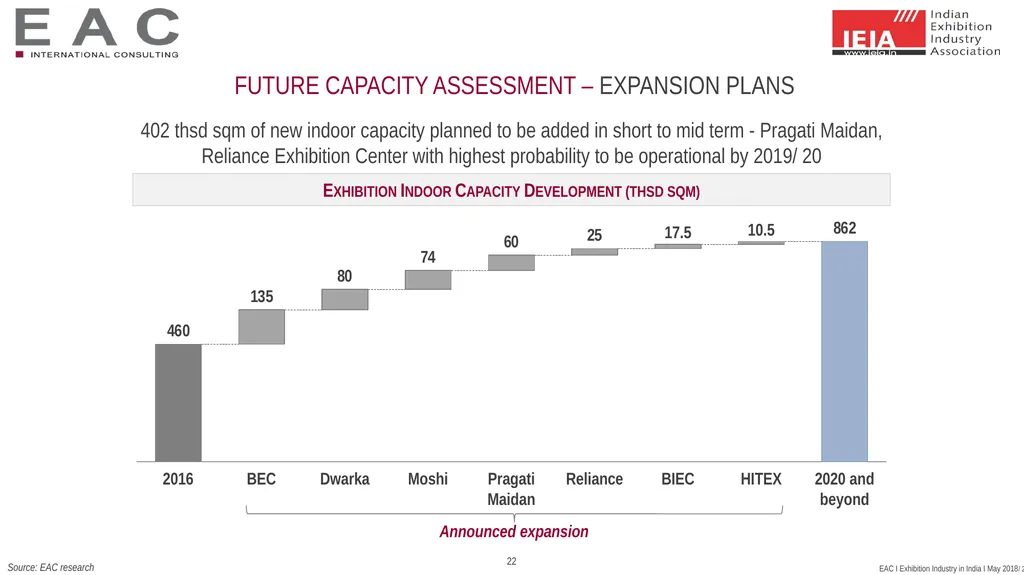
Source: EAC research 402 thsd sqm of new indoor capacity planned to be added in short to mid term - Pragati Maidan, Reliance Exhibition Center with highest probability to be operational by 2019/ 20 Exhibition Indoor Capacity Development (thsd sqm) Future Capacity Assessment – expansion Plans Dwarka BEC 2016 HITEX Moshi Pragati Maidan BIEC Reliance 2020 and beyond 17.5 10.5 Announced expansion 22<br>
23
Source: EAC research Pragati Maidan, BIEC and HITEX exhibition centers have expansion plans to increase their existing indoor capacity by 2020, Pragati Maidan revamp has started Expansion plans – Existing Venues Backup 23<br>
24
Source: EAC research Dwarka, Reliance and Moshi exhibition centers are new upcoming venues to come up by 2020 whereas Moshi has low probability to come up by 2020 due to land clearance issues Expansion plans – new Venues 1) Mahratta Chamber Of Commerce Industries & Agriculture Backup 24<br>
25
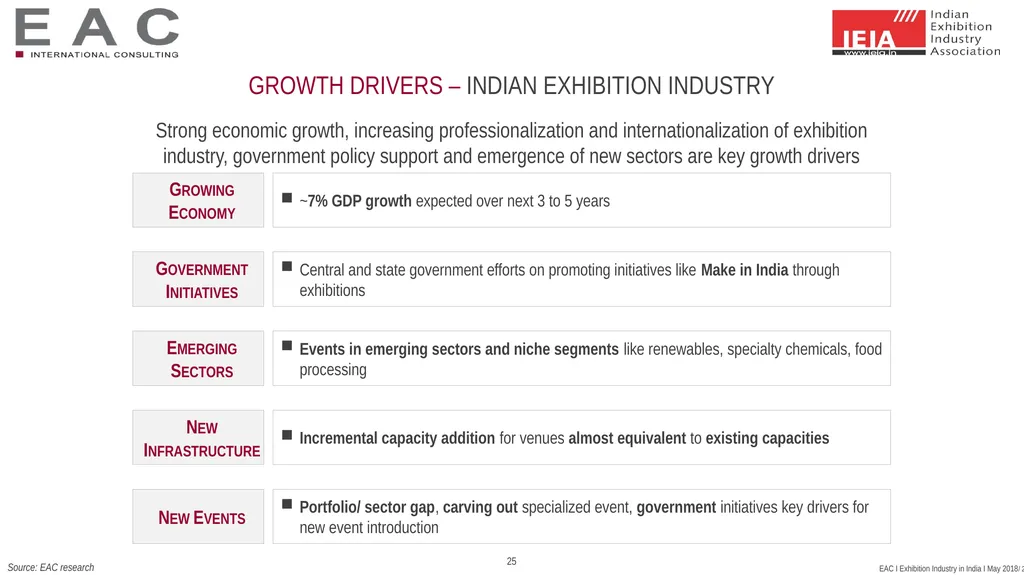
Growth drivers – indian exhibition industry Source: EAC research Strong economic growth, increasing professionalization and internationalization of exhibition industry, government policy support and emergence of new sectors are key growth drivers ~7% GDP growth expected over next 3 to 5 years Growing Economy Events in emerging sectors and niche segments like renewables, specialty chemicals, food processing Emerging Sectors Portfolio/ sector gap, carving out specialized event, government initiatives key drivers for new event introduction New Events Central and state government efforts on promoting initiatives like Make in India through exhibitions Government Initiatives Incremental capacity addition for venues almost equivalent to existing capacities New
Infrastructure 25<br>
Infrastructure 25<br>
26
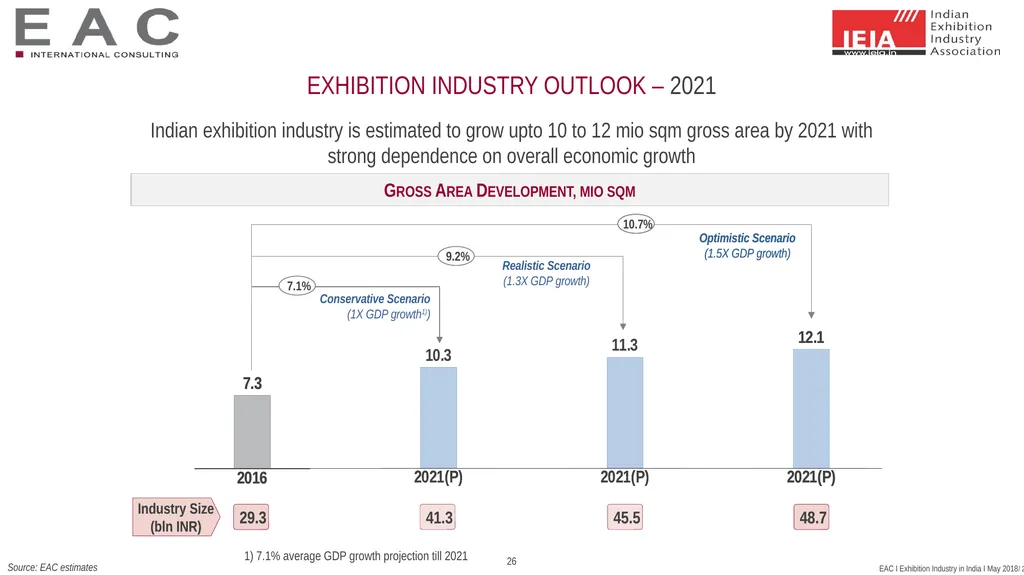
Exhibition industry outlook – 2021 Source: EAC estimates Indian exhibition industry is estimated to grow upto 10 to 12 mio sqm gross area by 2021 with strong dependence on overall economic growth Gross Area Development, mio sqm 1) 7.1% average GDP growth projection till 2021 26<br>
27
27<br>