
Spatial Analysis & Modeling GIS for Spatial
LO
Published · 27 slides · 0 views
1 / 1

Description
Spatial Analysis Modeling GIS for Spatial Planning Training for Ministry of Transport Mozambique Maputo, Mozambique 2-13 July 2018 Geoinformation and Sectoral Statistics Section Spatial Analysis and Modeling Concepts Surface Models
Related Topics
Share
Embed code
Download this presentation From Below
"Spatial Analysis & Modeling GIS for Spatial" is the property of its rightful owner. Permission is granted to download and print the materials on this website for personal, non-commercial use only, and to display it on your personal computer provided you do not modify the materials and that you retain all copyright notices contained in the materials. By downloading content from our website, you accept the terms of this agreement.
Presentation Transcript
01
Spatial Analysis & Modeling GIS for Spatial Planning
Training for Ministry of Transport
Mozambique
Maputo, Mozambique
2-13 July 2018 Geoinformation and Sectoral Statistics Section<br>
Training for Ministry of Transport
Mozambique
Maputo, Mozambique
2-13 July 2018 Geoinformation and Sectoral Statistics Section<br>
02
Spatial Analysis and Modeling Concepts
Surface Models
Surface Modeling Operations 2 Content<br>
Surface Models
Surface Modeling Operations 2 Content<br>
03
Spatial analysis is the technique to analyze data in terms of location
Find out patterns, identify relationships among features, plan efficient routes, perform site selection, model or predict values based on discrete sample observations, etc.
Relationships: proximity, overlap, intersection, visibility, accessibility, etc.
Detect patterns: hotspots, outliers, clusters, change over time Spatial Analysis & Modeling Concepts<br>
Find out patterns, identify relationships among features, plan efficient routes, perform site selection, model or predict values based on discrete sample observations, etc.
Relationships: proximity, overlap, intersection, visibility, accessibility, etc.
Detect patterns: hotspots, outliers, clusters, change over time Spatial Analysis & Modeling Concepts<br>
04
Predict values: given a set of measured points across an area you can determine the estimated values in unmeasured locations
Using spatial analysis, you can combine information from many independent sources and derive a new set of information by applying a large, rich, and sophisticated set of spatial operators or geo-processing tools 4 Spatial Analysis & Modeling Concepts<br>
Using spatial analysis, you can combine information from many independent sources and derive a new set of information by applying a large, rich, and sophisticated set of spatial operators or geo-processing tools 4 Spatial Analysis & Modeling Concepts<br>
05
Why Spatial modeling: finding relationships among geographic features to understand and address any particular problem
Spatial modeling allows you to derive new data from values of existing data layers and to predict what might happen and where
Modeling often involve developing specialized workflows through programming, creating scripts and automated workflows, lets you efficiently query and process large amounts of data and implement more complex algorithms. Spatial Analysis & Modeling Concepts<br>
Spatial modeling allows you to derive new data from values of existing data layers and to predict what might happen and where
Modeling often involve developing specialized workflows through programming, creating scripts and automated workflows, lets you efficiently query and process large amounts of data and implement more complex algorithms. Spatial Analysis & Modeling Concepts<br>
06
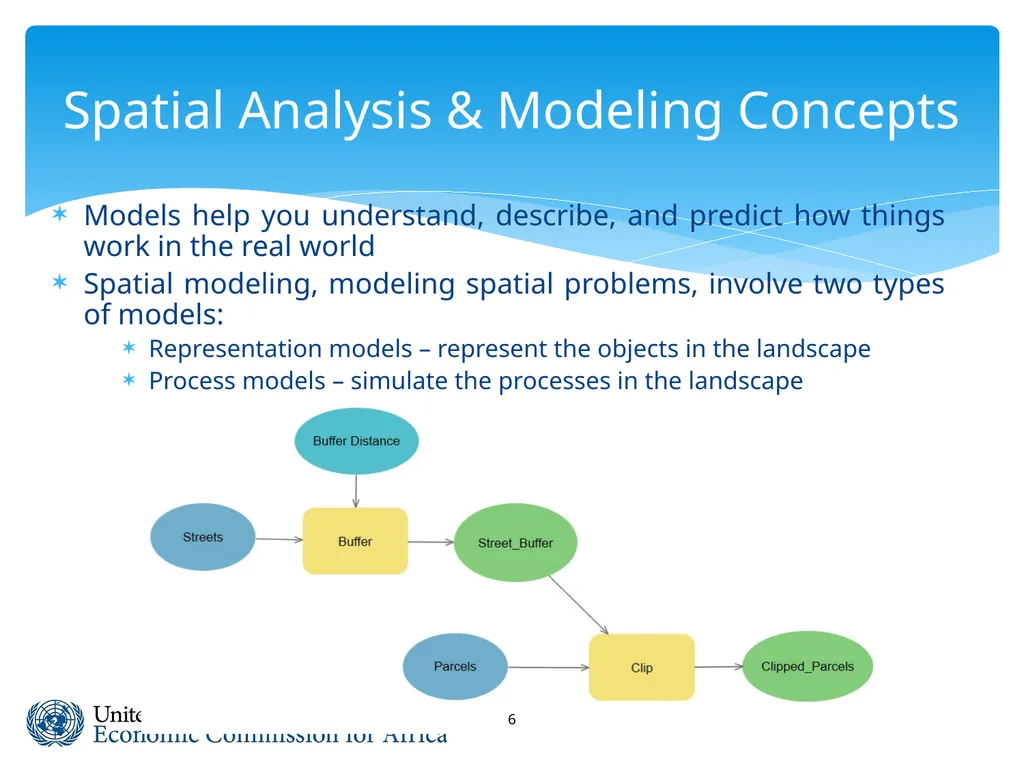
6 Models help you understand, describe, and predict how things work in the real world
Spatial modeling, modeling spatial problems, involve two types of models:
Representation models – represent the objects in the landscape
Process models – simulate the processes in the landscape Spatial Analysis & Modeling Concepts<br>
Spatial modeling, modeling spatial problems, involve two types of models:
Representation models – represent the objects in the landscape
Process models – simulate the processes in the landscape Spatial Analysis & Modeling Concepts<br>
07
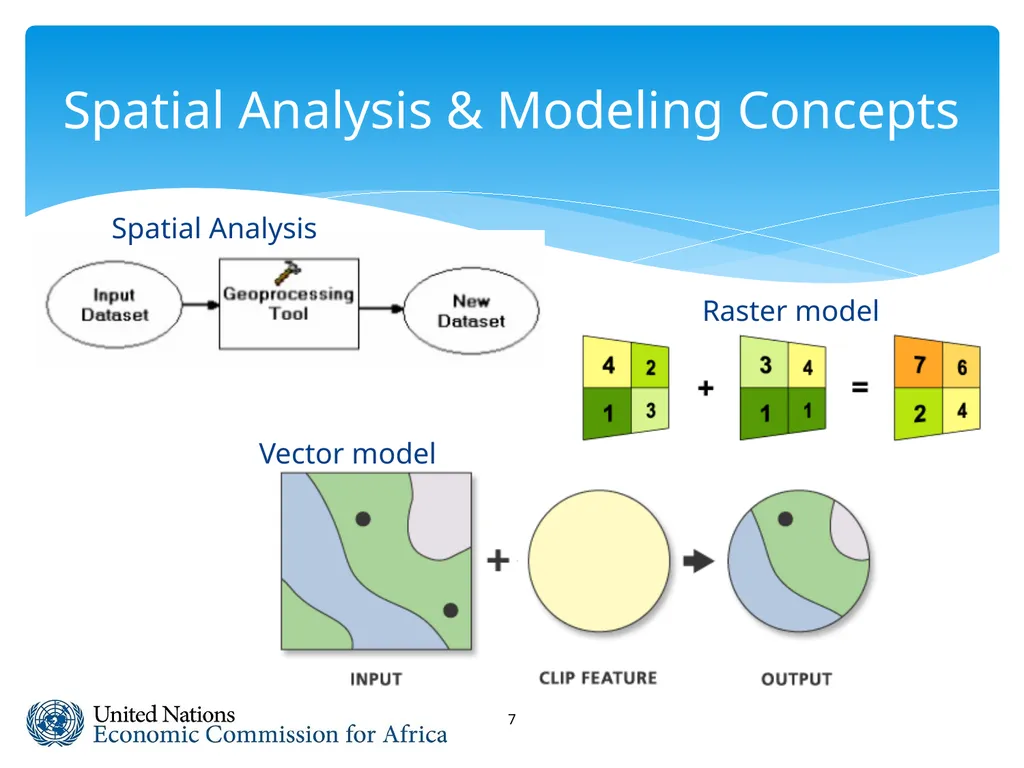
7 Vector model Raster model Spatial Analysis & Modeling Concepts Spatial Analysis<br>
08
Using an elevation surface, for example, you can derive information and identify features that were not readily apparent in the original surface,
contours, angle of slope, steepest downslope direction (aspect), shaded relief (hillshade), and visible areas (viewsheds)
model the flow of water across Earth’s surface, deriving runoff characteristics, understanding drainage systems, and creating watersheds Spatial Analysis & Modeling Concepts<br>
contours, angle of slope, steepest downslope direction (aspect), shaded relief (hillshade), and visible areas (viewsheds)
model the flow of water across Earth’s surface, deriving runoff characteristics, understanding drainage systems, and creating watersheds Spatial Analysis & Modeling Concepts<br>
09
Surface Models: DSM, DEM, DTM
Digital Surface Model (DSM) surface model which captures the natural and built features on the Earth’s surface
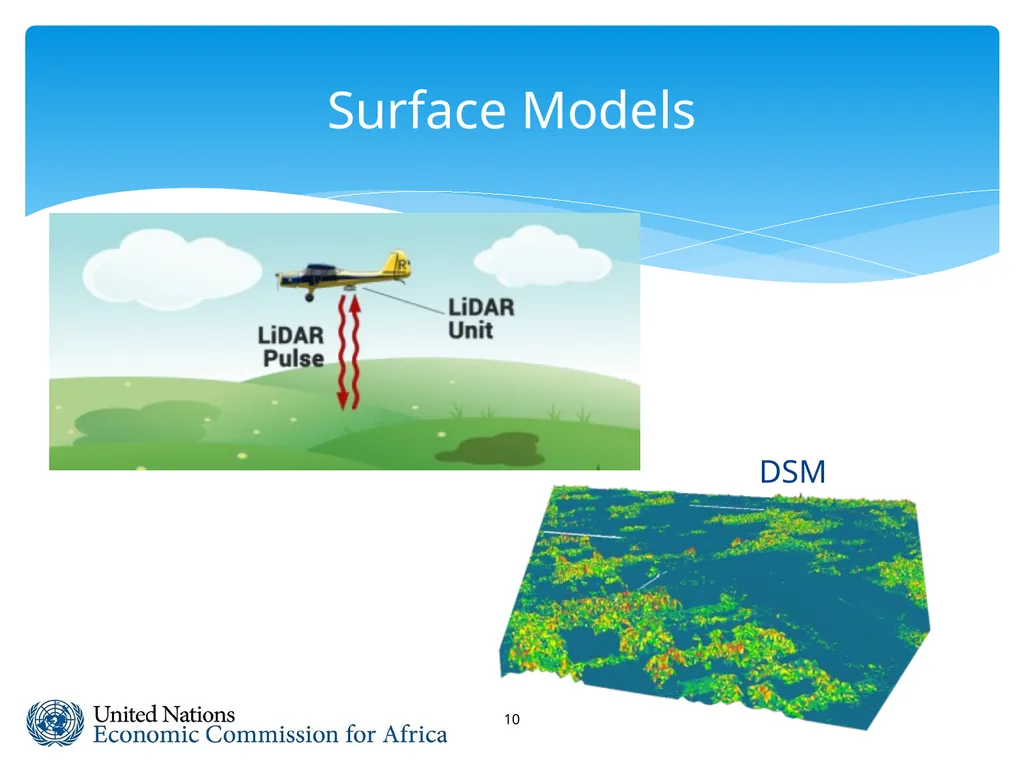
DSM is generated using LiDAR system, which sends pulses of light to the ground and when the pulse of light bounces off/back its target and returns to the sensor, it gives the range (a variable distance) to the Earth
LiDAR delivers a massive point cloud filled of varying elevation values (Height can come from the top of buildings, tree canopy, power lines, other built and natural features)
DSM is useful in 3D modeling for telecommunications, urban planning and aviation (objects extrude from the earth, particularly useful in these application to identify obstructions) Surface Models<br>
Digital Surface Model (DSM) surface model which captures the natural and built features on the Earth’s surface
DSM is generated using LiDAR system, which sends pulses of light to the ground and when the pulse of light bounces off/back its target and returns to the sensor, it gives the range (a variable distance) to the Earth
LiDAR delivers a massive point cloud filled of varying elevation values (Height can come from the top of buildings, tree canopy, power lines, other built and natural features)
DSM is useful in 3D modeling for telecommunications, urban planning and aviation (objects extrude from the earth, particularly useful in these application to identify obstructions) Surface Models<br>
10
10 Surface Models DSM<br>
11
Digital Elevation Model (DEM) is a digital model or 3D representation of a terrain’s surface, created from DEM is bare-earth raster grid, which filters out vegetation and man made features terrain elevation data
DEM is bare-earth raster grid, which filters out vegetation and man made features
non-ground points such as bridges and roads, built (power lines, buildings and towers), and natural (trees and other vegetation types) are not included in DEM
Digital Elevation Model (DEM) is frequently used and simplest form of digital representation of topography Surface Models<br>
DEM is bare-earth raster grid, which filters out vegetation and man made features
non-ground points such as bridges and roads, built (power lines, buildings and towers), and natural (trees and other vegetation types) are not included in DEM
Digital Elevation Model (DEM) is frequently used and simplest form of digital representation of topography Surface Models<br>
12
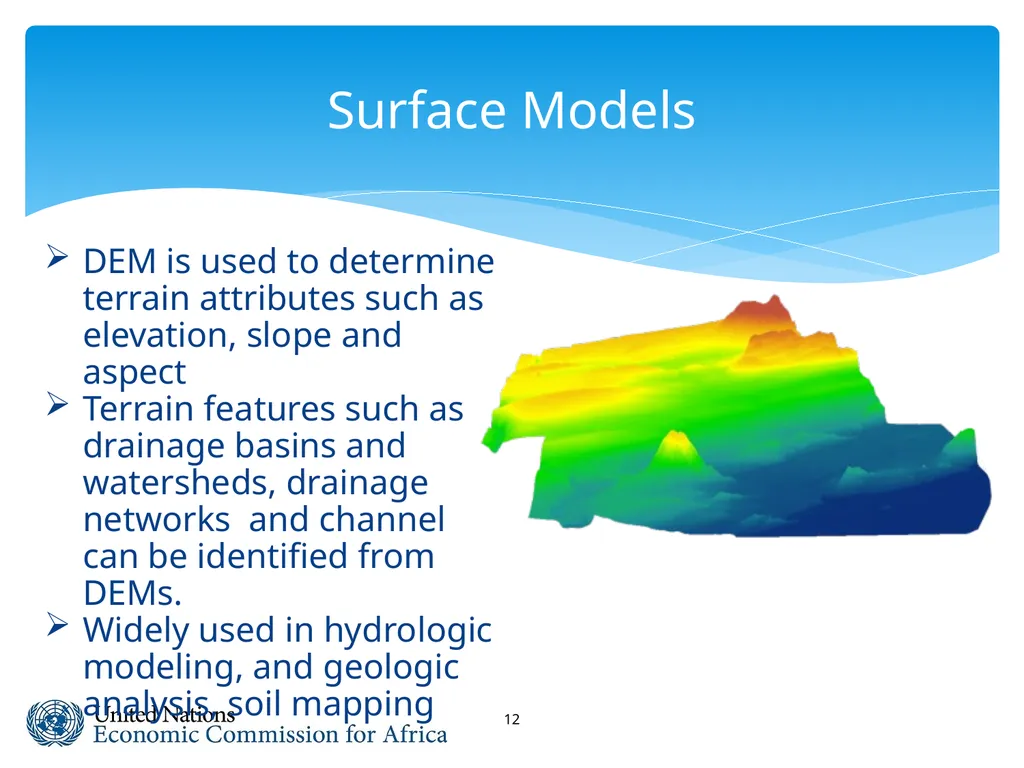
12 DEM is used to determine terrain attributes such as elevation, slope and aspect
Terrain features such as drainage basins and watersheds, drainage networks and channel can be identified from DEMs.
Widely used in hydrologic modeling, and geologic analysis, soil mapping Surface Models<br>
Terrain features such as drainage basins and watersheds, drainage networks and channel can be identified from DEMs.
Widely used in hydrologic modeling, and geologic analysis, soil mapping Surface Models<br>
13
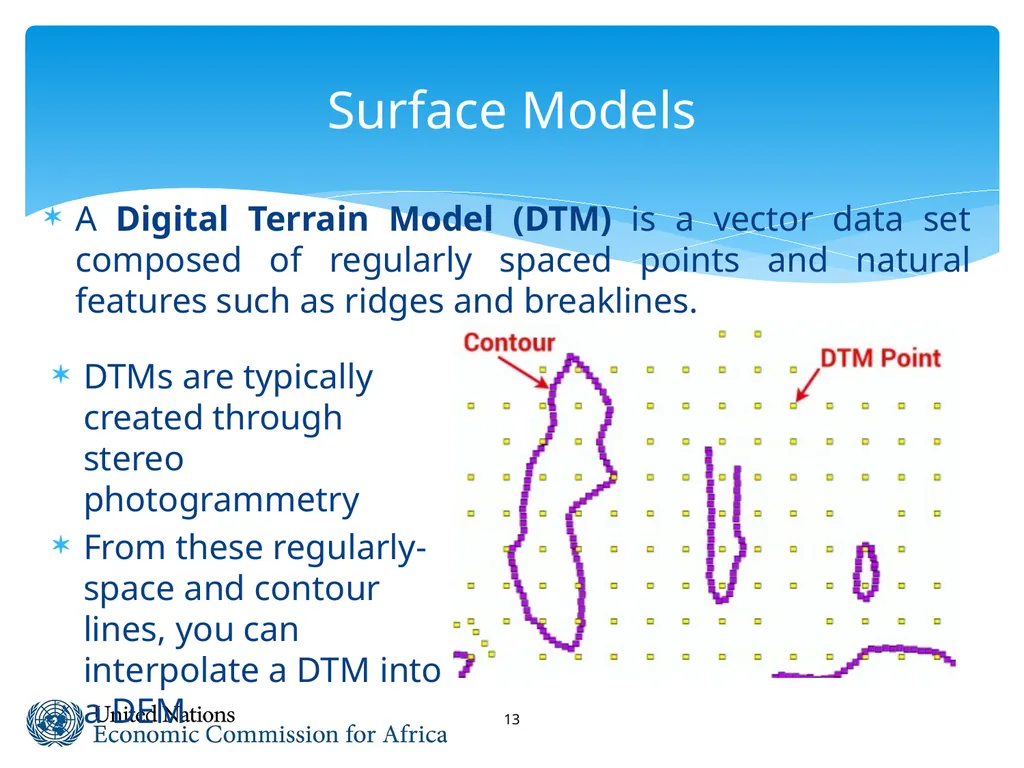
13 Surface Models A Digital Terrain Model (DTM) is a vector data set composed of regularly spaced points and natural features such as ridges and breaklines. DTMs are typically created through stereo photogrammetry
From these regularly-space and contour lines, you can interpolate a DTM into a DEM<br>
From these regularly-space and contour lines, you can interpolate a DTM into a DEM<br>
14
Surface modeling operations include:
Contour
Slope
Aspect
Hillshade
Viewshed
Visibility
Cut Fill
Interpolation Surface Modeling Operations<br>
Contour
Slope
Aspect
Hillshade
Viewshed
Visibility
Cut Fill
Interpolation Surface Modeling Operations<br>
15
Aspect (Spatial Analyst)
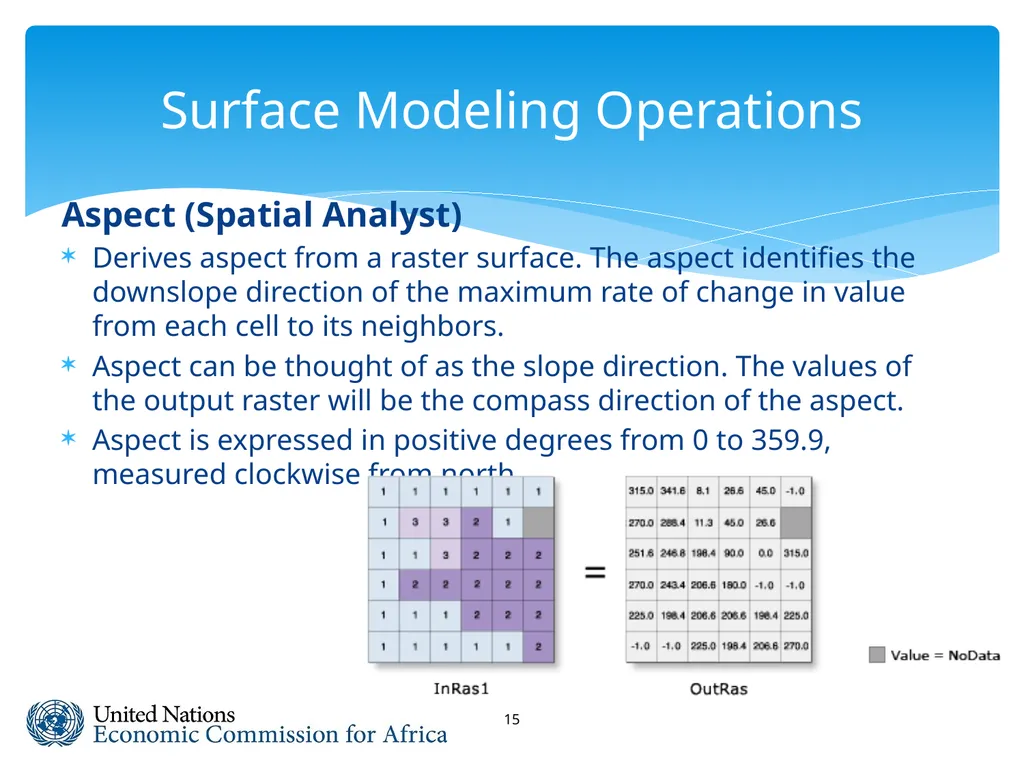
Derives aspect from a raster surface. The aspect identifies the downslope direction of the maximum rate of change in value from each cell to its neighbors.
Aspect can be thought of as the slope direction. The values of the output raster will be the compass direction of the aspect.
Aspect is expressed in positive degrees from 0 to 359.9, measured clockwise from north. 15 Surface Modeling Operations<br>
Derives aspect from a raster surface. The aspect identifies the downslope direction of the maximum rate of change in value from each cell to its neighbors.
Aspect can be thought of as the slope direction. The values of the output raster will be the compass direction of the aspect.
Aspect is expressed in positive degrees from 0 to 359.9, measured clockwise from north. 15 Surface Modeling Operations<br>
16
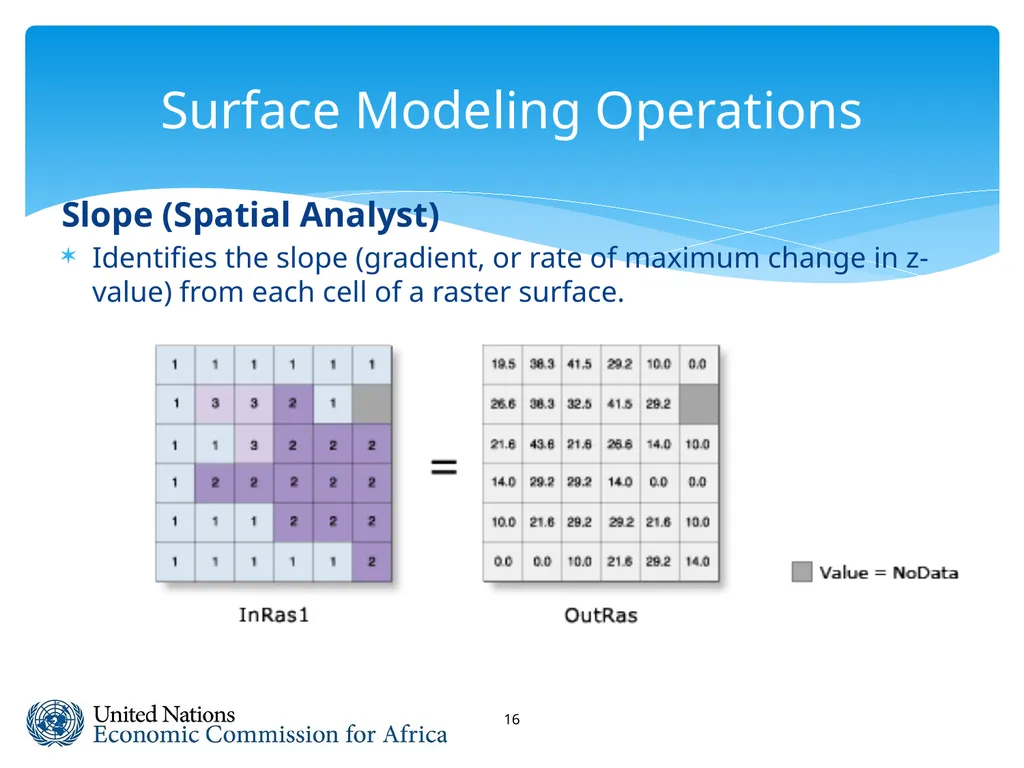
Slope (Spatial Analyst)
Identifies the slope (gradient, or rate of maximum change in z-value) from each cell of a raster surface. 16 Surface Modeling Operations<br>
Identifies the slope (gradient, or rate of maximum change in z-value) from each cell of a raster surface. 16 Surface Modeling Operations<br>
17
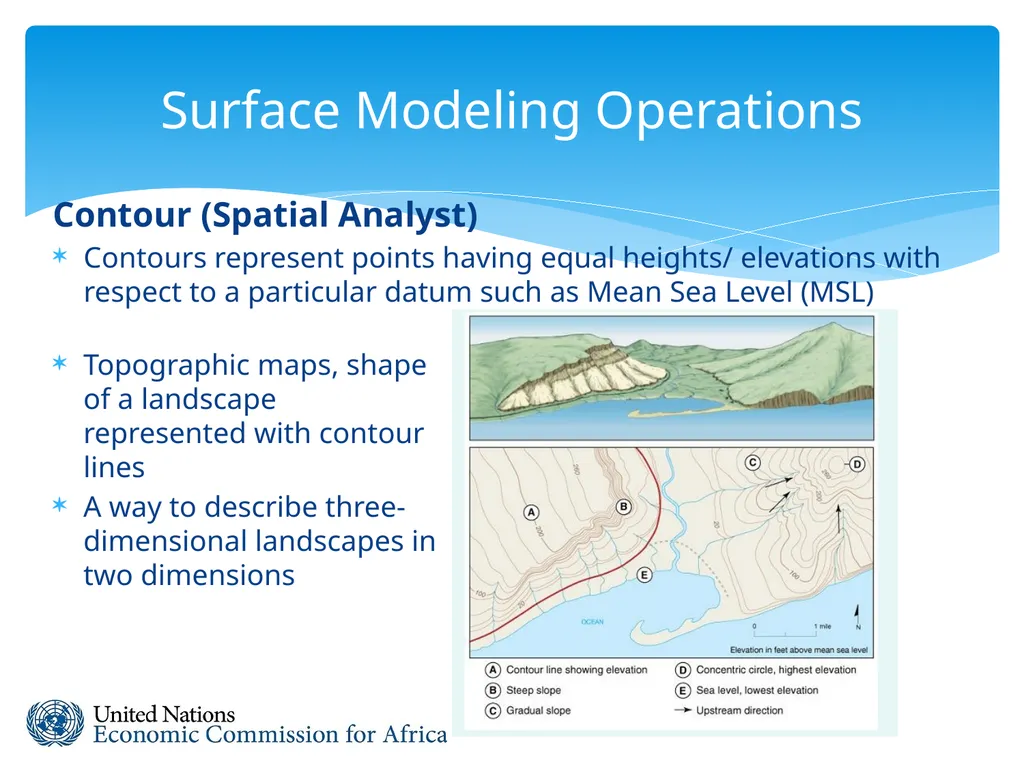
Contour (Spatial Analyst)
Contours represent points having equal heights/ elevations with respect to a particular datum such as Mean Sea Level (MSL) 17 Surface Modeling Operations Topographic maps, shape of a landscape represented with contour lines
A way to describe three-dimensional landscapes in two dimensions<br>
Contours represent points having equal heights/ elevations with respect to a particular datum such as Mean Sea Level (MSL) 17 Surface Modeling Operations Topographic maps, shape of a landscape represented with contour lines
A way to describe three-dimensional landscapes in two dimensions<br>
18
Contour (Spatial Analyst)
Contour tool: Creates a line feature class of contours (isolines) from a raster surface.
A base contour is used; e.g. to create contours every 10 meters, starting at 5 meters
5 is the base contour, and 10 is the contour interval. values to be contoured 5, 15, 25, 35, 45, … 18 Surface Modeling Operations<br>
Contour tool: Creates a line feature class of contours (isolines) from a raster surface.
A base contour is used; e.g. to create contours every 10 meters, starting at 5 meters
5 is the base contour, and 10 is the contour interval. values to be contoured 5, 15, 25, 35, 45, … 18 Surface Modeling Operations<br>
19
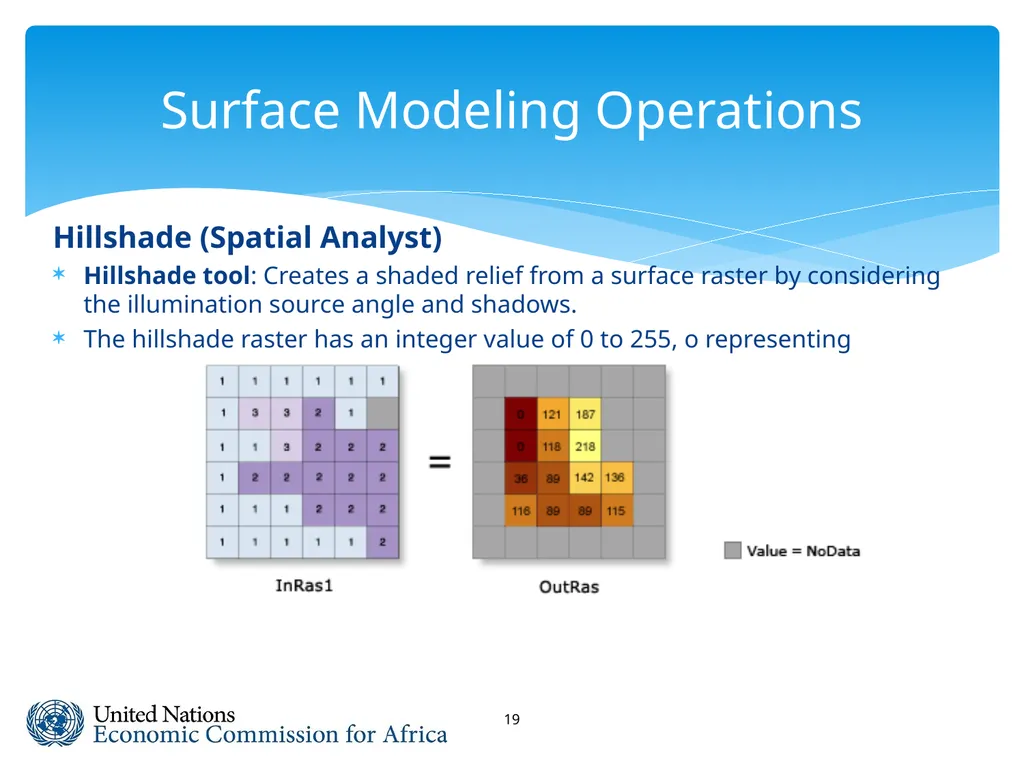
19 Surface Modeling Operations Hillshade (Spatial Analyst)
Hillshade tool: Creates a shaded relief from a surface raster by considering the illumination source angle and shadows.
The hillshade raster has an integer value of 0 to 255, o representing<br>
Hillshade tool: Creates a shaded relief from a surface raster by considering the illumination source angle and shadows.
The hillshade raster has an integer value of 0 to 255, o representing<br>
20
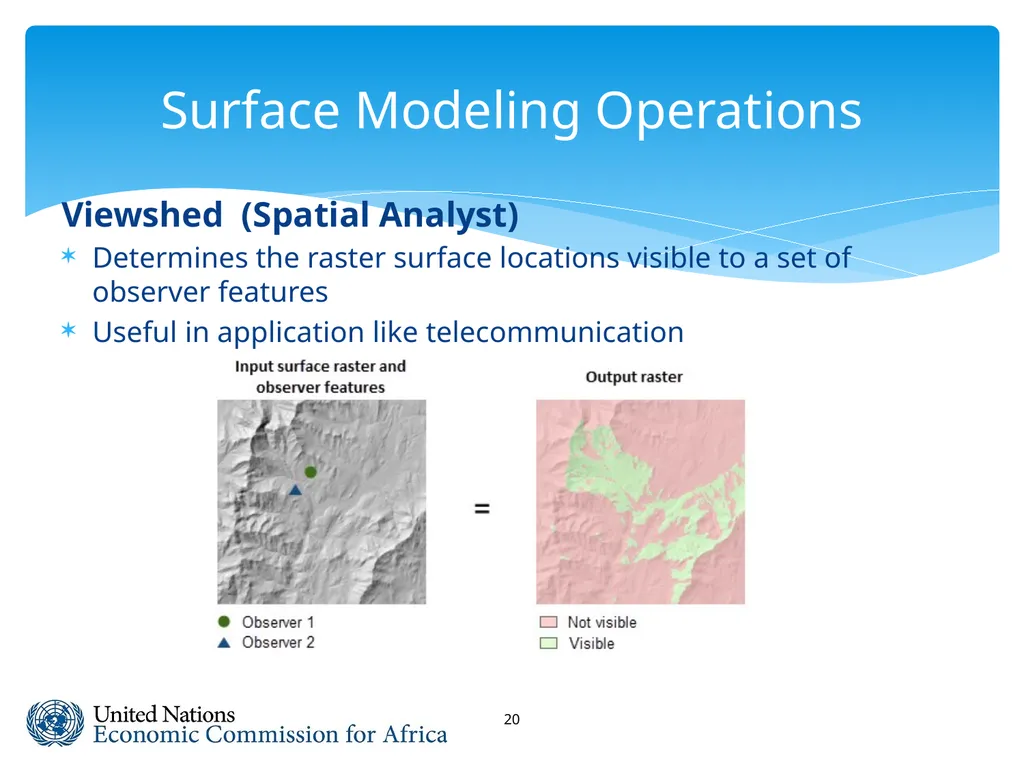
Viewshed (Spatial Analyst)
Determines the raster surface locations visible to a set of observer features
Useful in application like telecommunication 20 Surface Modeling Operations<br>
Determines the raster surface locations visible to a set of observer features
Useful in application like telecommunication 20 Surface Modeling Operations<br>
21
Spatial interpolation is used to take known values and interpolate them into a surface, deriving new estimated surface values
Elevation points interpolated to generate DEM
Contour lines interpolated to generate DEM
Using interpolation methods, users can create surfaces from sampled locations without having to visit every location of a study area, saving time and effort. Surface Modeling Operations<br>
Elevation points interpolated to generate DEM
Contour lines interpolated to generate DEM
Using interpolation methods, users can create surfaces from sampled locations without having to visit every location of a study area, saving time and effort. Surface Modeling Operations<br>
22
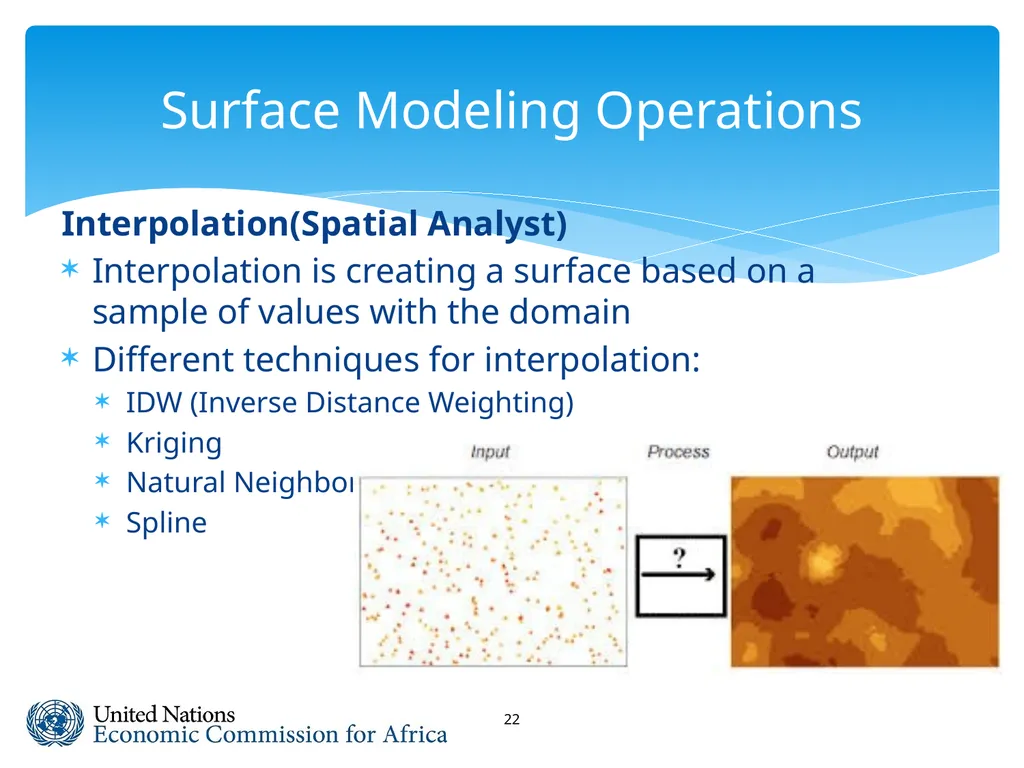
Interpolation(Spatial Analyst)
Interpolation is creating a surface based on a sample of values with the domain
Different techniques for interpolation:
IDW (Inverse Distance Weighting)
Kriging
Natural Neighbor
Spline 22 Surface Modeling Operations<br>
Interpolation is creating a surface based on a sample of values with the domain
Different techniques for interpolation:
IDW (Inverse Distance Weighting)
Kriging
Natural Neighbor
Spline 22 Surface Modeling Operations<br>
23
IDW: Interpolates a raster surface from points using an inverse distance weighted (IDW) technique
Values for nearby points tend to be more similar
IDW weights the value of each point by its distance to the cell being analyzed and averages the values
It assumes that unknown value is influenced more by nearby points than far away points 23 Surface Modeling Operations<br>
Values for nearby points tend to be more similar
IDW weights the value of each point by its distance to the cell being analyzed and averages the values
It assumes that unknown value is influenced more by nearby points than far away points 23 Surface Modeling Operations<br>
24
Spline: Interpolates a raster surface from points using a two-dimensional minimum curvature spline technique.
It fits a curve through the sample data and assigns values to other locations based on their location on the curve
Regularized Method: results in a smoother surface that smoother areas of abruptly changing values
Tension Method: results in a rougher surface that more closely adheres to abrupt changes in sample points 24 Surface Modeling Operations<br>
It fits a curve through the sample data and assigns values to other locations based on their location on the curve
Regularized Method: results in a smoother surface that smoother areas of abruptly changing values
Tension Method: results in a rougher surface that more closely adheres to abrupt changes in sample points 24 Surface Modeling Operations<br>
25
Kriging Method: Interpolates a raster surface from points using kriging.
Like IDW interpolation, Kriging forms weights from surrounding measured values to predict values at unmeasured locations.
IDW uses a simple algorithm based on distance
Kriging weights come from a semi-variogram that is developed by looking at the spatial structure of the data
Predictions are made for locations in the study area based on the semi-variogram and the spatial arrangement of measured values that are nearby
Semi-variograms measure the strength of statistical correlation as a function of distance; they quantify spatial autocorrelation
Kriging associates probability with each prediction 25 Surface Modeling Operations<br>
Like IDW interpolation, Kriging forms weights from surrounding measured values to predict values at unmeasured locations.
IDW uses a simple algorithm based on distance
Kriging weights come from a semi-variogram that is developed by looking at the spatial structure of the data
Predictions are made for locations in the study area based on the semi-variogram and the spatial arrangement of measured values that are nearby
Semi-variograms measure the strength of statistical correlation as a function of distance; they quantify spatial autocorrelation
Kriging associates probability with each prediction 25 Surface Modeling Operations<br>
26
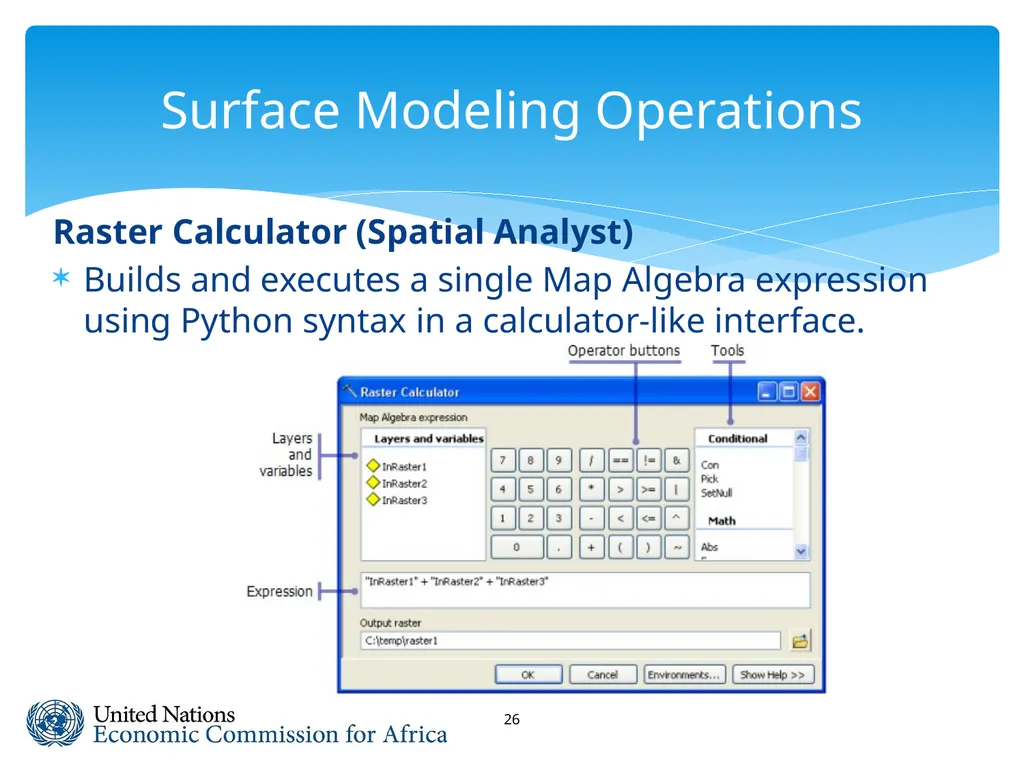
Raster Calculator (Spatial Analyst)
Builds and executes a single Map Algebra expression using Python syntax in a calculator-like interface. 26 Surface Modeling Operations<br>
Builds and executes a single Map Algebra expression using Python syntax in a calculator-like interface. 26 Surface Modeling Operations<br>
27
THANK YOU! denekewa@Un.org<br>