
STAT 101 Dr. Kari Lock Morgan Collecting Data:
T
Published · 32 slides · 0 views
1 / 1
Description
STAT 101 Dr. Kari Lock Morgan Collecting Data: Sampling SECTION 1.2 Sample versus Population Statistical Inference Sampling Bias Simple Random Sample Other Sources of Bias Review of Last Class Data are everywhere, and pertain to a wide
Related Topics
Share
Embed code
Download this presentation From Below
"STAT 101 Dr. Kari Lock Morgan Collecting Data:" is the property of its rightful owner. Permission is granted to download and print the materials on this website for personal, non-commercial use only, and to display it on your personal computer provided you do not modify the materials and that you retain all copyright notices contained in the materials. By downloading content from our website, you accept the terms of this agreement.
Presentation Transcript
01
STAT 101
Dr. Kari Lock Morgan Collecting Data: Sampling SECTION 1.2
Sample versus Population
Statistical Inference
Sampling Bias
Simple Random Sample
Other Sources of Bias<br>
Dr. Kari Lock Morgan Collecting Data: Sampling SECTION 1.2
Sample versus Population
Statistical Inference
Sampling Bias
Simple Random Sample
Other Sources of Bias<br>
02
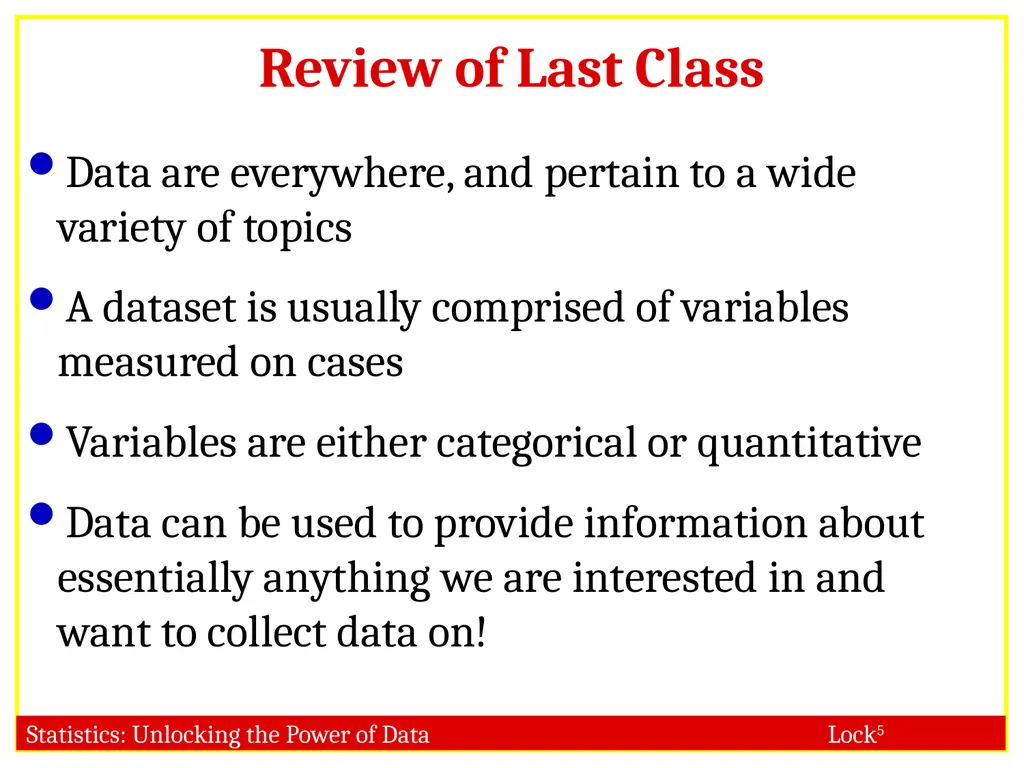
Review of Last Class Data are everywhere, and pertain to a wide variety of topics
A dataset is usually comprised of variables measured on cases
Variables are either categorical or quantitative
Data can be used to provide information about essentially anything we are interested in and want to collect data on!<br>
A dataset is usually comprised of variables measured on cases
Variables are either categorical or quantitative
Data can be used to provide information about essentially anything we are interested in and want to collect data on!<br>
03
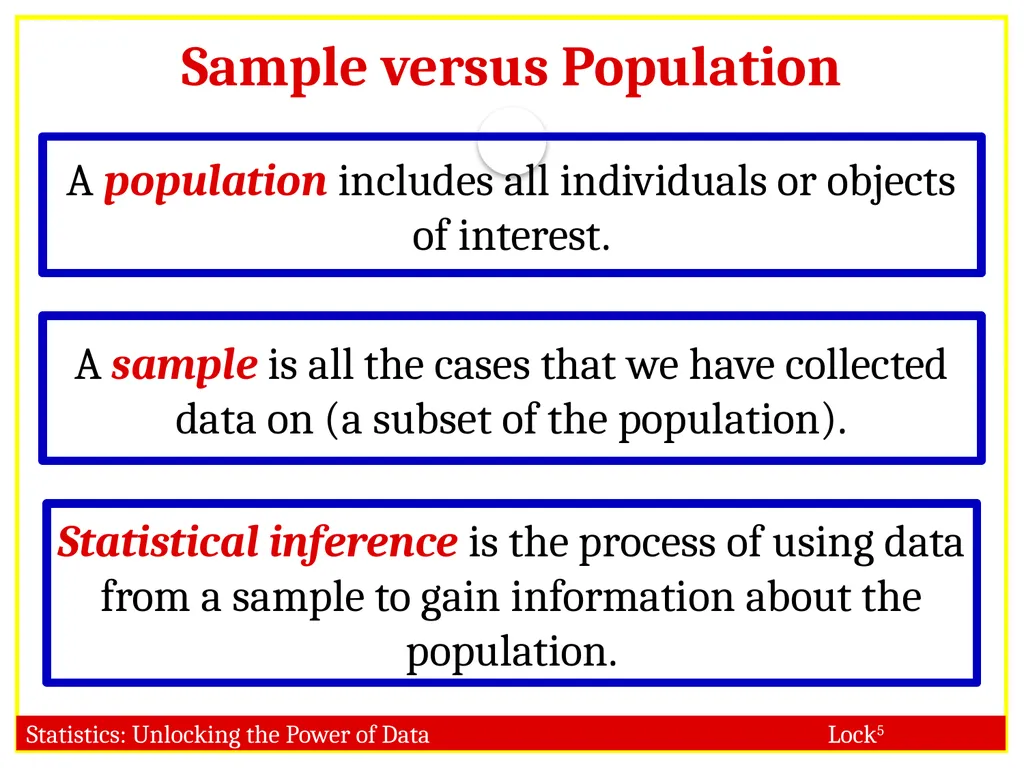
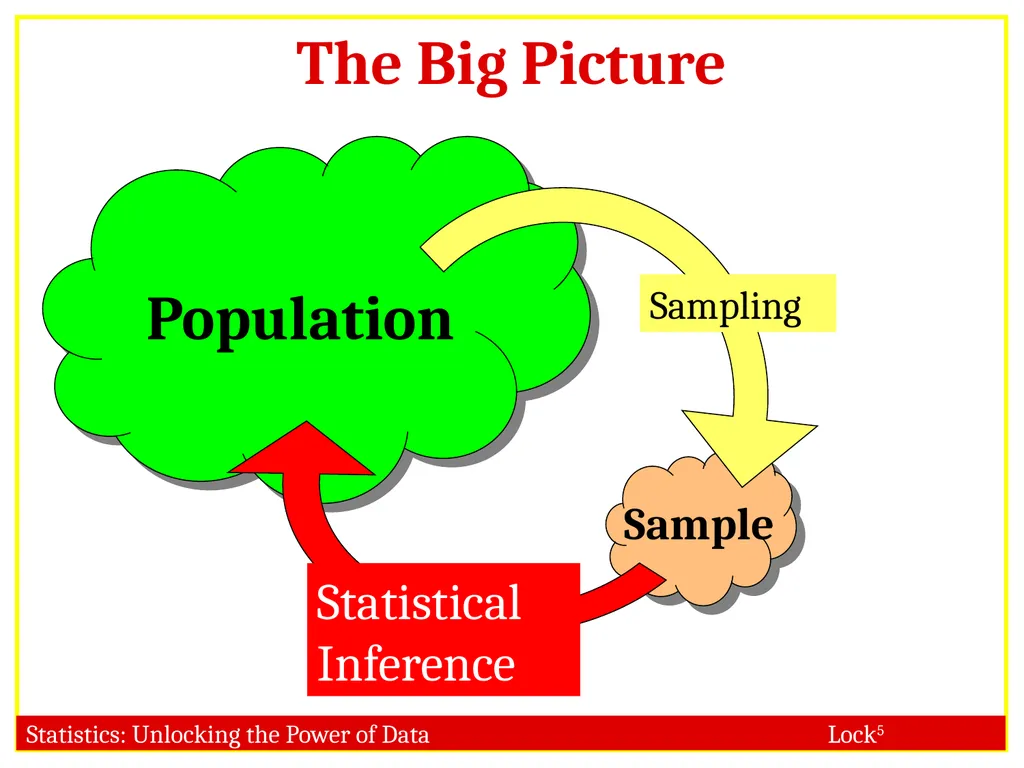
Sample versus Population A population includes all individuals or objects of interest. A sample is all the cases that we have collected data on (a subset of the population). Statistical inference is the process of using data from a sample to gain information about the population.<br>
04
The Big Picture Population Sampling Statistical Inference<br>
05
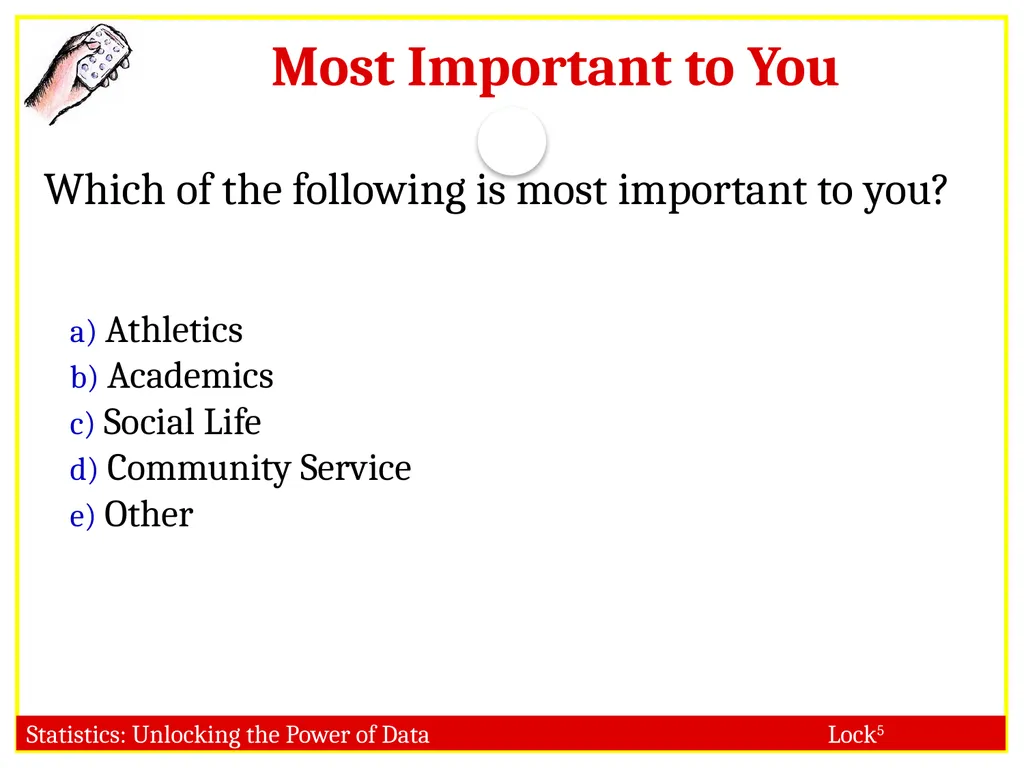
Most Important to You Which of the following is most important to you? Athletics
Academics
Social Life
Community Service
Other<br>
Academics
Social Life
Community Service
Other<br>
06
Most Important to You Suppose researchers studying student life at Duke use the results of our clicker question to investigate what Duke students find important
What is the sample?
What is the population?
Can the sample data be generalized to make inferences about the population? Why or why not?<br>
What is the sample?
What is the population?
Can the sample data be generalized to make inferences about the population? Why or why not?<br>
07
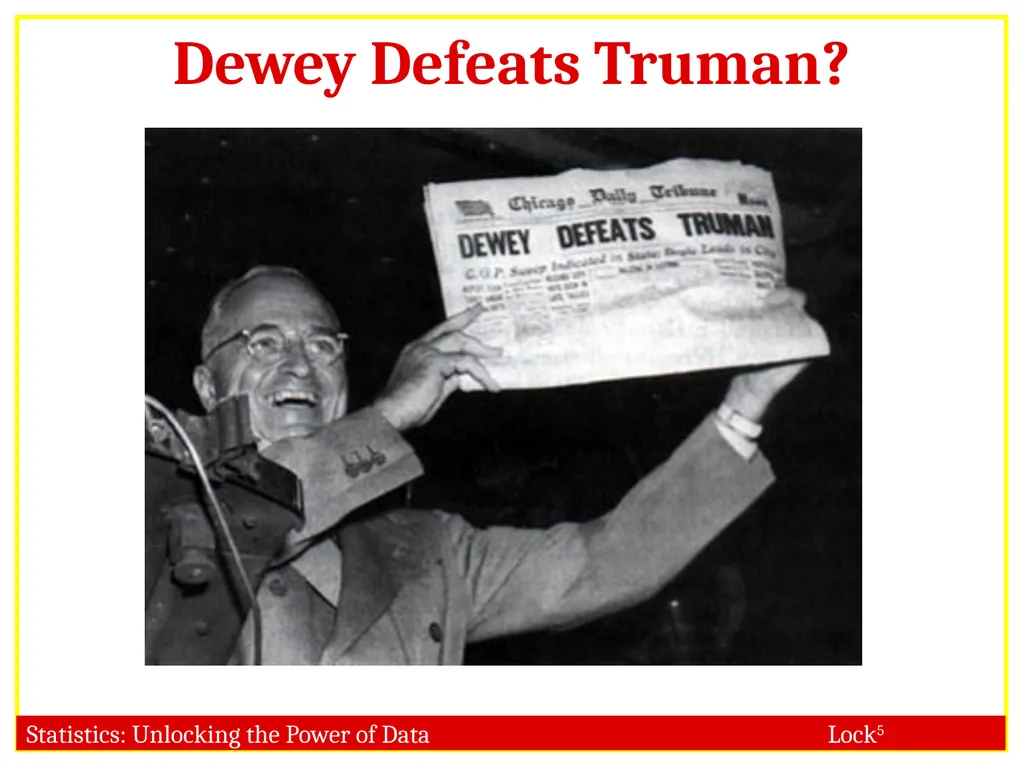
Dewey Defeats Truman?<br>
08
Dewey Defeats Truman? The paper was published before the conclusion of the 1948 presidential election, and was based on the results of a large telephone poll which showed Dewey sweeping Truman
However, Harry S. Truman won the election
What went wrong?<br>
However, Harry S. Truman won the election
What went wrong?<br>
09
Sampling Bias Sampling bias occurs when the method of selecting a sample causes the sample to differ from the population in some relevant way. If sampling bias exists, we cannot trust generalizations from the sample to the population<br>
10
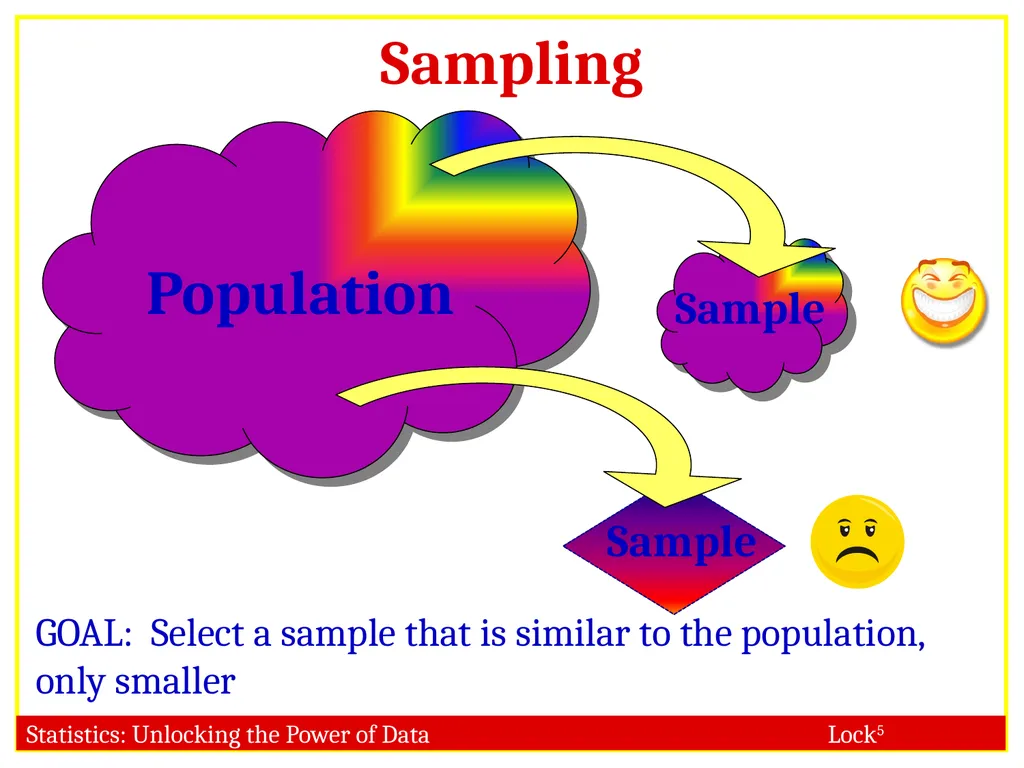
Sampling Population Sample GOAL: Select a sample that is similar to the population, only smaller<br>
11
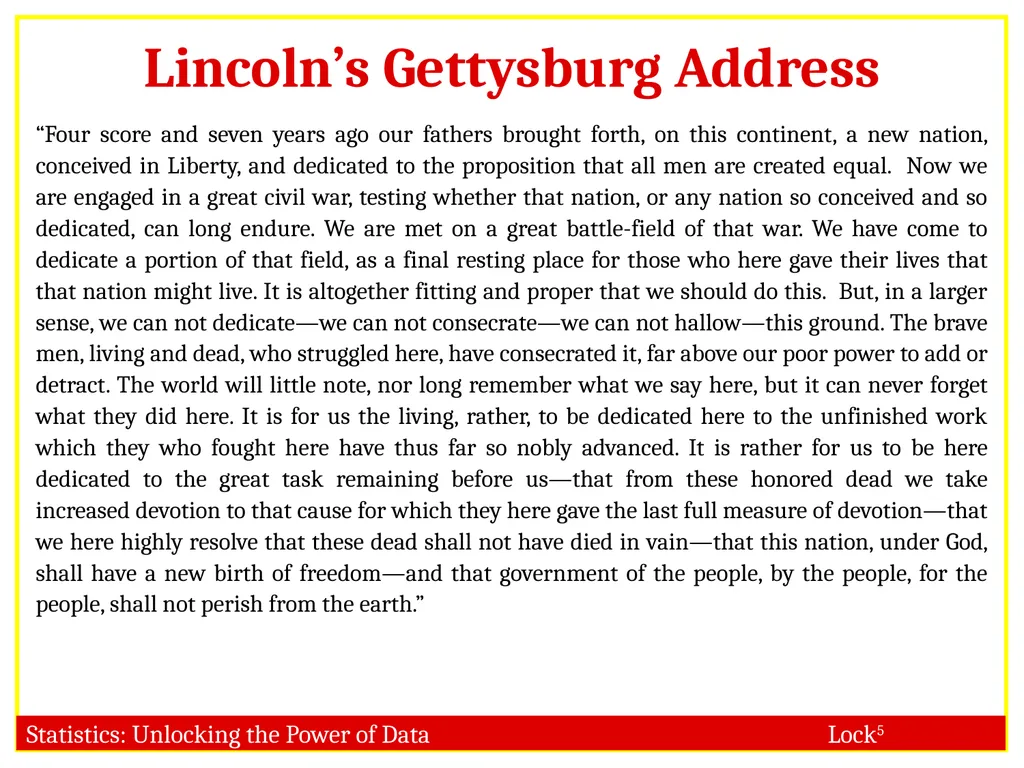
Can you avoid sampling bias? The next slide shows Lincoln’s Gettysburg Address. The entire population, all words in his address, will be shown to you. What is the average word length?
Your task: Select a sample of 10 words that resemble the overall address. Write them down.
Calculate the average number of letters for the words in your sample
Place a dot above your sample average on the board<br>
Your task: Select a sample of 10 words that resemble the overall address. Write them down.
Calculate the average number of letters for the words in your sample
Place a dot above your sample average on the board<br>
12
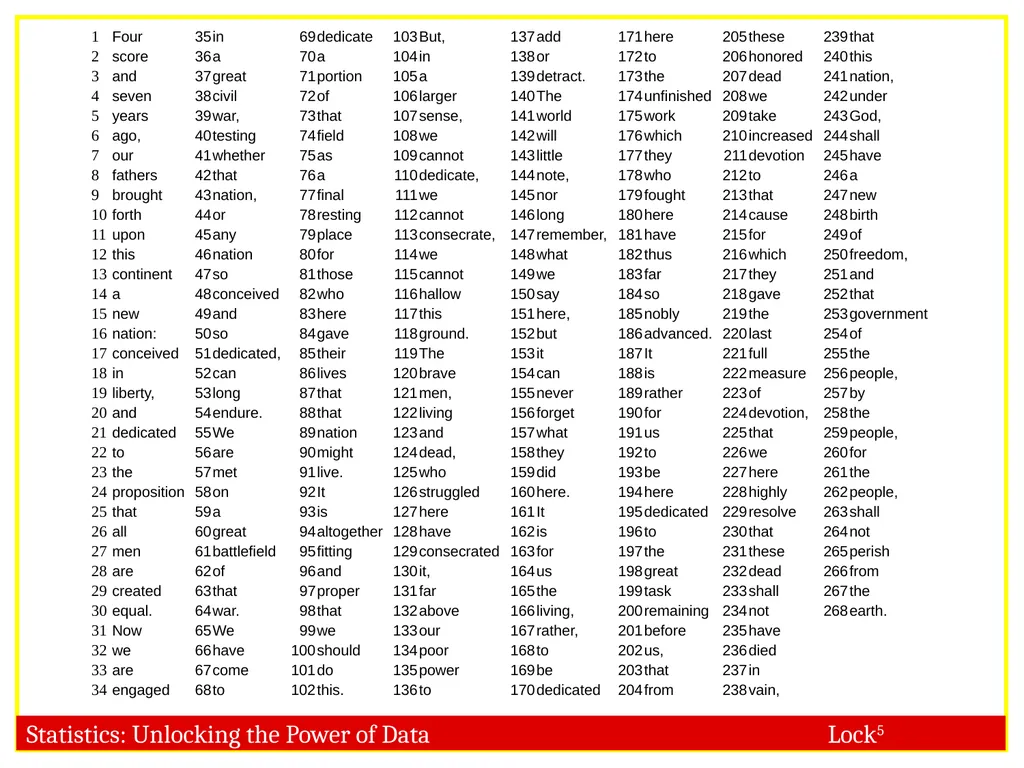
Lincoln’s Gettysburg Address “Four score and seven years ago our fathers brought forth, on this continent, a new nation, conceived in Liberty, and dedicated to the proposition that all men are created equal. Now we are engaged in a great civil war, testing whether that nation, or any nation so conceived and so dedicated, can long endure. We are met on a great battle-field of that war. We have come to dedicate a portion of that field, as a final resting place for those who here gave their lives that that nation might live. It is altogether fitting and proper that we should do this. But, in a larger sense, we can not dedicate—we can not consecrate—we can not hallow—this ground. The brave men, living and dead, who struggled here, have consecrated it, far above our poor power to add or detract. The world will little note, nor long remember what we say here, but it can never forget what they did here. It is for us the living, rather, to be dedicated here to the unfinished work which they who fought here have thus far so nobly advanced. It is rather for us to be here dedicated to the great task remaining before us—that from these honored dead we take increased devotion to that cause for which they here gave the last full measure of devotion—that we here highly resolve that these dead shall not have died in vain—that this nation, under God, shall have a new birth of freedom—and that government of the people, by the people, for the people, shall not perish from the earth.”<br>
13
Can you avoid sampling bias? Actual average:
People are TERRIBLE at selecting a good sample, even when explicitly trying to avoid sampling bias!
We need a better way…<br>
People are TERRIBLE at selecting a good sample, even when explicitly trying to avoid sampling bias!
We need a better way…<br>
14
Random Sampling How can we make sure to avoid sampling bias?
Imagine putting the names of all the units of the population into a hat, and drawing out names at random to be in the sample
More often, we use technology Take a RANDOM sample!<br>
Imagine putting the names of all the units of the population into a hat, and drawing out names at random to be in the sample
More often, we use technology Take a RANDOM sample!<br>
15
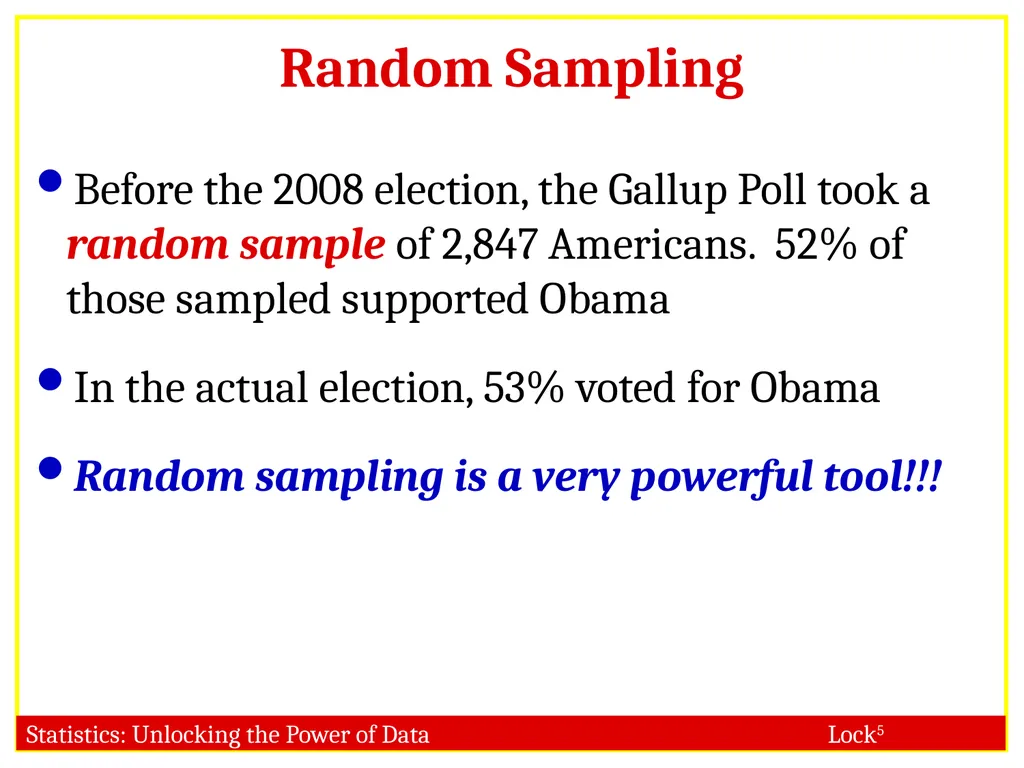
Random Sampling Before the 2008 election, the Gallup Poll took a random sample of 2,847 Americans. 52% of those sampled supported Obama
In the actual election, 53% voted for Obama
Random sampling is a very powerful tool!!!<br>
In the actual election, 53% voted for Obama
Random sampling is a very powerful tool!!!<br>
16
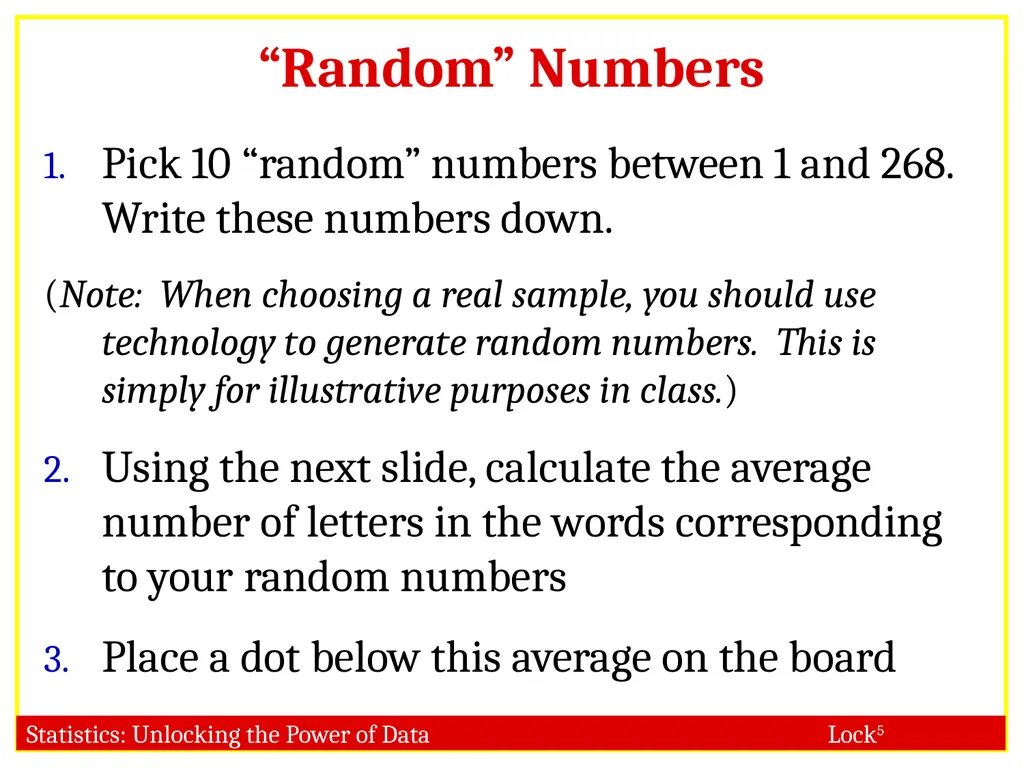
“Random” Numbers Pick 10 “random” numbers between 1 and 268. Write these numbers down.
(Note: When choosing a real sample, you should use technology to generate random numbers. This is simply for illustrative purposes in class.)
Using the next slide, calculate the average number of letters in the words corresponding to your random numbers
Place a dot below this average on the board<br>
(Note: When choosing a real sample, you should use technology to generate random numbers. This is simply for illustrative purposes in class.)
Using the next slide, calculate the average number of letters in the words corresponding to your random numbers
Place a dot below this average on the board<br>
17
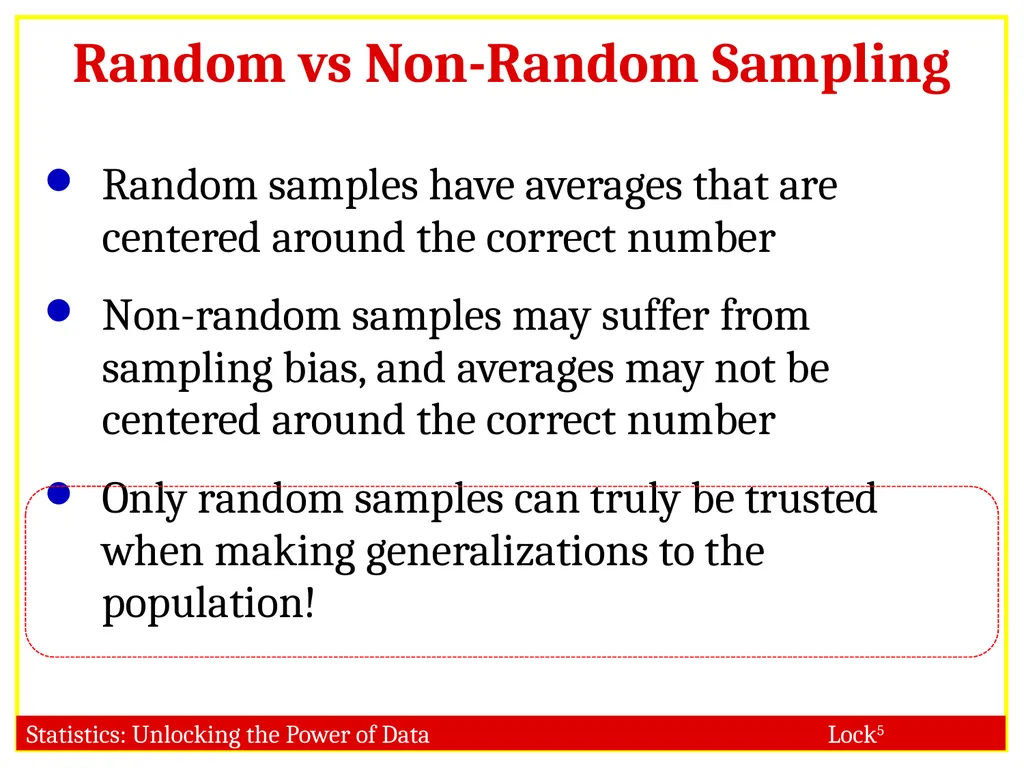
Random vs Non-Random Sampling Random samples have averages that are centered around the correct number
Non-random samples may suffer from sampling bias, and averages may not be centered around the correct number
Only random samples can truly be trusted when making generalizations to the population!<br>
Non-random samples may suffer from sampling bias, and averages may not be centered around the correct number
Only random samples can truly be trusted when making generalizations to the population!<br>
18
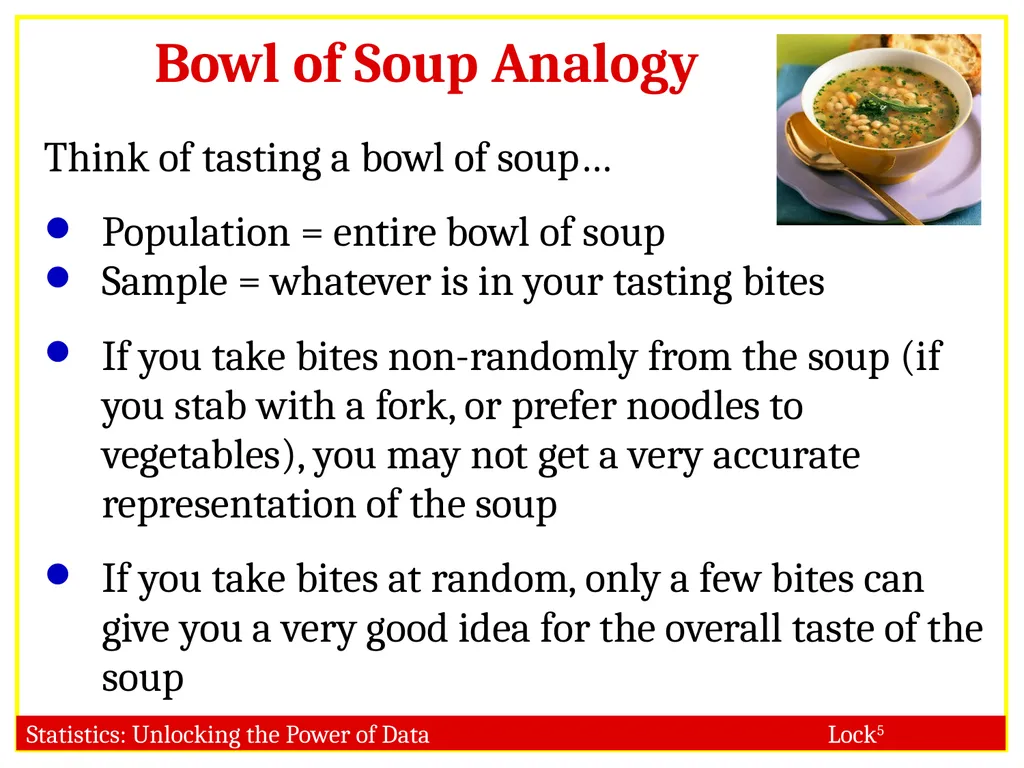
Bowl of Soup Analogy Think of tasting a bowl of soup…
Population = entire bowl of soup
Sample = whatever is in your tasting bites
If you take bites non-randomly from the soup (if you stab with a fork, or prefer noodles to vegetables), you may not get a very accurate representation of the soup
If you take bites at random, only a few bites can give you a very good idea for the overall taste of the soup<br>
Population = entire bowl of soup
Sample = whatever is in your tasting bites
If you take bites non-randomly from the soup (if you stab with a fork, or prefer noodles to vegetables), you may not get a very accurate representation of the soup
If you take bites at random, only a few bites can give you a very good idea for the overall taste of the soup<br>
19
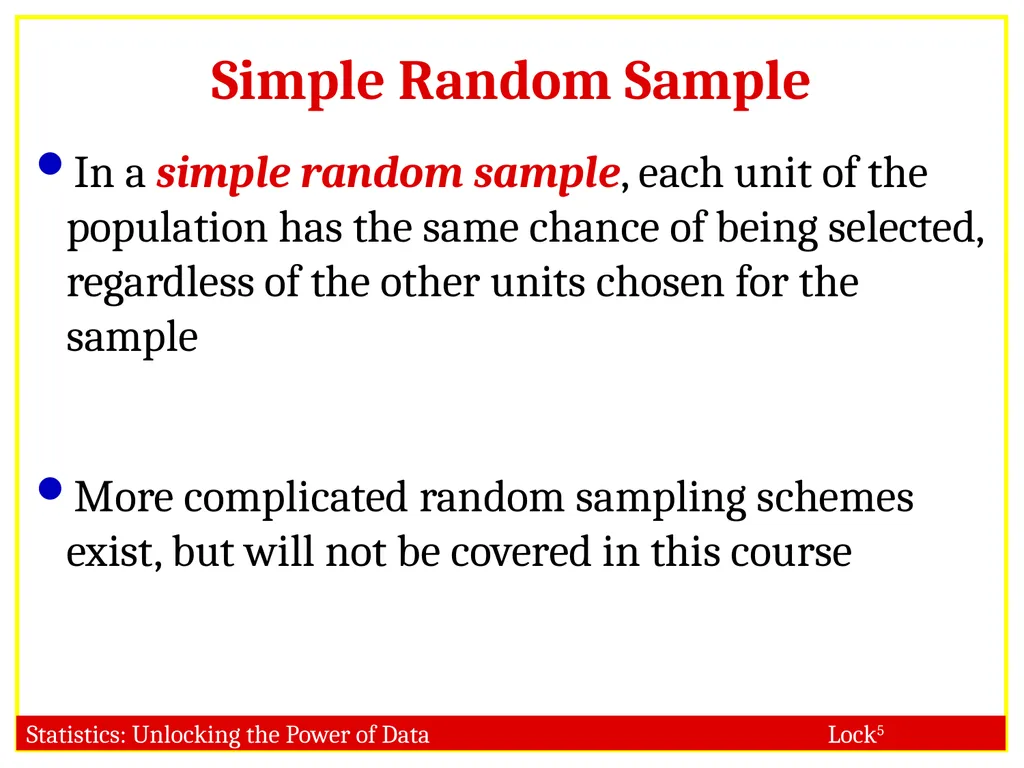
Simple Random Sample In a simple random sample, each unit of the population has the same chance of being selected, regardless of the other units chosen for the sample
More complicated random sampling schemes exist, but will not be covered in this course<br>
More complicated random sampling schemes exist, but will not be covered in this course<br>
20
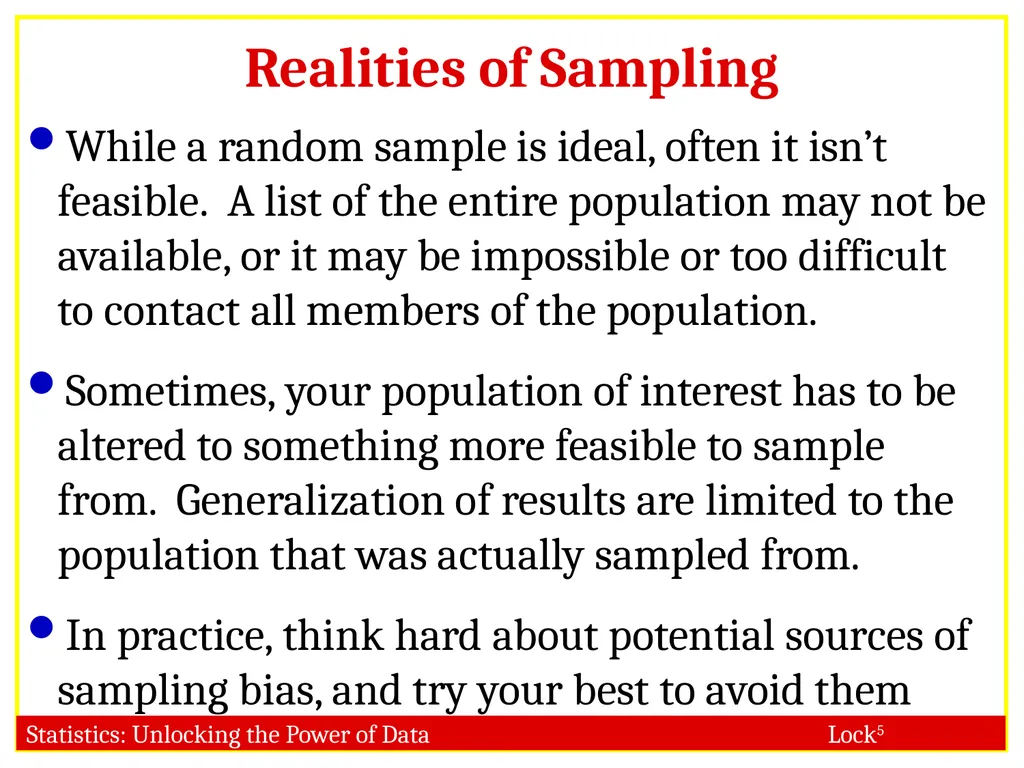
Realities of Sampling While a random sample is ideal, often it isn’t feasible. A list of the entire population may not be available, or it may be impossible or too difficult to contact all members of the population.
Sometimes, your population of interest has to be altered to something more feasible to sample from. Generalization of results are limited to the population that was actually sampled from.
In practice, think hard about potential sources of sampling bias, and try your best to avoid them<br>
Sometimes, your population of interest has to be altered to something more feasible to sample from. Generalization of results are limited to the population that was actually sampled from.
In practice, think hard about potential sources of sampling bias, and try your best to avoid them<br>
21
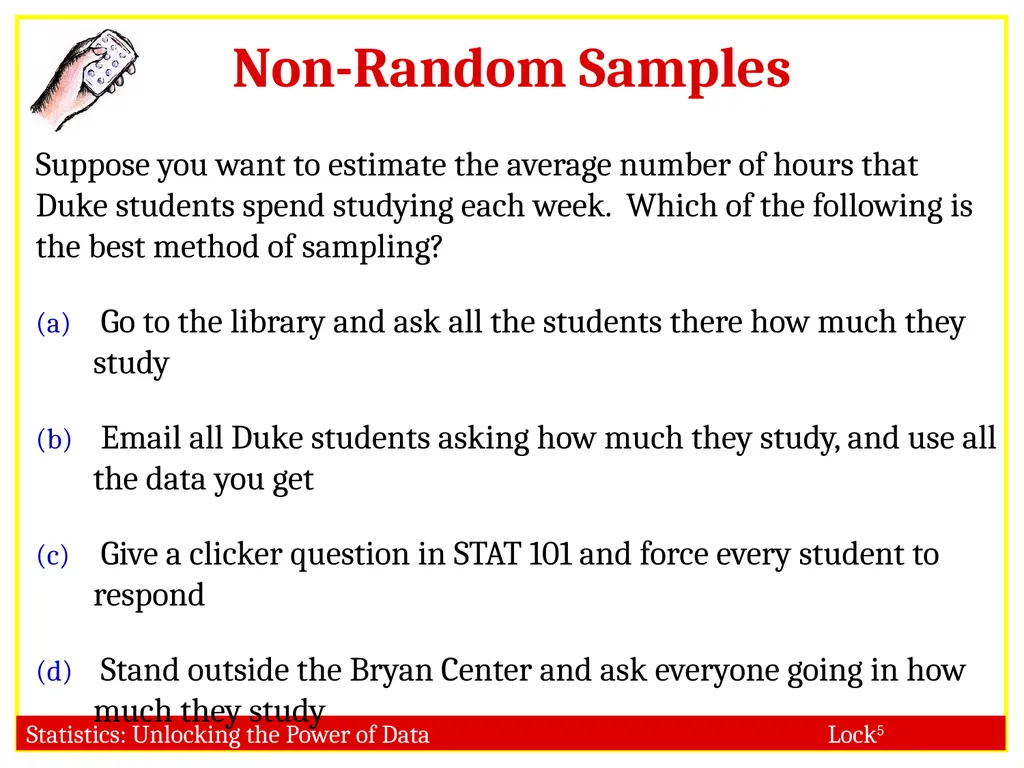
Non-Random Samples Suppose you want to estimate the average number of hours that Duke students spend studying each week. Which of the following is the best method of sampling?
Go to the library and ask all the students there how much they study
Email all Duke students asking how much they study, and use all the data you get
Give a clicker question in STAT 101 and force every student to respond
Stand outside the Bryan Center and ask everyone going in how much they study<br>
Go to the library and ask all the students there how much they study
Email all Duke students asking how much they study, and use all the data you get
Give a clicker question in STAT 101 and force every student to respond
Stand outside the Bryan Center and ask everyone going in how much they study<br>
22
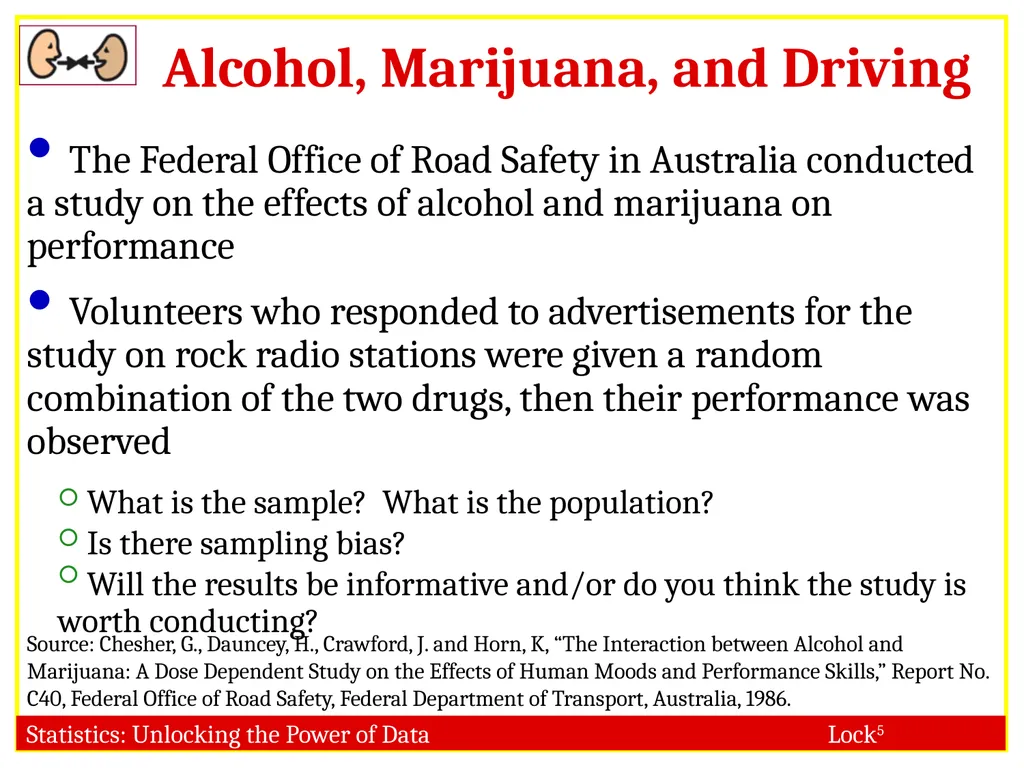
Alcohol, Marijuana, and Driving The Federal Office of Road Safety in Australia conducted a study on the effects of alcohol and marijuana on performance
Volunteers who responded to advertisements for the study on rock radio stations were given a random combination of the two drugs, then their performance was observed
What is the sample? What is the population?
Is there sampling bias?
Will the results be informative and/or do you think the study is worth conducting? Source: Chesher, G., Dauncey, H., Crawford, J. and Horn, K, “The Interaction between Alcohol and Marijuana: A Dose Dependent Study on the Effects of Human Moods and Performance Skills,” Report No. C40, Federal Office of Road Safety, Federal Department of Transport, Australia, 1986.<br>
Volunteers who responded to advertisements for the study on rock radio stations were given a random combination of the two drugs, then their performance was observed
What is the sample? What is the population?
Is there sampling bias?
Will the results be informative and/or do you think the study is worth conducting? Source: Chesher, G., Dauncey, H., Crawford, J. and Horn, K, “The Interaction between Alcohol and Marijuana: A Dose Dependent Study on the Effects of Human Moods and Performance Skills,” Report No. C40, Federal Office of Road Safety, Federal Department of Transport, Australia, 1986.<br>
23
Papers Note: The original sources for the studies are provided, and the papers will appear on the website in the order they are used in class
If interested in the details of the study, please read the original article!<br>
If interested in the details of the study, please read the original article!<br>
24
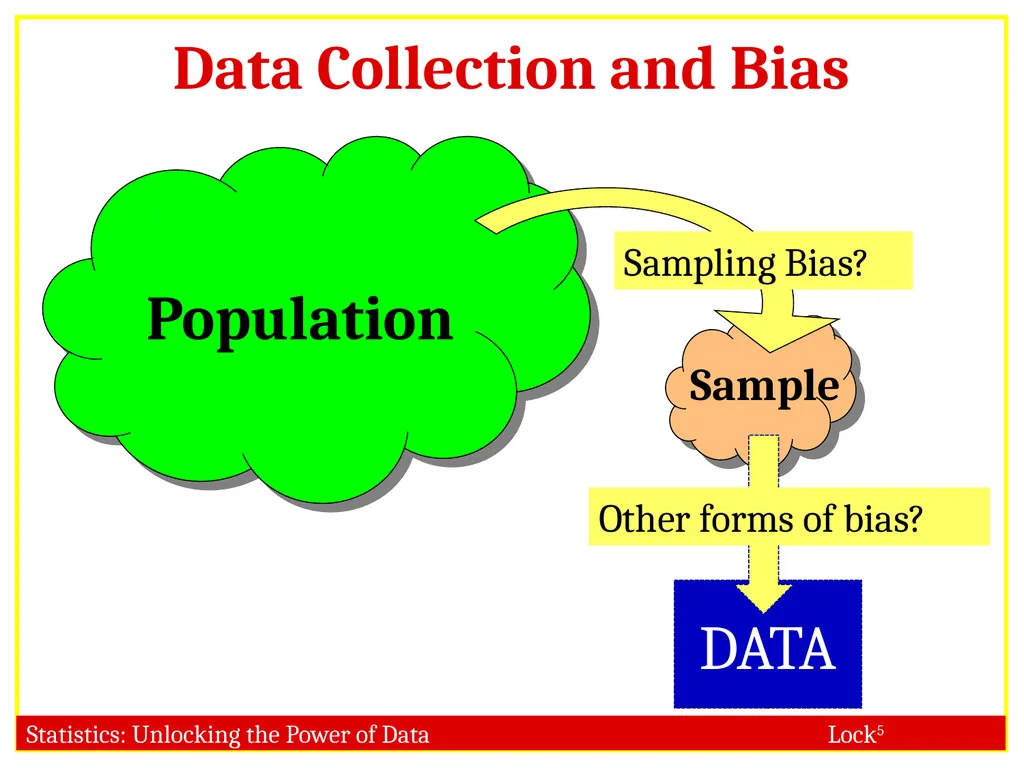
DATA Data Collection and Bias Population Sampling Bias? Other forms of bias?<br>
25
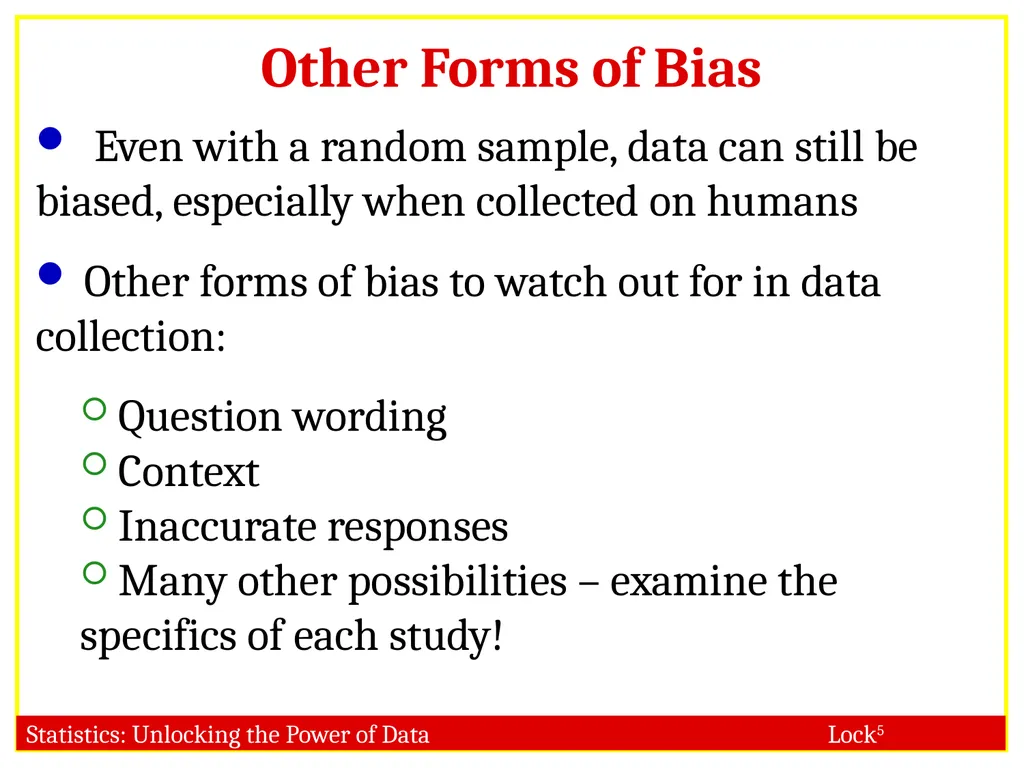
Other Forms of Bias Even with a random sample, data can still be biased, especially when collected on humans
Other forms of bias to watch out for in data collection:
Question wording
Context
Inaccurate responses
Many other possibilities – examine the specifics of each study!<br>
Other forms of bias to watch out for in data collection:
Question wording
Context
Inaccurate responses
Many other possibilities – examine the specifics of each study!<br>
26
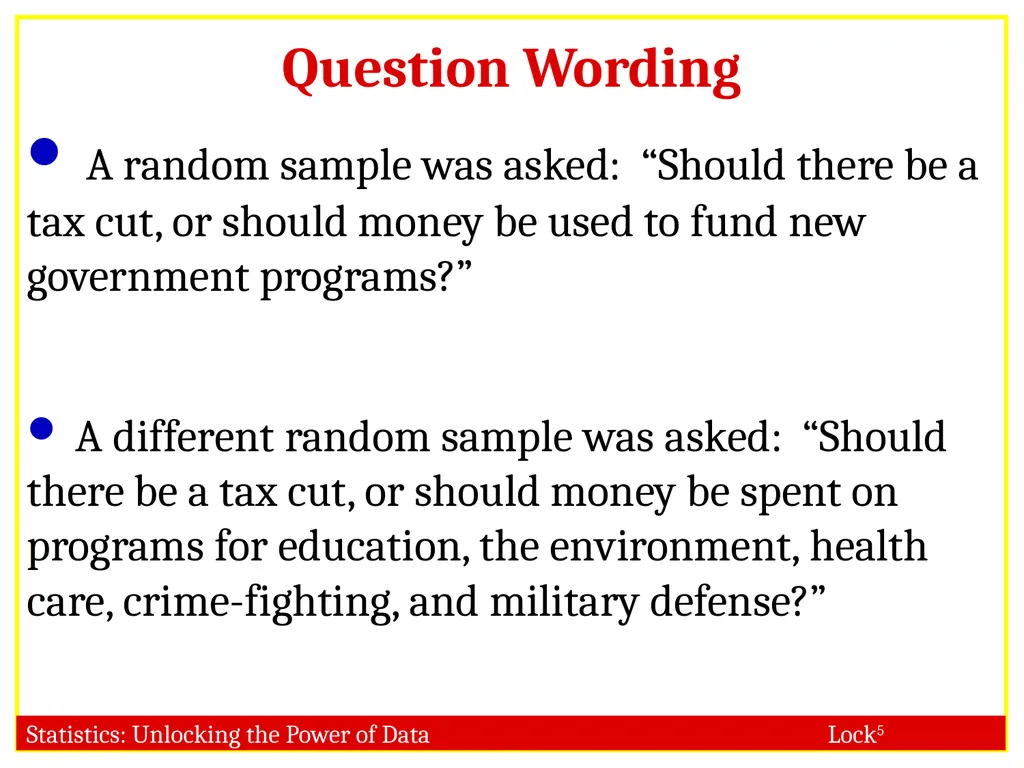
Question Wording A random sample was asked: “Should there be a tax cut, or should money be used to fund new government programs?”
A different random sample was asked: “Should there be a tax cut, or should money be spent on programs for education, the environment, health care, crime-fighting, and military defense?”<br>
A different random sample was asked: “Should there be a tax cut, or should money be spent on programs for education, the environment, health care, crime-fighting, and military defense?”<br>
27
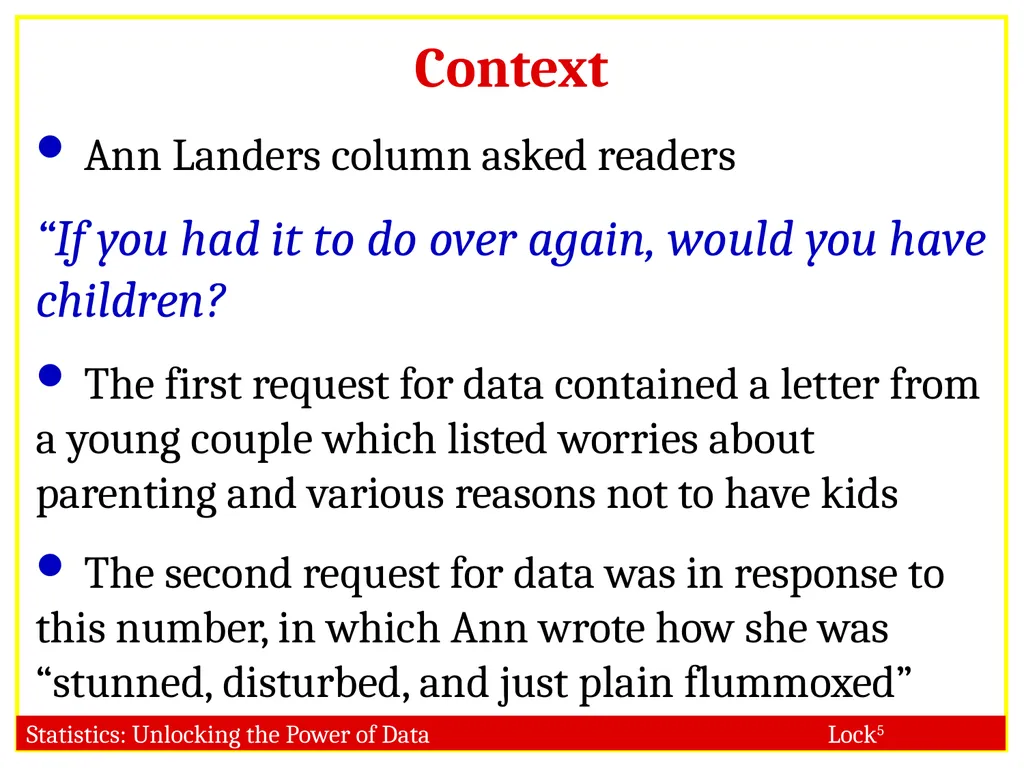
Context Ann Landers column asked readers
“If you had it to do over again, would you have children?
The first request for data contained a letter from a young couple which listed worries about parenting and various reasons not to have kids
The second request for data was in response to this number, in which Ann wrote how she was “stunned, disturbed, and just plain flummoxed”<br>
“If you had it to do over again, would you have children?
The first request for data contained a letter from a young couple which listed worries about parenting and various reasons not to have kids
The second request for data was in response to this number, in which Ann wrote how she was “stunned, disturbed, and just plain flummoxed”<br>
28
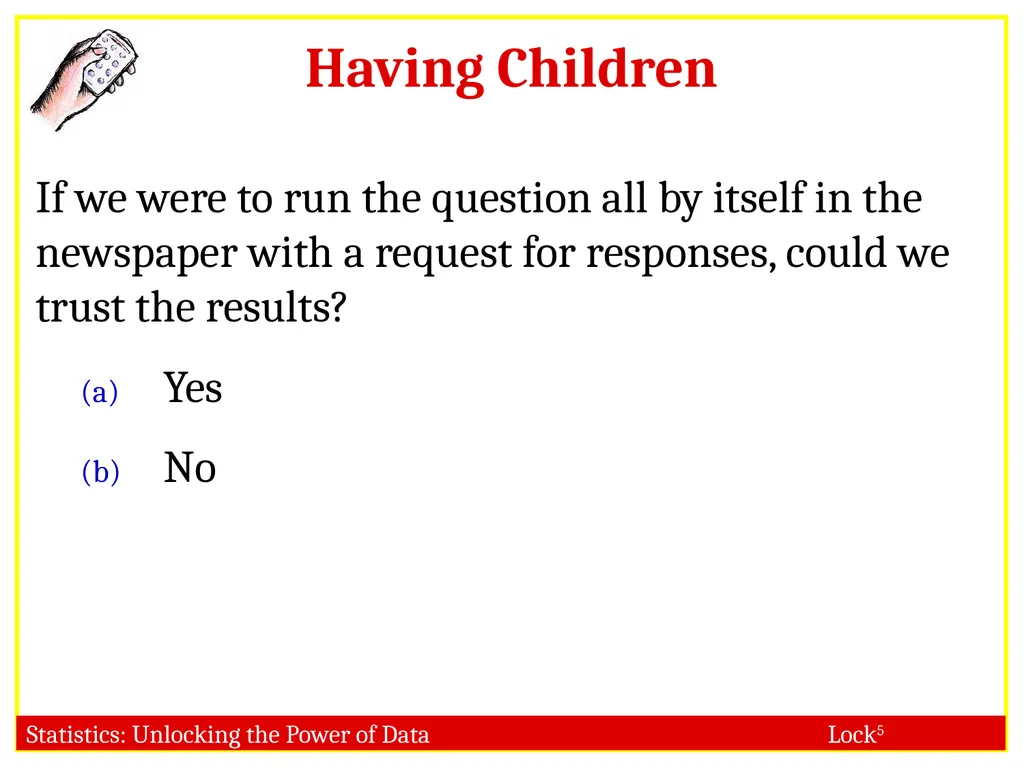
Having Children If we were to run the question all by itself in the newspaper with a request for responses, could we trust the results?
Yes
No<br>
Yes
No<br>
29
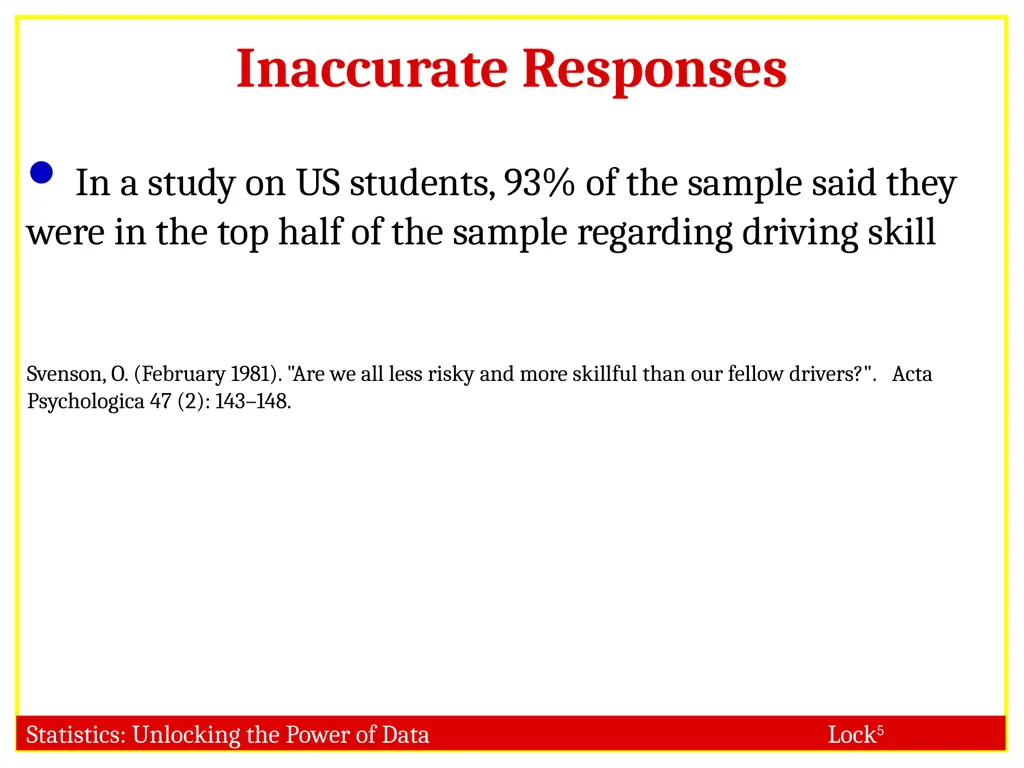
Inaccurate Responses In a study on US students, 93% of the sample said they were in the top half of the sample regarding driving skill
Svenson, O. (February 1981). "Are we all less risky and more skillful than our fellow drivers?". Acta Psychologica 47 (2): 143–148.<br>
Svenson, O. (February 1981). "Are we all less risky and more skillful than our fellow drivers?". Acta Psychologica 47 (2): 143–148.<br>
30
Summary Always think critically about how the data were collected, and recognize that not all forms of data collection lead to valid inferences This is the easiest way to instantly become a more statistically literate individual!<br>
31
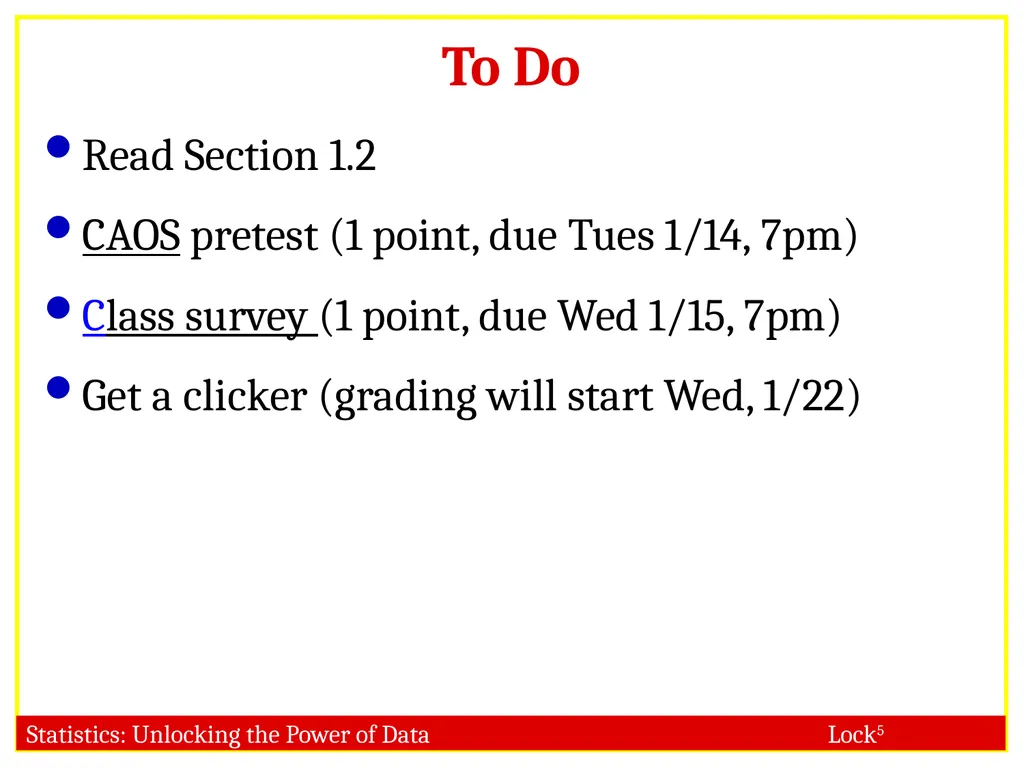
To Do Read Section 1.2
CAOS pretest (1 point, due Tues 1/14, 7pm)
Class survey (1 point, due Wed 1/15, 7pm)
Get a clicker (grading will start Wed, 1/22)<br>
CAOS pretest (1 point, due Tues 1/14, 7pm)
Class survey (1 point, due Wed 1/15, 7pm)
Get a clicker (grading will start Wed, 1/22)<br>