Study Recommendations: District Size Adjustment Amanda Brown and Justin Silverstein, APA Presentation Overview Review recommended district size adjustment from study Provide additional analysis of recommended size adjustments Committee
"Study Recommendations: District Size Adjustment" is the property of its rightful owner. Permission is granted to
download and print the materials on this website for personal, non-commercial use only, and to display it
on your personal computer provided you do not modify the materials and that you retain all copyright
notices contained in the materials. By downloading content from our website, you accept the terms of this
agreement.
Presentation Transcript
01
Study Recommendations: District Size Adjustment Amanda Brown and Justin Silverstein, APA<br>
02
Presentation Overview Review recommended district size adjustment from study
Provide additional analysis of recommended size adjustments
Committee considerations, including review of future stakeholder feedback areas 2<br>
03
District Size Adjustment from Study Chart The study team recommended that a new funding formula include a district size adjustment to account for different economies of scale in districts.
The study team developed a size adjustment factor based upon:
Results of the current study and 2006 adequacy study, combined with school finance research presented in the 2012 AIR report.
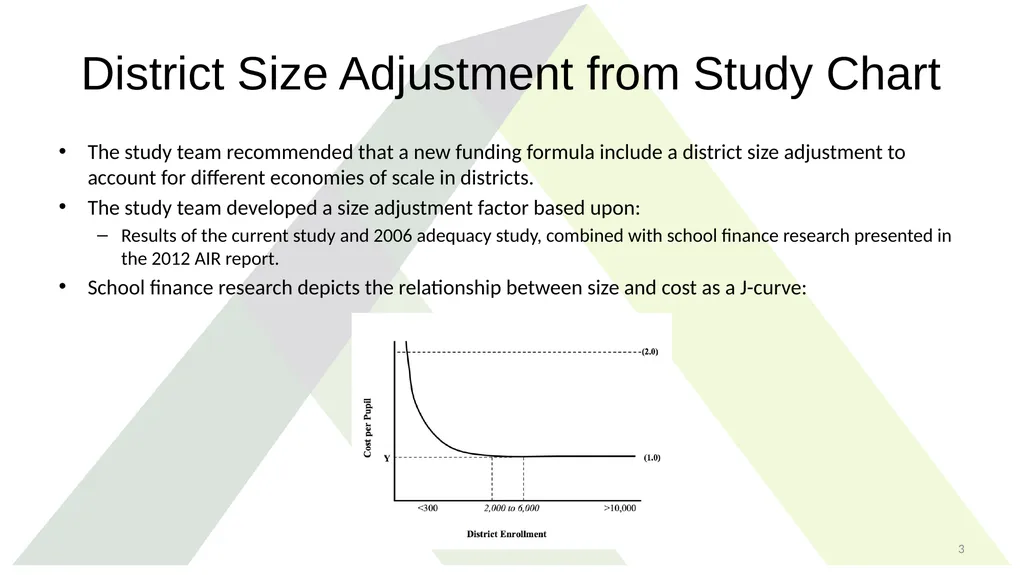
School finance research depicts the relationship between size and cost as a J-curve: 3<br>
04
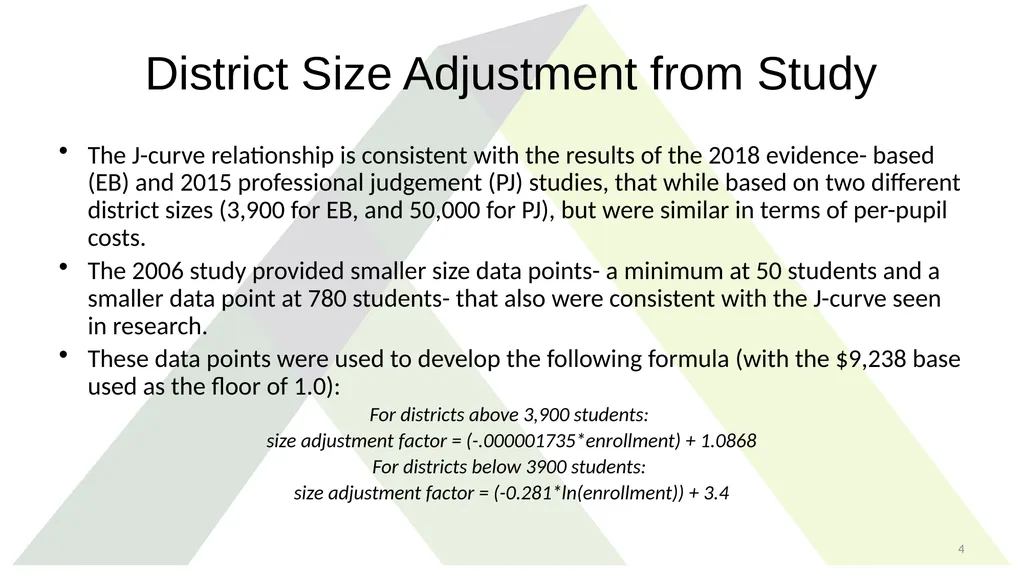
District Size Adjustment from Study The J-curve relationship is consistent with the results of the 2018 evidence- based (EB) and 2015 professional judgement (PJ) studies, that while based on two different district sizes (3,900 for EB, and 50,000 for PJ), but were similar in terms of per-pupil costs.
The 2006 study provided smaller size data points- a minimum at 50 students and a smaller data point at 780 students- that also were consistent with the J-curve seen in research.
These data points were used to develop the following formula (with the $9,238 base used as the floor of 1.0):
For districts above 3,900 students:
size adjustment factor = (-.000001735*enrollment) + 1.0868
For districts below 3900 students:
size adjustment factor = (-0.281*ln(enrollment)) + 3.4 4<br>
05
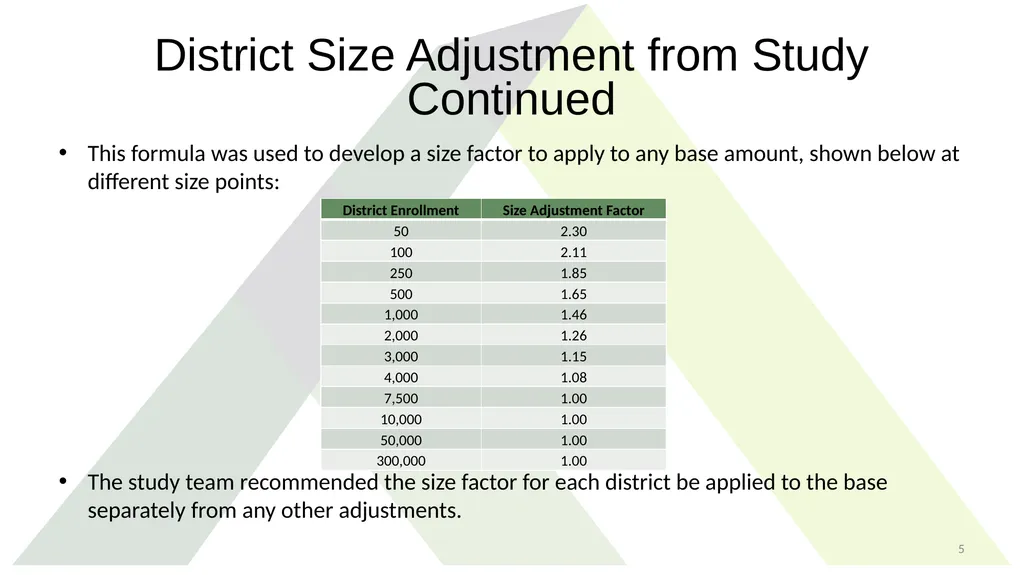
District Size Adjustment from Study Continued This formula was used to develop a size factor to apply to any base amount, shown below at different size points:
The study team recommended the size factor for each district be applied to the base separately from any other adjustments. 5<br>
06
Additional Analysis on District Size Adjustment To support the Commission in determining if the recommended district size adjustment was the best fit for Nevada, APA was asked to provide additional information and analysis.
APA reviewed size adjustment policies nationally
Compared the study’s recommended size adjustment against:
Nevada’s current approach (District Groupings/Basic Support Ratios)
Current district expenditures
Size adjustments in two other states, Colorado and Kansas
States with size adjustments and rural/urban variation 6<br>
07
Size Adjustments in Other States States often address district differences based upon district or school size, and isolation or density.
9 states adjust for district size
7 states adjust for school size
4 states adjust for district density (students per square mile)
14 states adjust for isolated schools (based upon distance from next nearest school, travel time or other travel related issues like road safety conditions) 7<br>
08
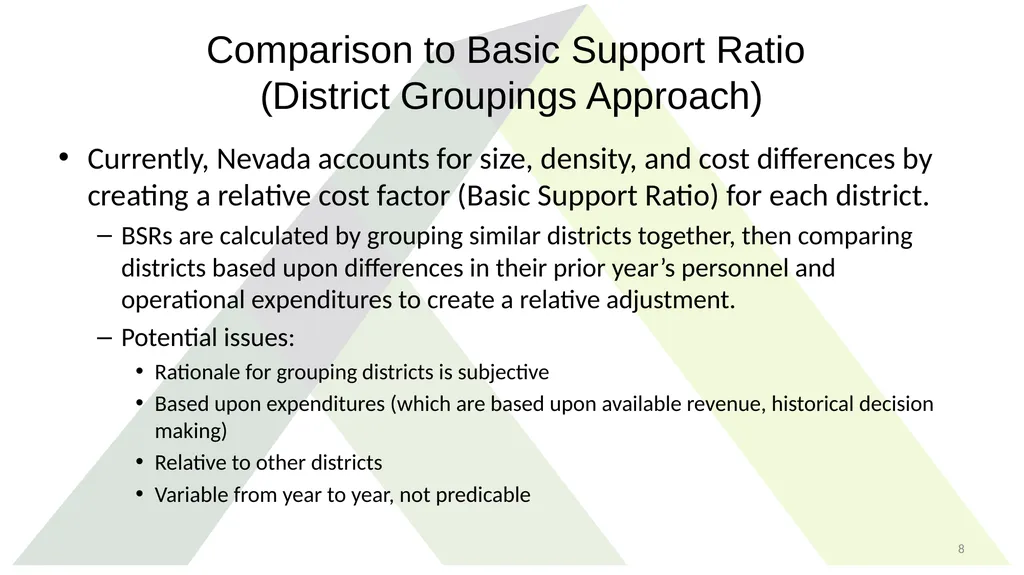
Comparison to Basic Support Ratio (District Groupings Approach) Currently, Nevada accounts for size, density, and cost differences by creating a relative cost factor (Basic Support Ratio) for each district.
BSRs are calculated by grouping similar districts together, then comparing districts based upon differences in their prior year’s personnel and operational expenditures to create a relative adjustment.
Potential issues:
Rationale for grouping districts is subjective
Based upon expenditures (which are based upon available revenue, historical decision making)
Relative to other districts
Variable from year to year, not predicable 8<br>
09
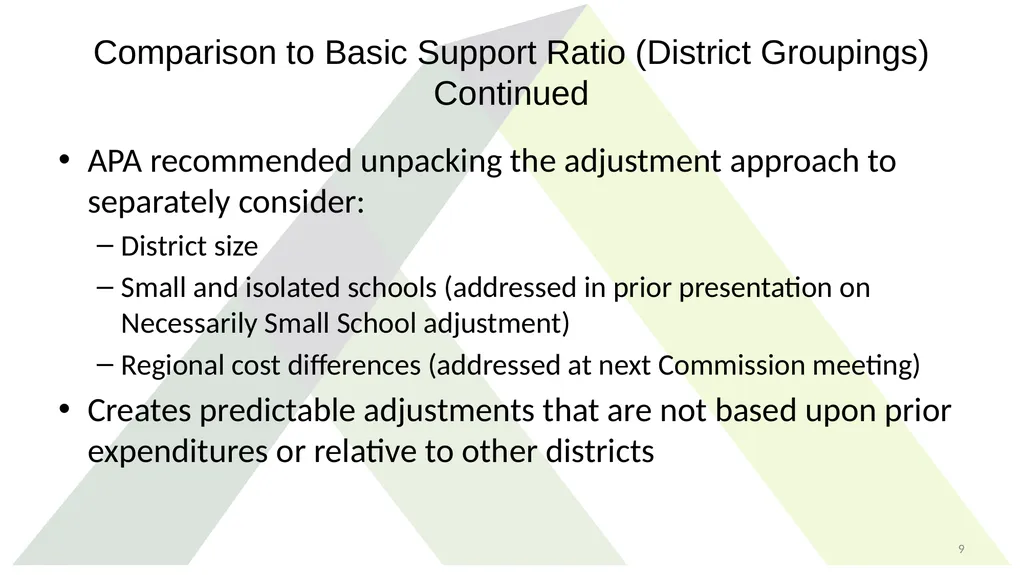
Comparison to Basic Support Ratio (District Groupings) Continued APA recommended unpacking the adjustment approach to separately consider:
District size
Small and isolated schools (addressed in prior presentation on Necessarily Small School adjustment)
Regional cost differences (addressed at next Commission meeting)
Creates predictable adjustments that are not based upon prior expenditures or relative to other districts 9<br>
10
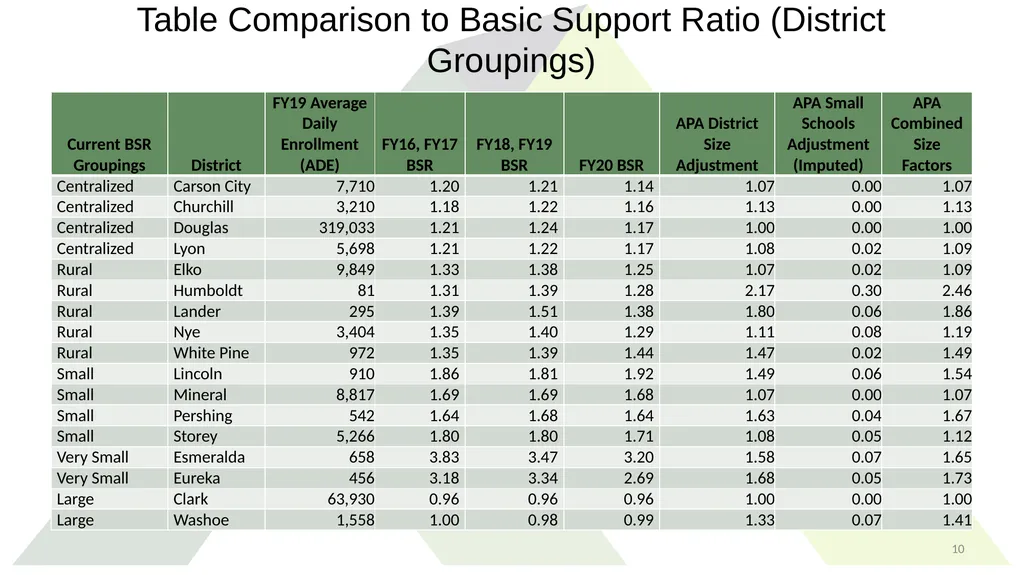
Table Comparison to Basic Support Ratio (District Groupings) 10<br>
11
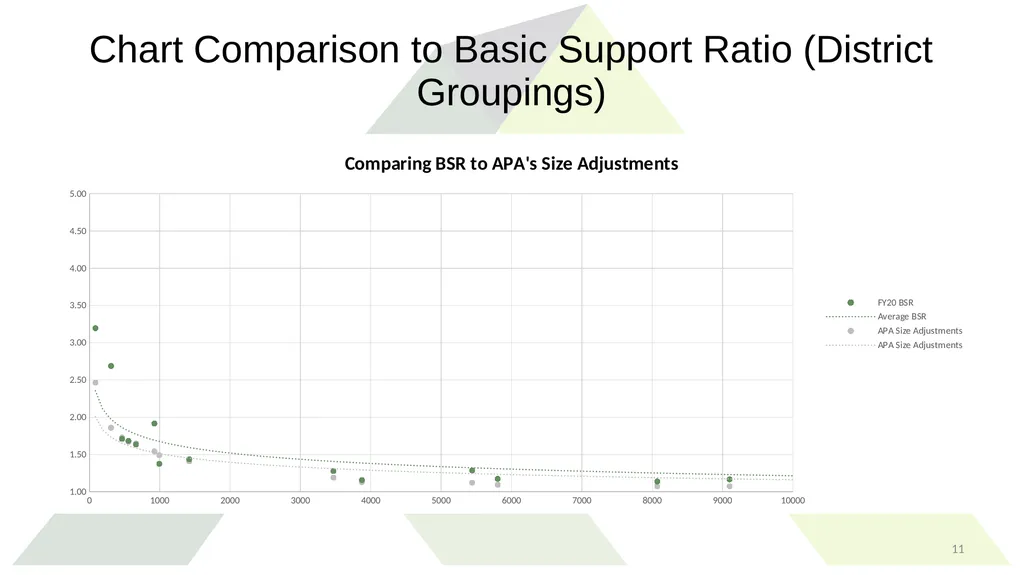
Chart Comparison to Basic Support Ratio (District Groupings) 11<br>
12
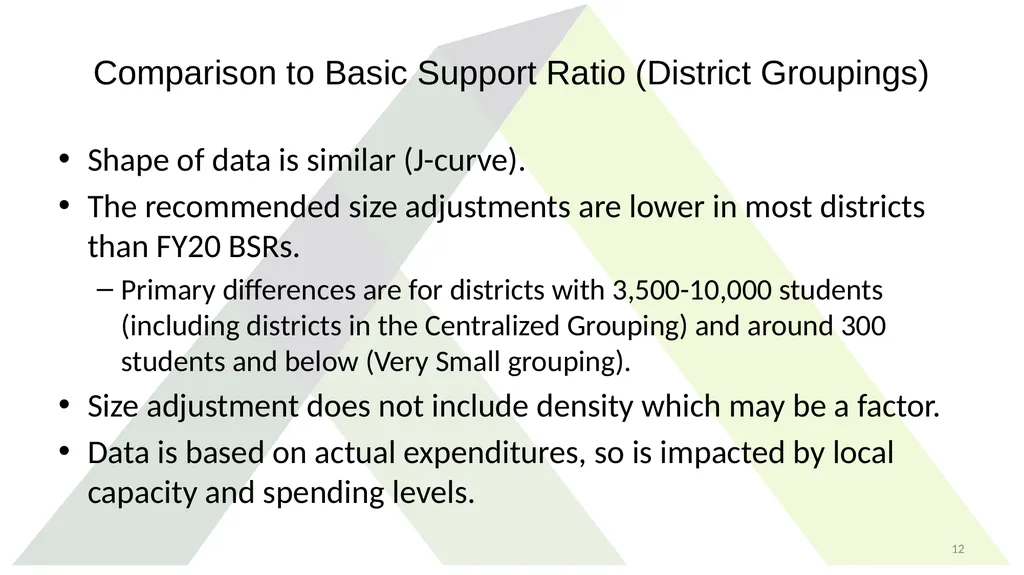
Comparison to Basic Support Ratio (District Groupings) Shape of data is similar (J-curve).
The recommended size adjustments are lower in most districts than FY20 BSRs.
Primary differences are for districts with 3,500-10,000 students (including districts in the Centralized Grouping) and around 300 students and below (Very Small grouping).
Size adjustment does not include density which may be a factor.
Data is based on actual expenditures, so is impacted by local capacity and spending levels. 12<br>
13
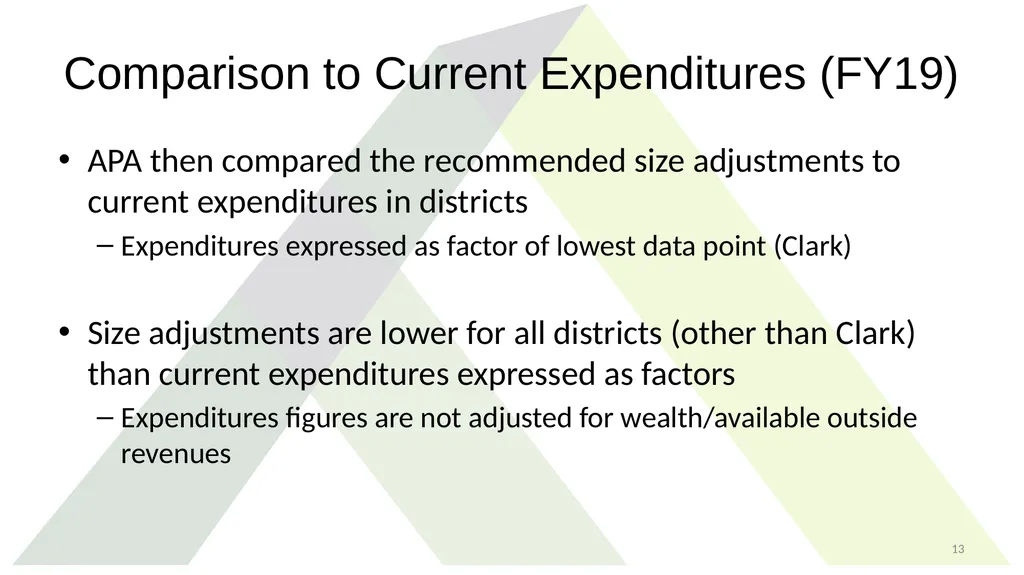
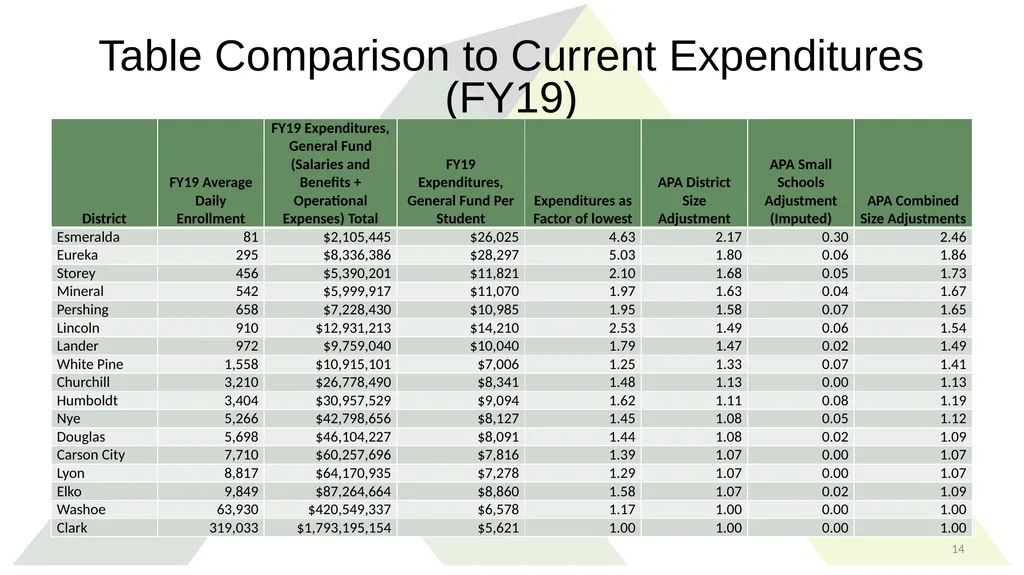
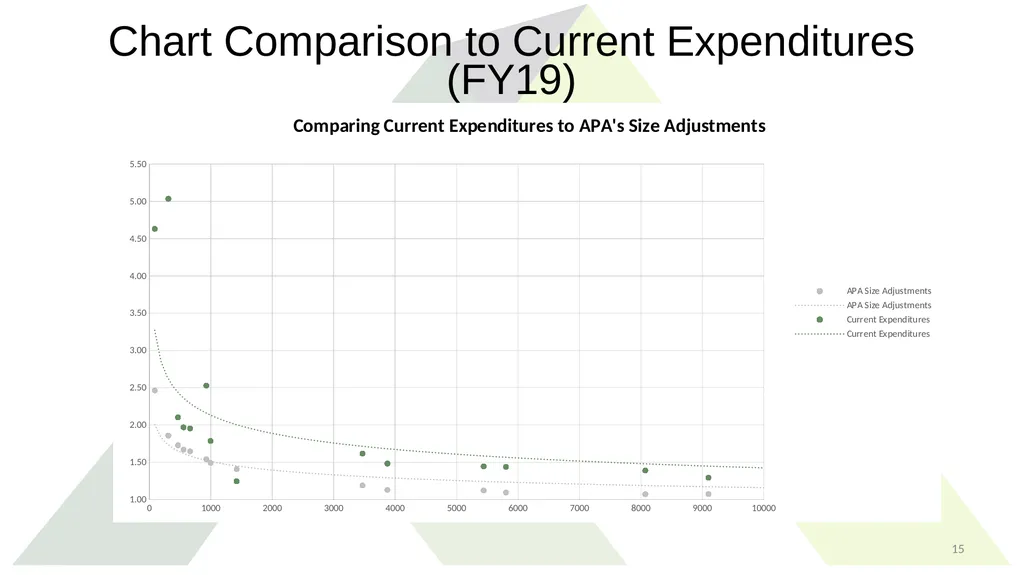
Comparison to Current Expenditures (FY19) APA then compared the recommended size adjustments to current expenditures in districts
Expenditures expressed as factor of lowest data point (Clark)
Size adjustments are lower for all districts (other than Clark) than current expenditures expressed as factors
Expenditures figures are not adjusted for wealth/available outside revenues 13<br>
14
Table Comparison to Current Expenditures (FY19) 14<br>
15
Chart Comparison to Current Expenditures (FY19) 15<br>
16
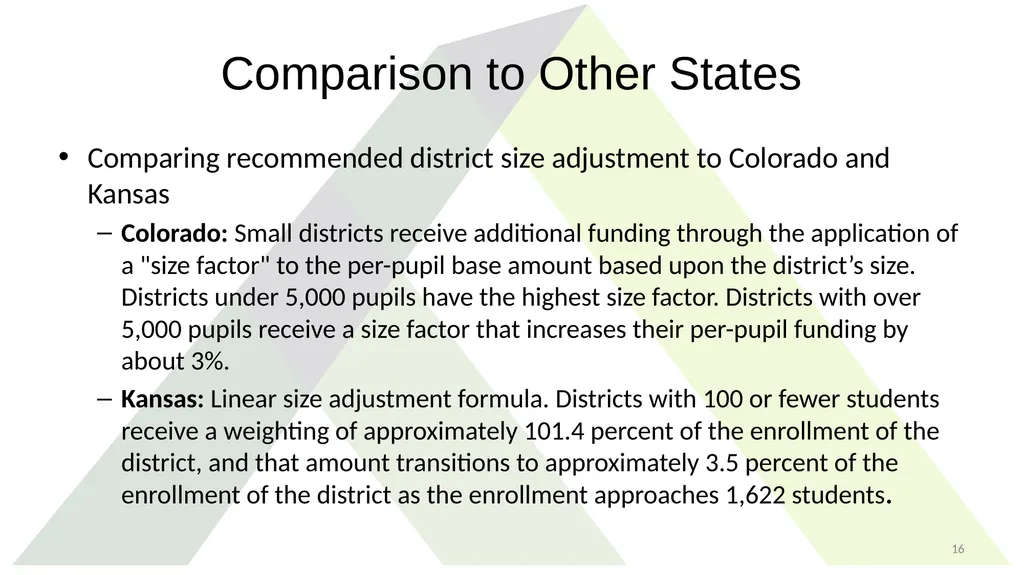
Comparison to Other States Comparing recommended district size adjustment to Colorado and Kansas
Colorado: Small districts receive additional funding through the application of a "size factor" to the per-pupil base amount based upon the district’s size. Districts under 5,000 pupils have the highest size factor. Districts with over 5,000 pupils receive a size factor that increases their per-pupil funding by about 3%.
Kansas: Linear size adjustment formula. Districts with 100 or fewer students receive a weighting of approximately 101.4 percent of the enrollment of the district, and that amount transitions to approximately 3.5 percent of the enrollment of the district as the enrollment approaches 1,622 students. 16<br>
17
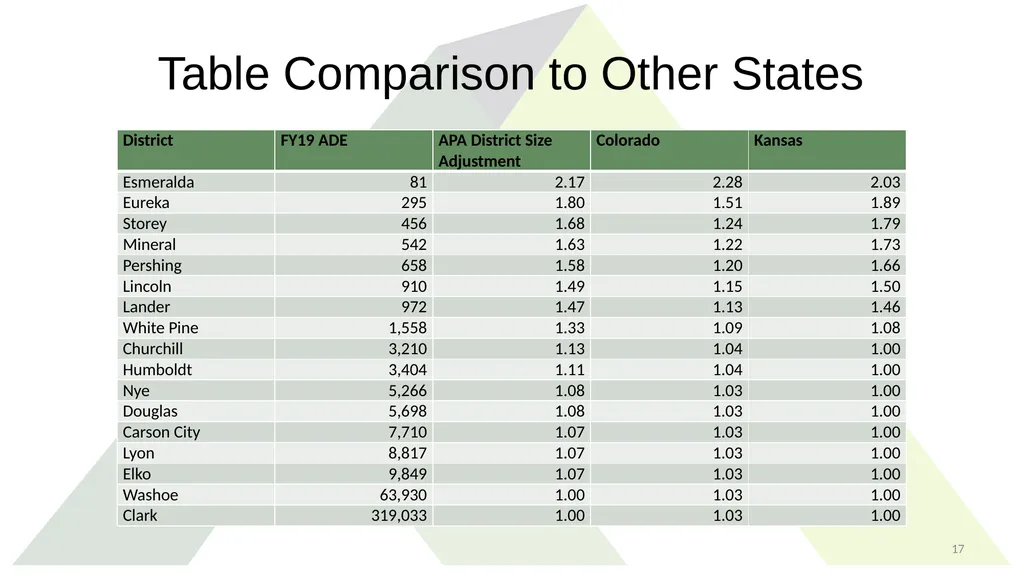
Table Comparison to Other States 17<br>
18
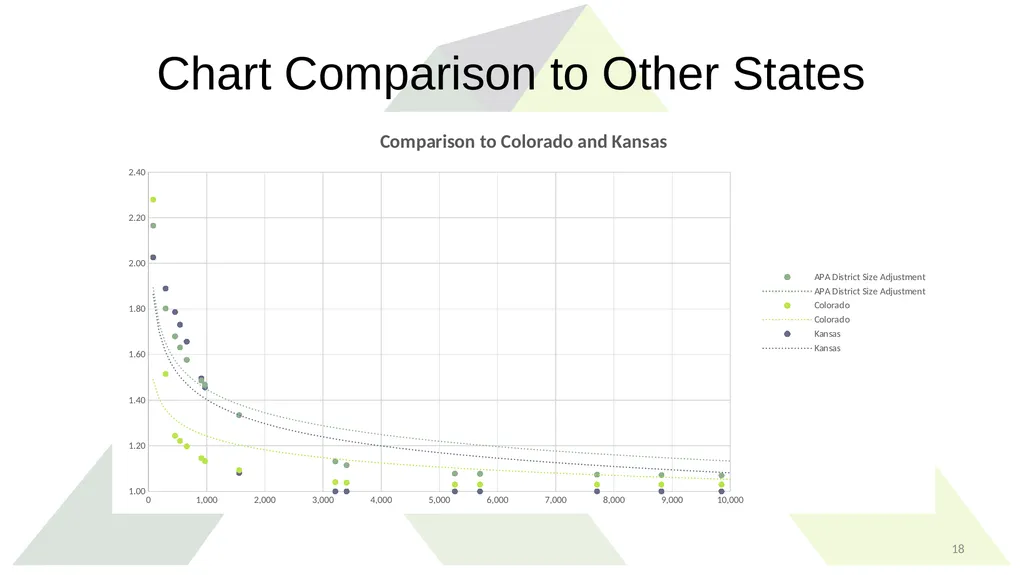
Chart Comparison to Other States 18<br>
19
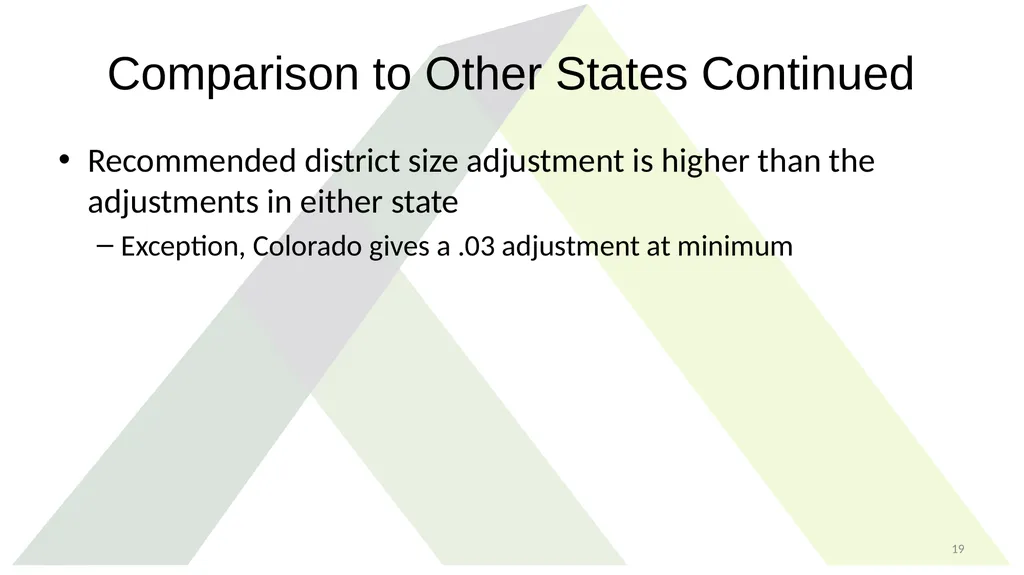
Comparison to Other States Continued Recommended district size adjustment is higher than the adjustments in either state
Exception, Colorado gives a .03 adjustment at minimum 19<br>
20
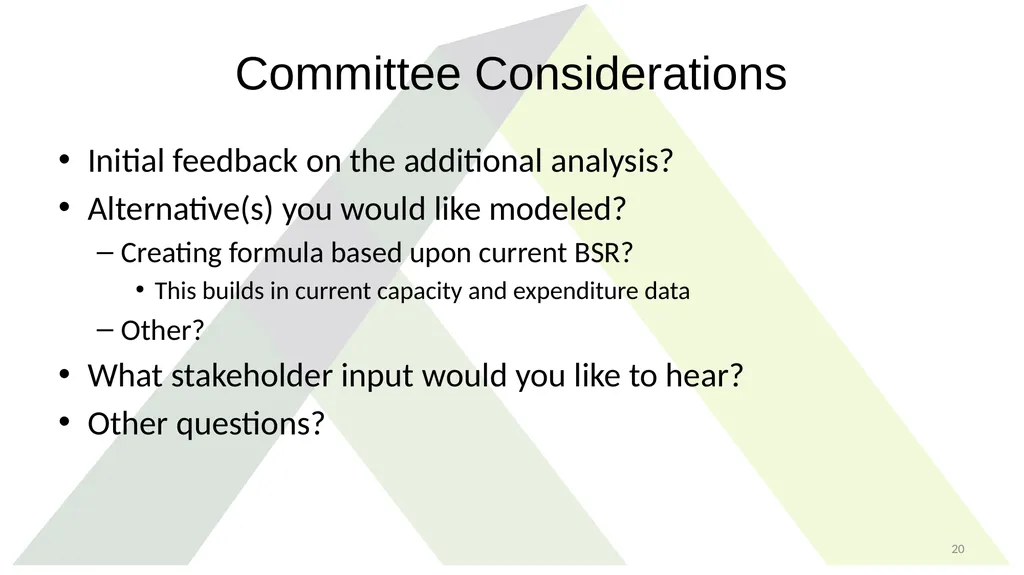
Committee Considerations Initial feedback on the additional analysis?
Alternative(s) you would like modeled?
Creating formula based upon current BSR?
This builds in current capacity and expenditure data
Other?
What stakeholder input would you like to hear?
Other questions? 20<br>
21
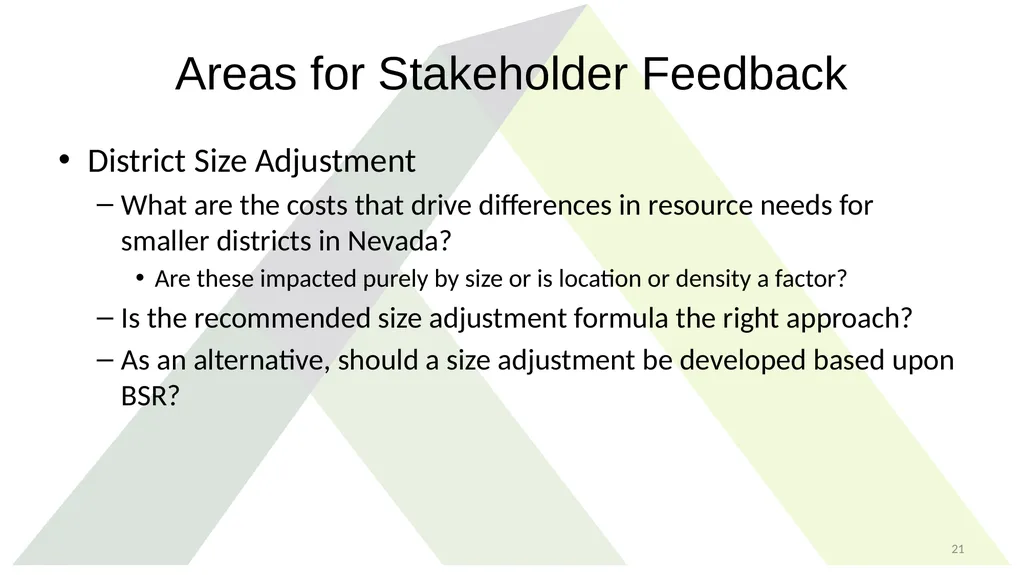
Areas for Stakeholder Feedback District Size Adjustment
What are the costs that drive differences in resource needs for smaller districts in Nevada?
Are these impacted purely by size or is location or density a factor?
Is the recommended size adjustment formula the right approach?
As an alternative, should a size adjustment be developed based upon BSR? 21<br>