04
INTRODUCTION :- You might have seen in books, news paper etc graphs are used to give some valuable information like people living under poverty line in different states, number of uneducated people in a particular state, number of unemployed in India etc. To prepare graph information , observations are made. Observations are written in numeral form called data. Further data is arranged in many ways in order to easily extract the information contained by it. In this chapter we will study about the data and analysis of data with the help of graph.<br>
05
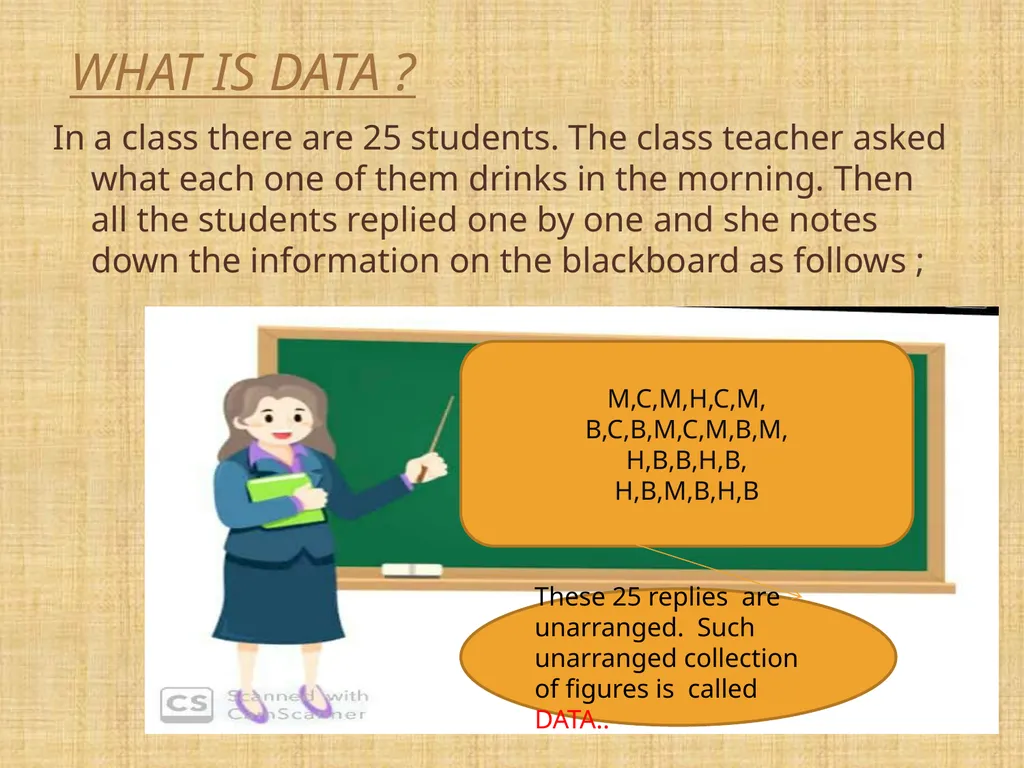
What is DATA ? In a class there are 25 students. The class teacher asked what each one of them drinks in the morning. Then all the students replied one by one and she notes down the information on the blackboard as follows ; M,C,M,H,C,M,
B,C,B,M,C,M,B,M,
H,B,B,H,B,
H,B,M,B,H,B These 25 replies are unarranged. Such unarranged collection of figures is called DATA..<br>
06
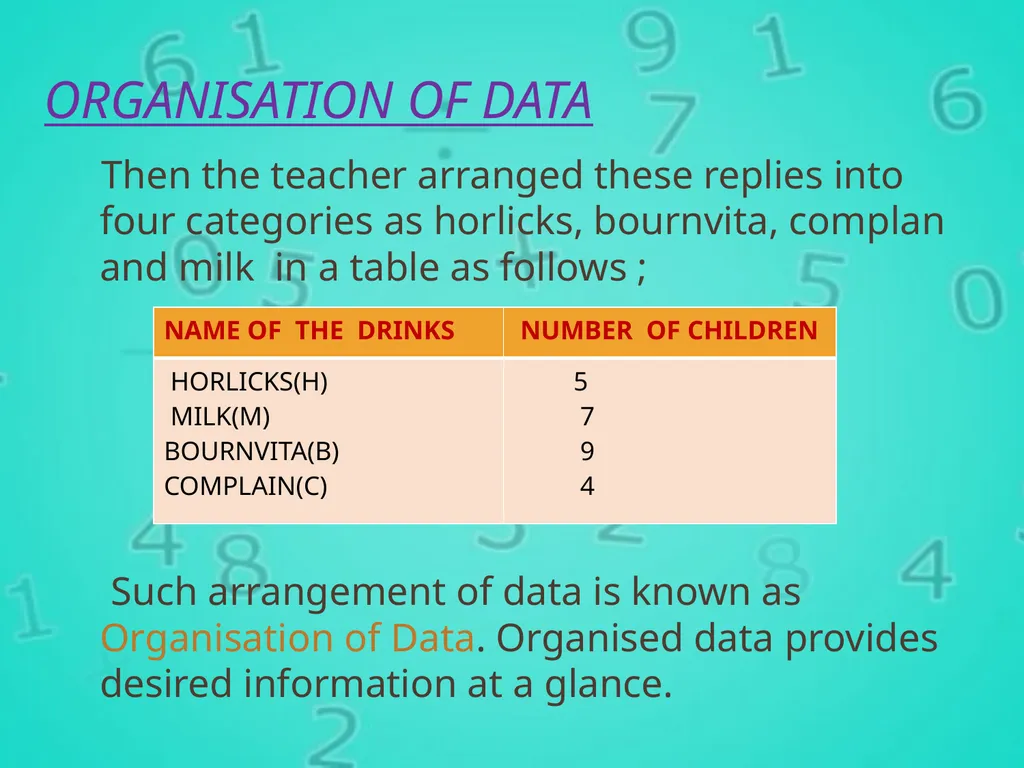
ORGANISATION OF DATA Then the teacher arranged these replies into four categories as horlicks, bournvita, complan and milk in a table as follows ;
Such arrangement of data is known as Organisation of Data. Organised data provides desired information at a glance.<br>
07
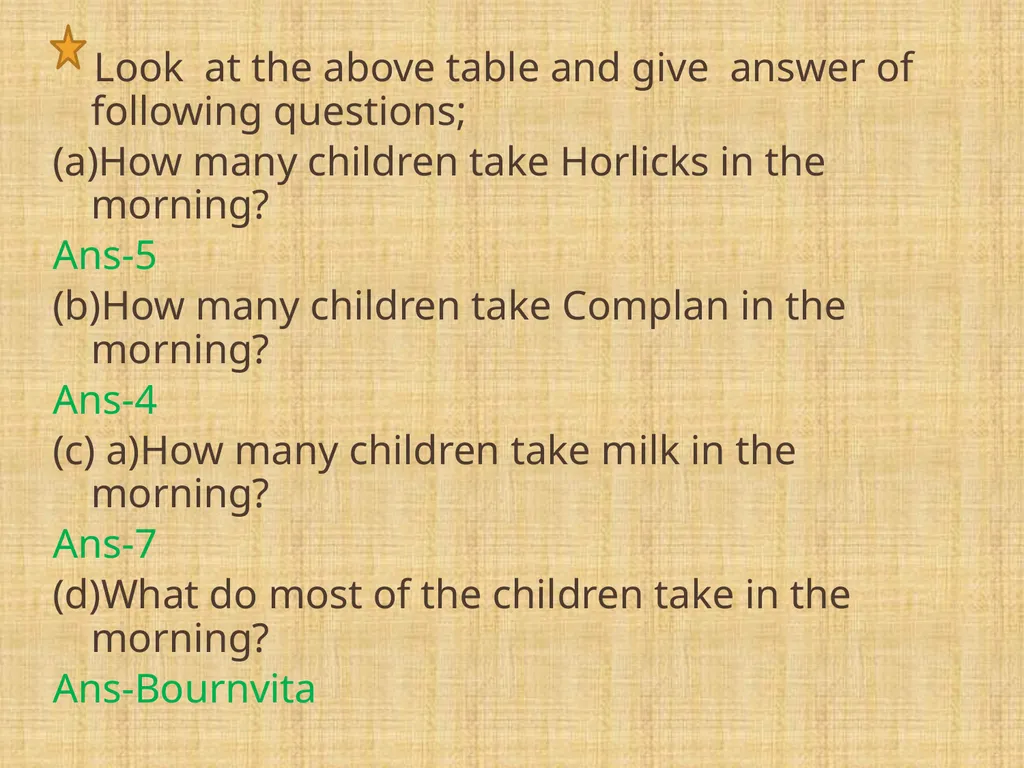
Look at the above table and give answer of following questions;
(a)How many children take Horlicks in the morning?
Ans-5
(b)How many children take Complan in the morning?
Ans-4
(c) a)How many children take milk in the morning?
Ans-7
(d)What do most of the children take in the morning?
Ans-Bournvita<br>
08
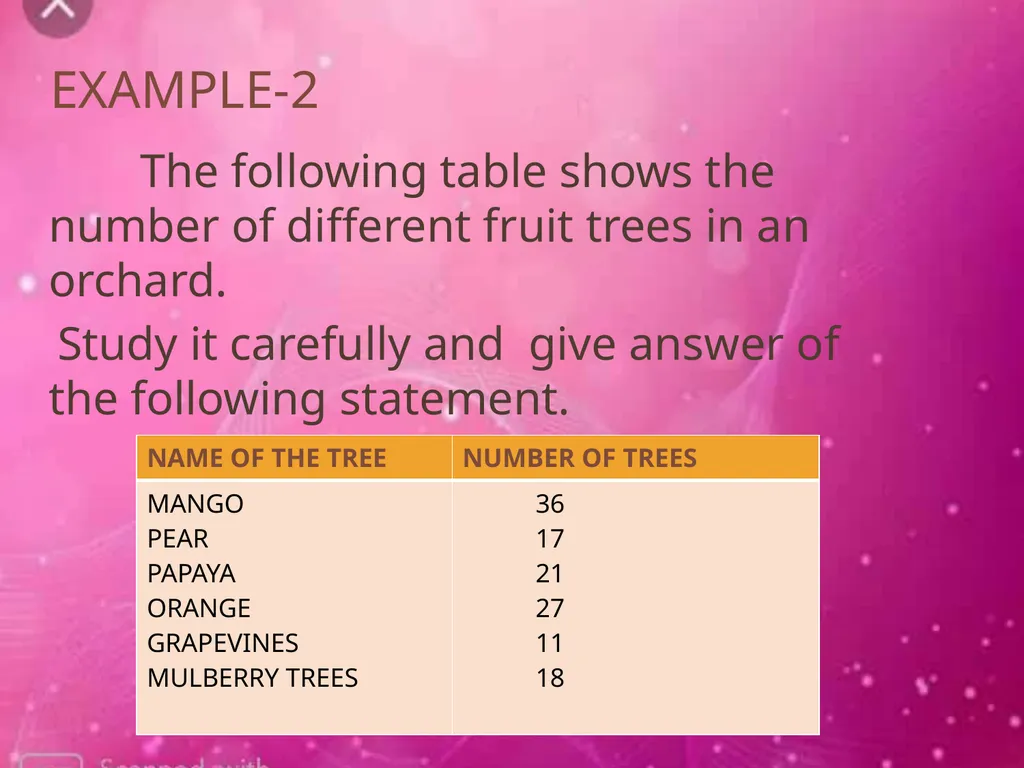
Example-2 The following table shows the number of different fruit trees in an orchard.
Study it carefully and give answer of the following statement.<br>
09
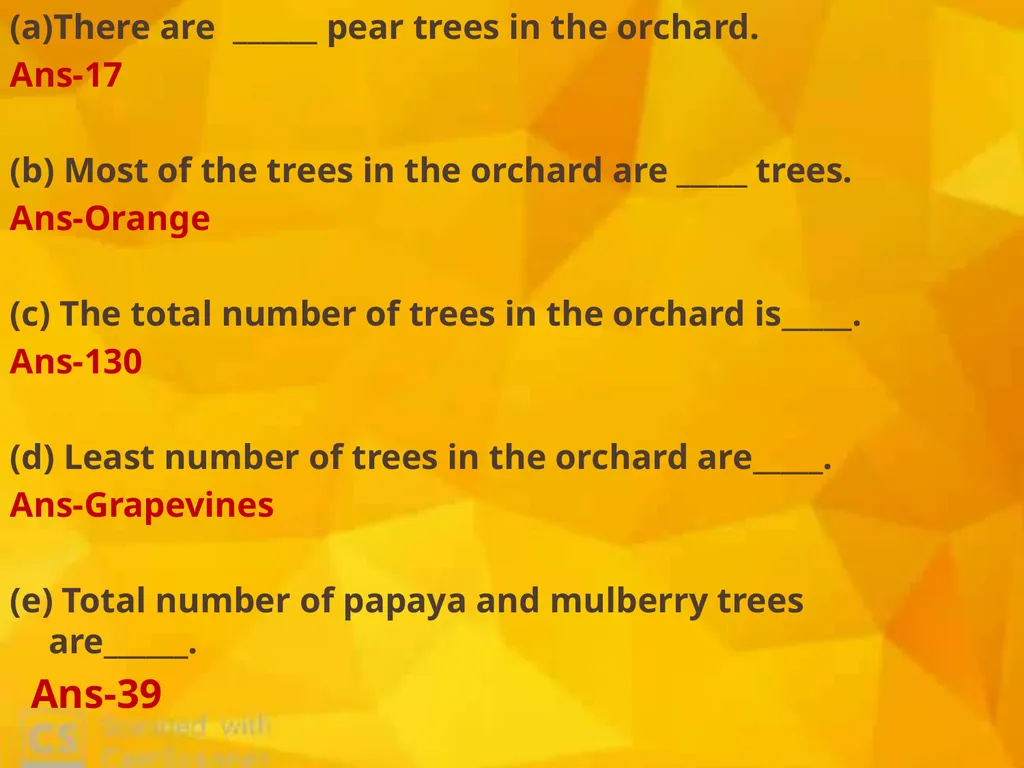
(a)There are ______ pear trees in the orchard.
Ans-17
(b) Most of the trees in the orchard are _____ trees.
Ans-Orange
(c) The total number of trees in the orchard is_____.
Ans-130
(d) Least number of trees in the orchard are_____.
Ans-Grapevines
(e) Total number of papaya and mulberry trees are______.
Ans-39<br>
10
What is Data Handling Data handling is the way in which Data can be represented graphically to give a clear idea of what it represents.
It is easier to interpret and organize data using pictorial representation.
Data handling includes bar graph ,pictograph , and tally marks. What is Data Handling<br>
11
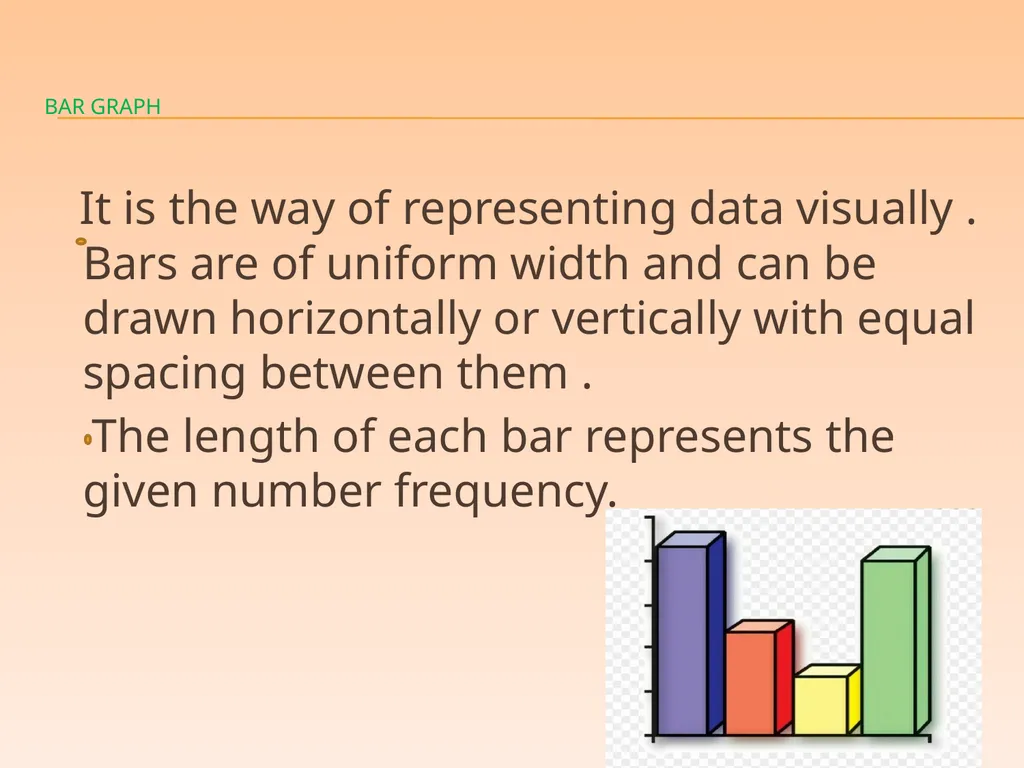
Bar Graph It is the way of representing data visually . Bars are of uniform width and can be drawn horizontally or vertically with equal spacing between them .
The length of each bar represents the given number frequency.<br>
12
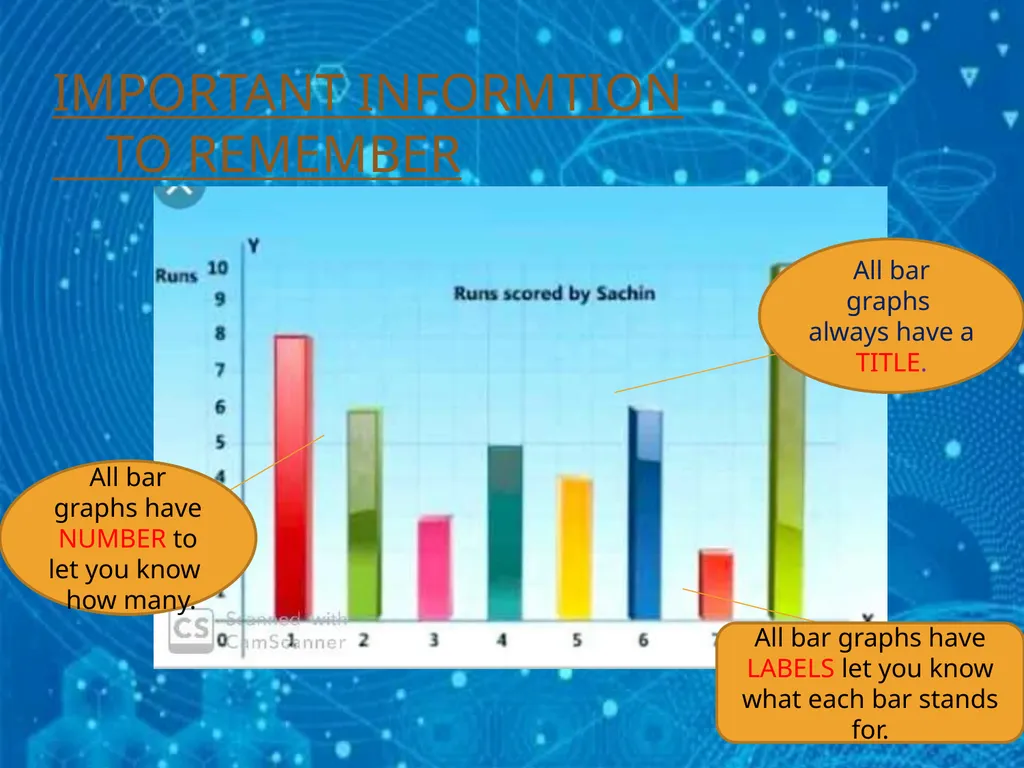
Important Informtion� To Remember All bar graphs always have a TITLE. All bar graphs have LABELS let you know what each bar stands for. All bar graphs have NUMBER to let you know how many.<br>
13
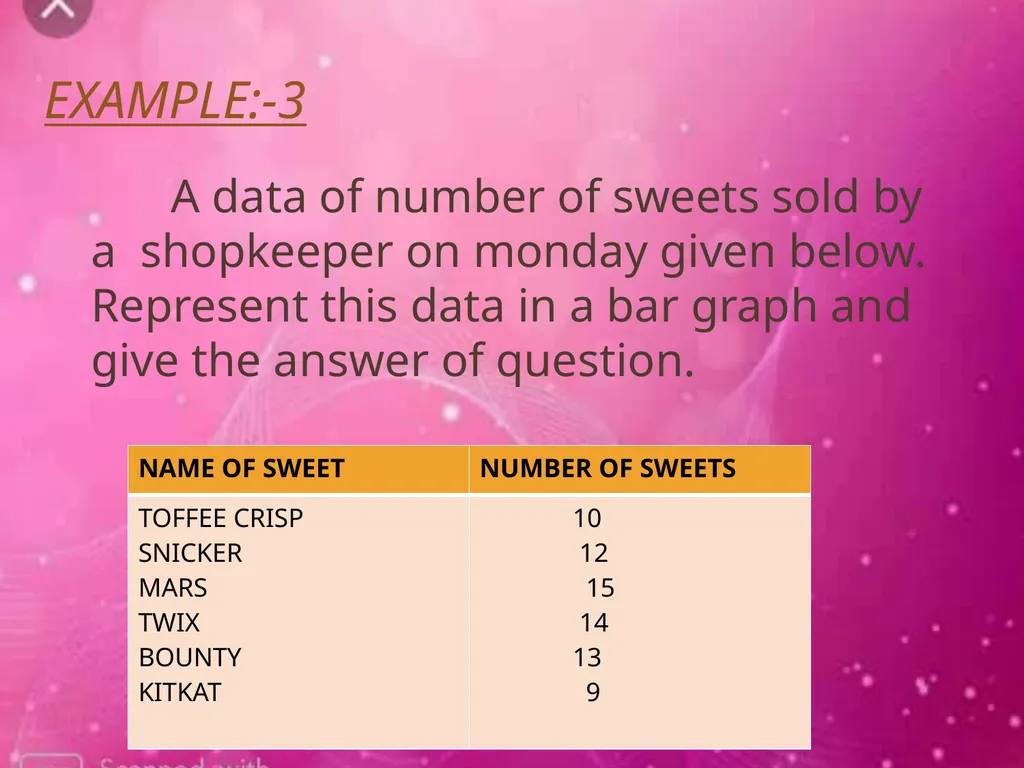
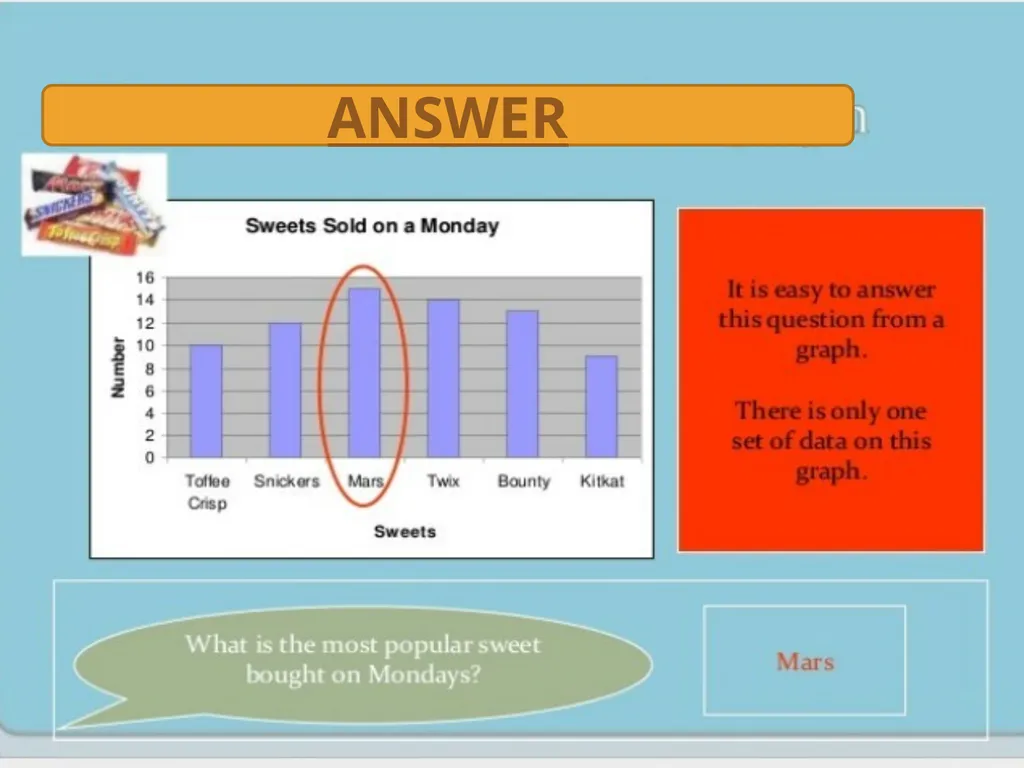
Example:-3 A data of number of sweets sold by a shopkeeper on monday given below. Represent this data in a bar graph and give the answer of question.<br>
15
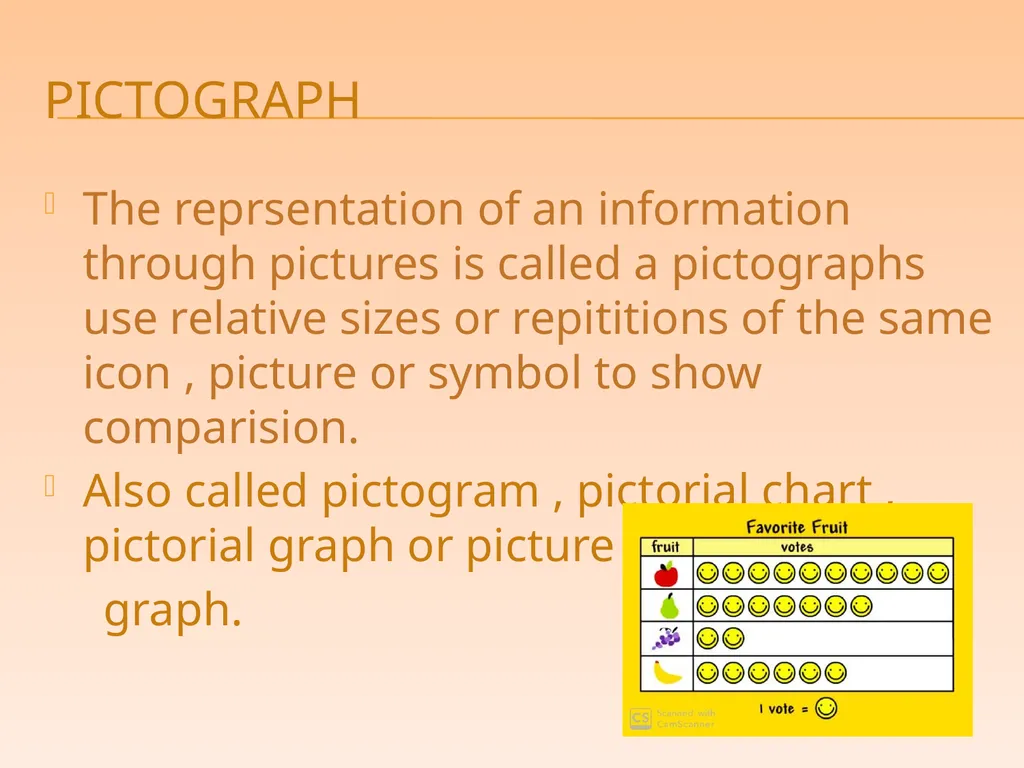
Pictograph The reprsentation of an information through pictures is called a pictographs use relative sizes or repititions of the same icon , picture or symbol to show comparision.
Also called pictogram , pictorial chart , pictorial graph or picture
graph.<br>
16
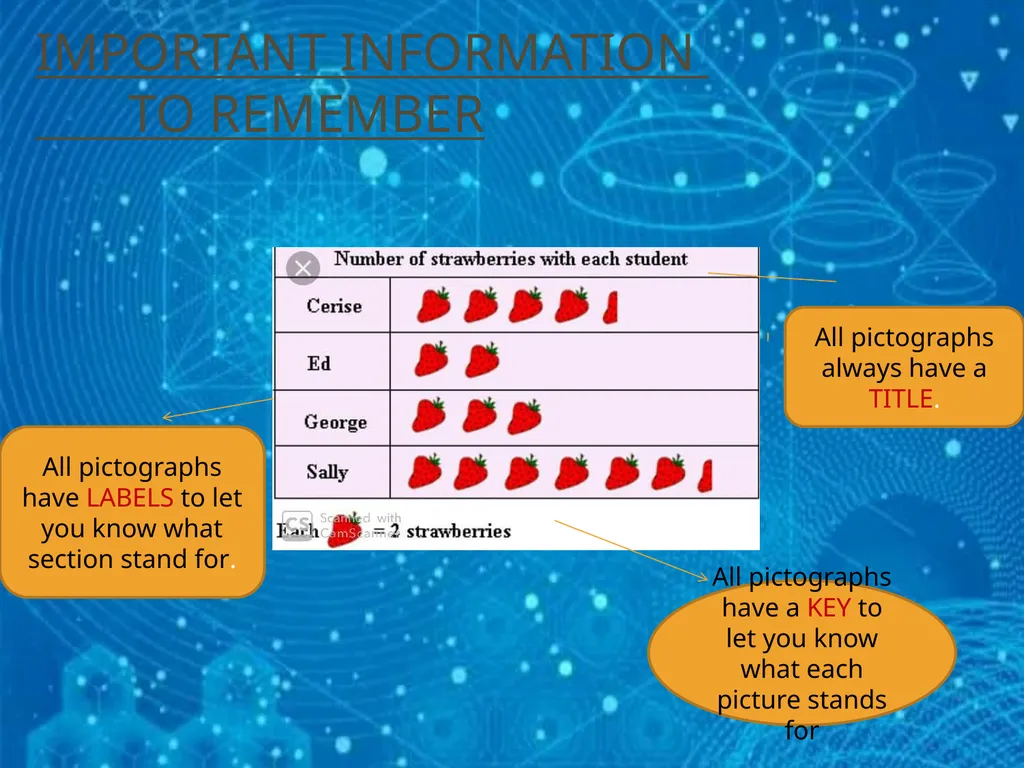
Important Information � To Remember All pictographs always have a TITLE. All pictographs have a KEY to let you know what each picture stands for All pictographs have LABELS to let you know what section stand for.<br>
17
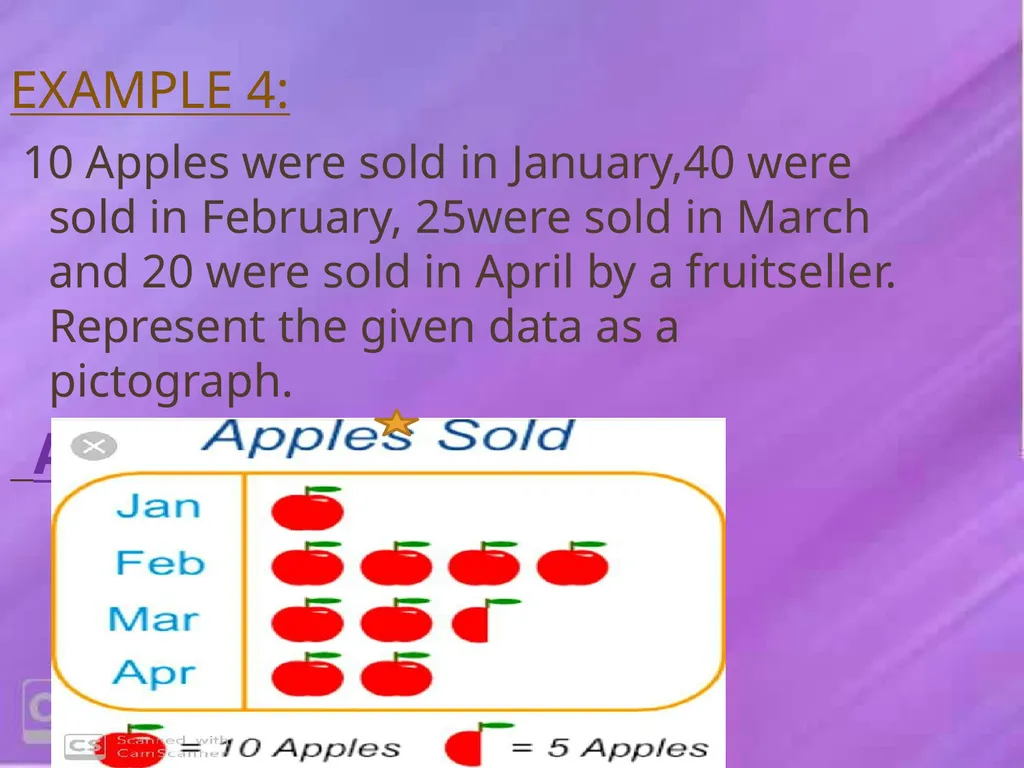
Example 4: 10 Apples were sold in January,40 were sold in February, 25were sold in March and 20 were sold in April by a fruitseller. Represent the given data as a pictograph.
Answer-<br>
18
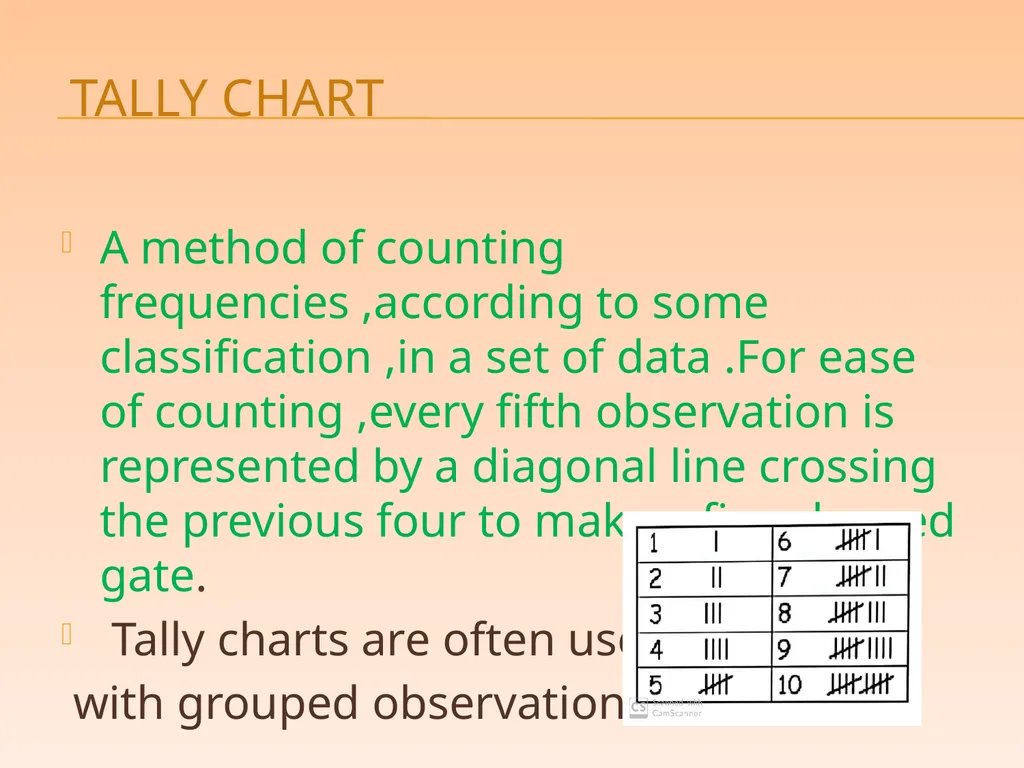
Tally Chart A method of counting frequencies ,according to some classification ,in a set of data .For ease of counting ,every fifth observation is represented by a diagonal line crossing the previous four to make a five –barred gate.
Tally charts are often used
with grouped observations.<br>
19
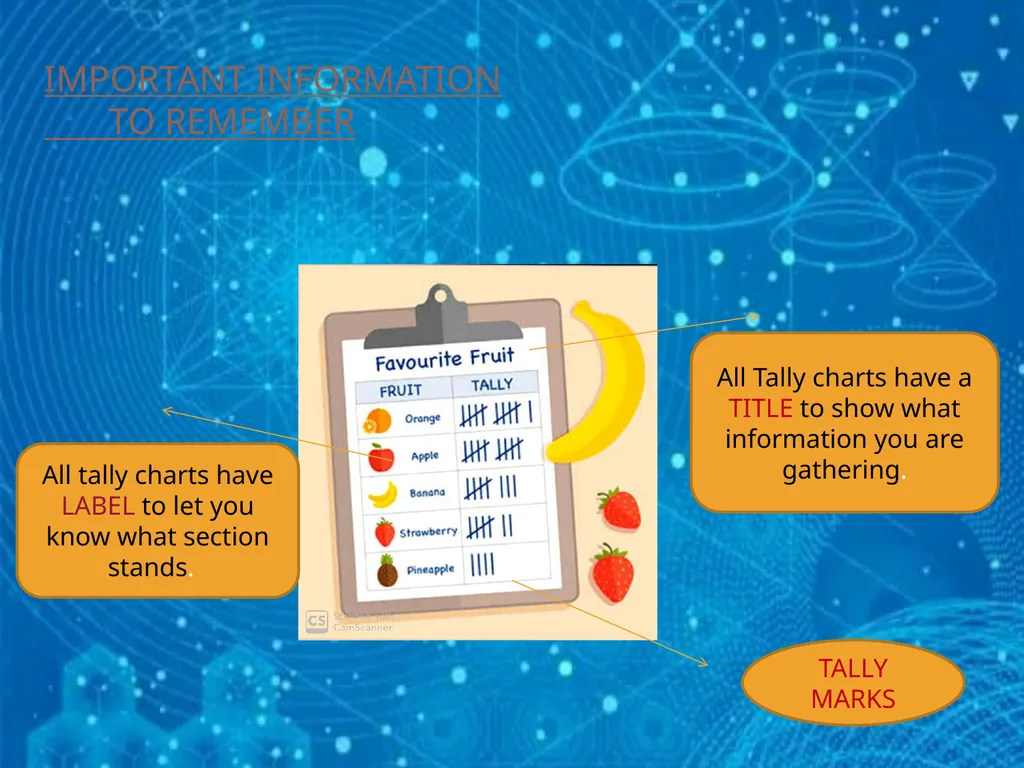
Important Information� To Remember All Tally charts have a TITLE to show what information you are gathering. All tally charts have LABEL to let you know what section stands. TALLY MARKS<br>
20
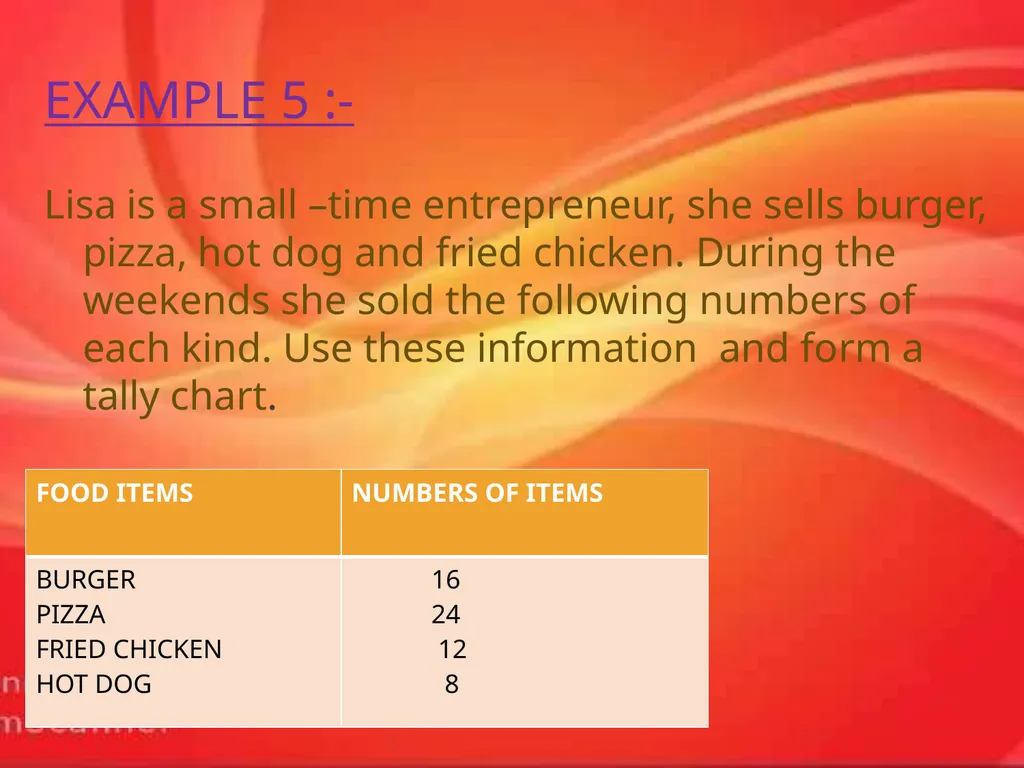
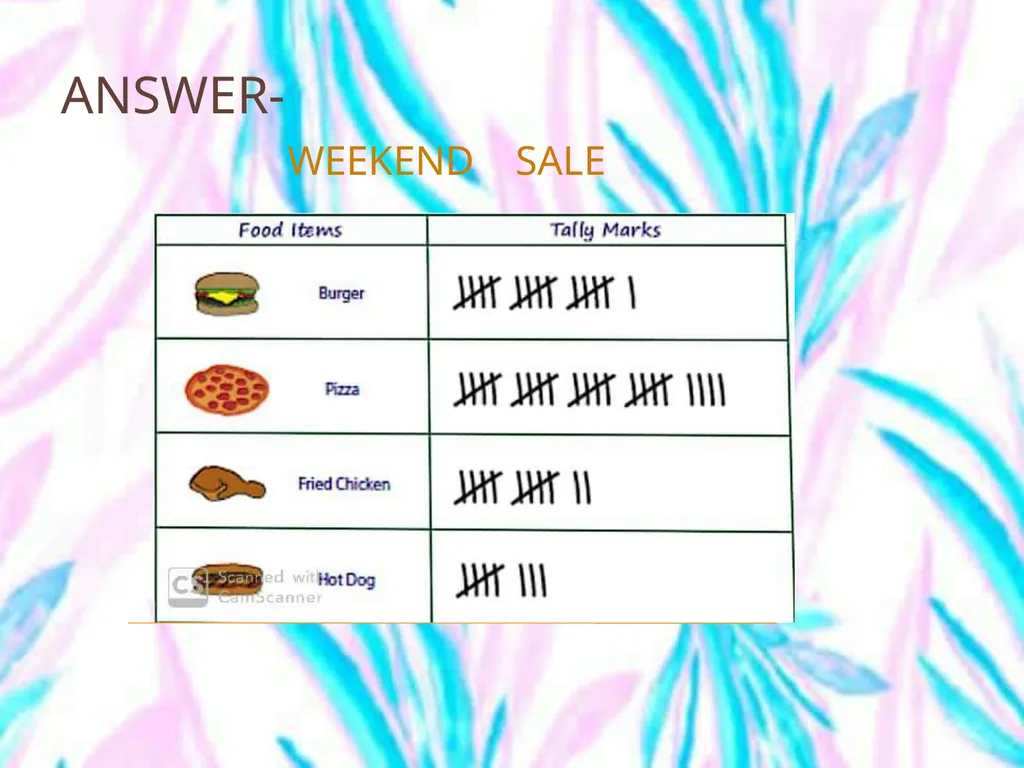
EXAMPLE 5 :- Lisa is a small –time entrepreneur, she sells burger, pizza, hot dog and fried chicken. During the weekends she sold the following numbers of each kind. Use these information and form a tally chart.<br>
21
ANSWER-� WEEKEND SALE<br>
22
ACTIVITY Make a collection of bar charts published in news papers, magarzines etc.
Write in few lines what the bar chart is about and whatever information you can make out of it.<br>
23
PROJECT WORK Draw a pictograph for the weight of different students.
Collect the data and represent it using bar charts.
You may use the following ideas :
(a)Shoe size of members of your class
(b)Age of all your cousins.
(c)Heights of your classmates
(d)Weight of 20 people living in your locality.<br>
24
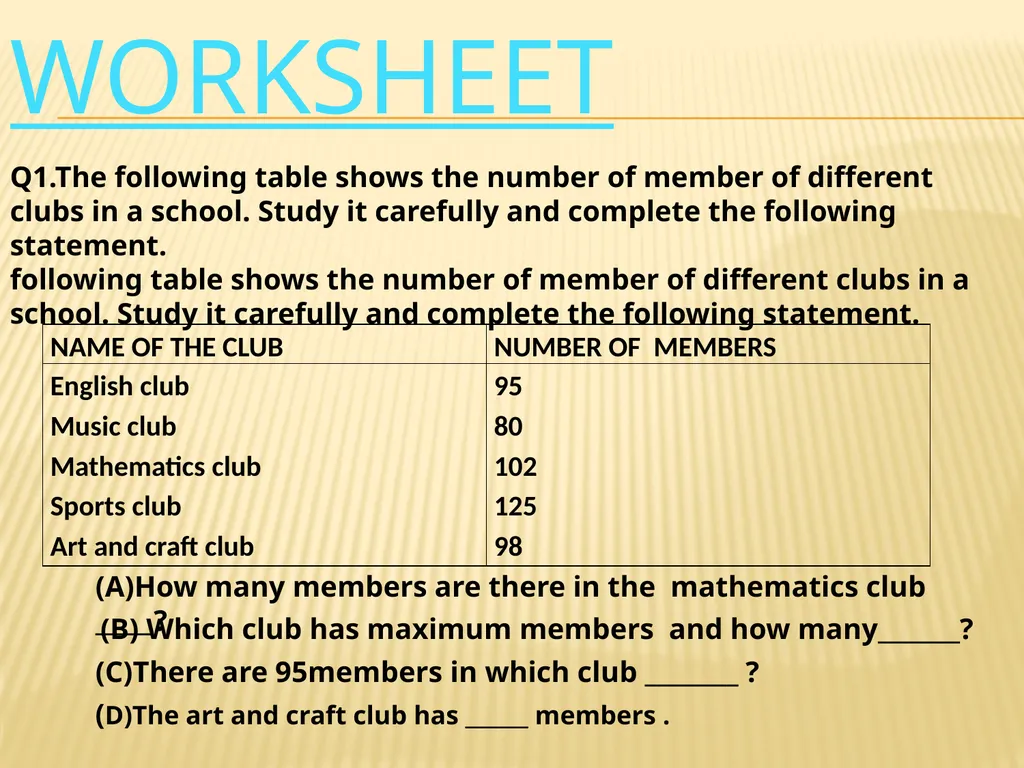
WORKSHEET Q1.The following table shows the number of member of different clubs in a school. Study it carefully and complete the following statement.
following table shows the number of member of different clubs in a school. Study it carefully and complete the following statement. (A)How many members are there in the mathematics club _____? (B) Which club has maximum members and how many_______? (C)There are 95members in which club ________ ? (D)The art and craft club has ______ members .<br>
25
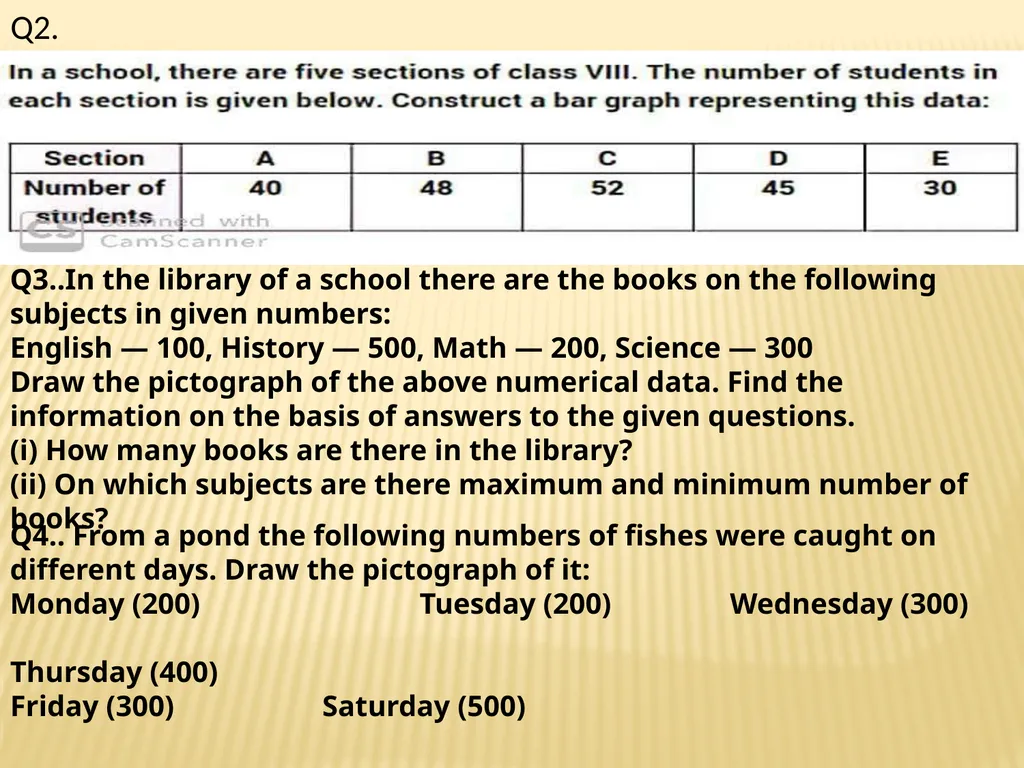
Q2. Q3..In the library of a school there are the books on the following subjects in given numbers:
English — 100, History — 500, Math — 200, Science — 300
Draw the pictograph of the above numerical data. Find the information on the basis of answers to the given questions.
(i) How many books are there in the library?
(ii) On which subjects are there maximum and minimum number of books? Q4.. From a pond the following numbers of fishes were caught on different days. Draw the pictograph of it:
Monday (200) Tuesday (200) Wednesday (300) Thursday (400) Friday (300) Saturday (500)<br>
26
Q5.The number of absentees in class VIII was recorded in a particular week. Represent this data on the bar graph.
Days Mon Tues Wed Thurs Fri Sat
Number of Absentees 130 120 135 130 150 80
(a) On which day the maximum and minimum students were absent?
(b) How many students were absent on Wednesday and Friday?
(c) On which days the same number of students was absent? Arrange the given information using tally marks. Q6.Numbers of different varities of toffees in a packet .<br>
27
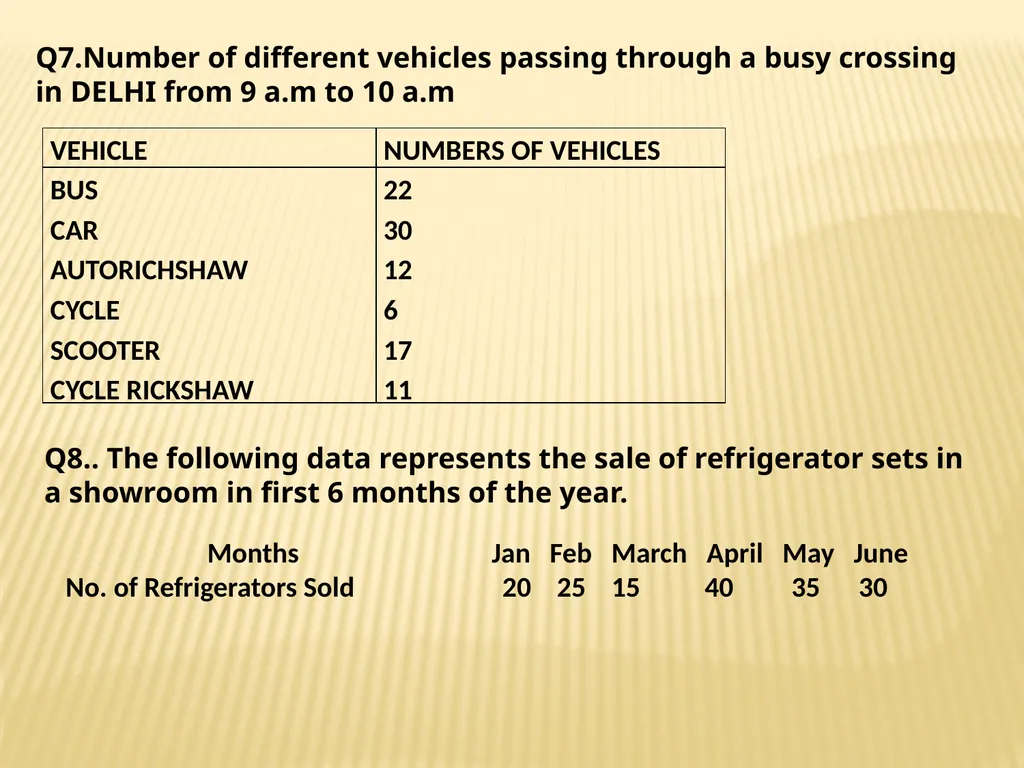
Q7.Number of different vehicles passing through a busy crossing in DELHI from 9 a.m to 10 a.m Q8.. The following data represents the sale of refrigerator sets in a showroom in first 6 months of the year. Months Jan Feb March April May June
No. of Refrigerators Sold 20 25 15 40 35 30<br>
28
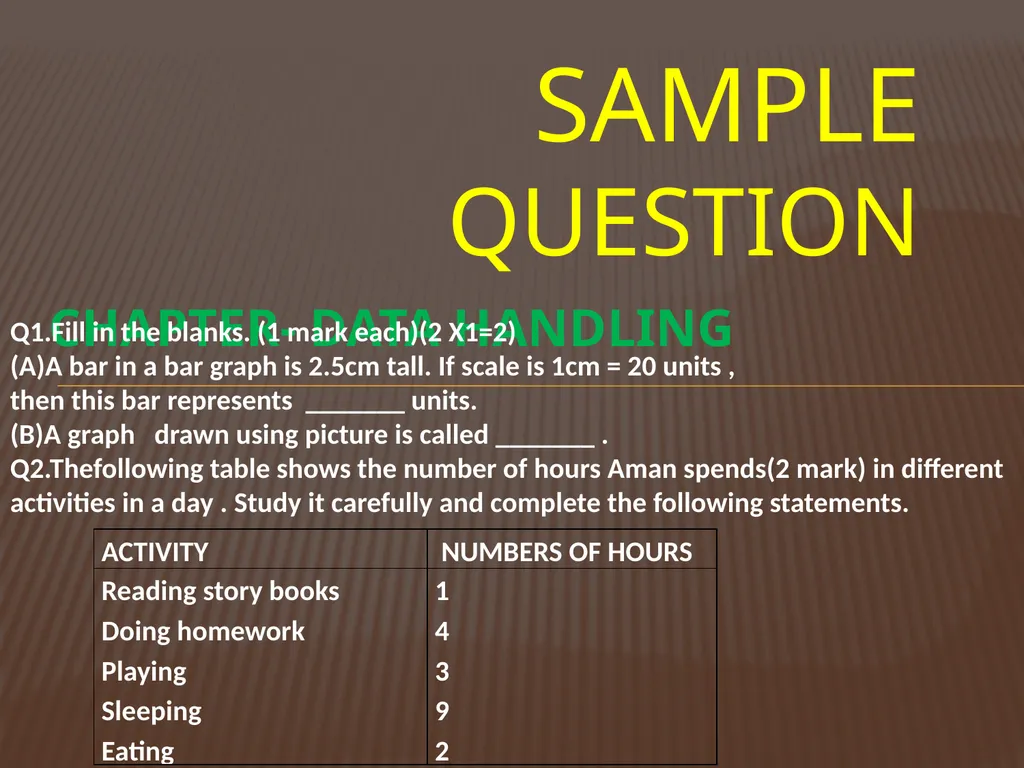
CHAPTER- DATA HANDLING SAMPLE QUESTION Q1.Fill in the blanks. (1 mark each)(2 X1=2)
(A)A bar in a bar graph is 2.5cm tall. If scale is 1cm = 20 units ,
then this bar represents _______ units.
(B)A graph drawn using picture is called _______ .
Q2.Thefollowing table shows the number of hours Aman spends(2 mark) in different activities in a day . Study it carefully and complete the following statements.<br>
29
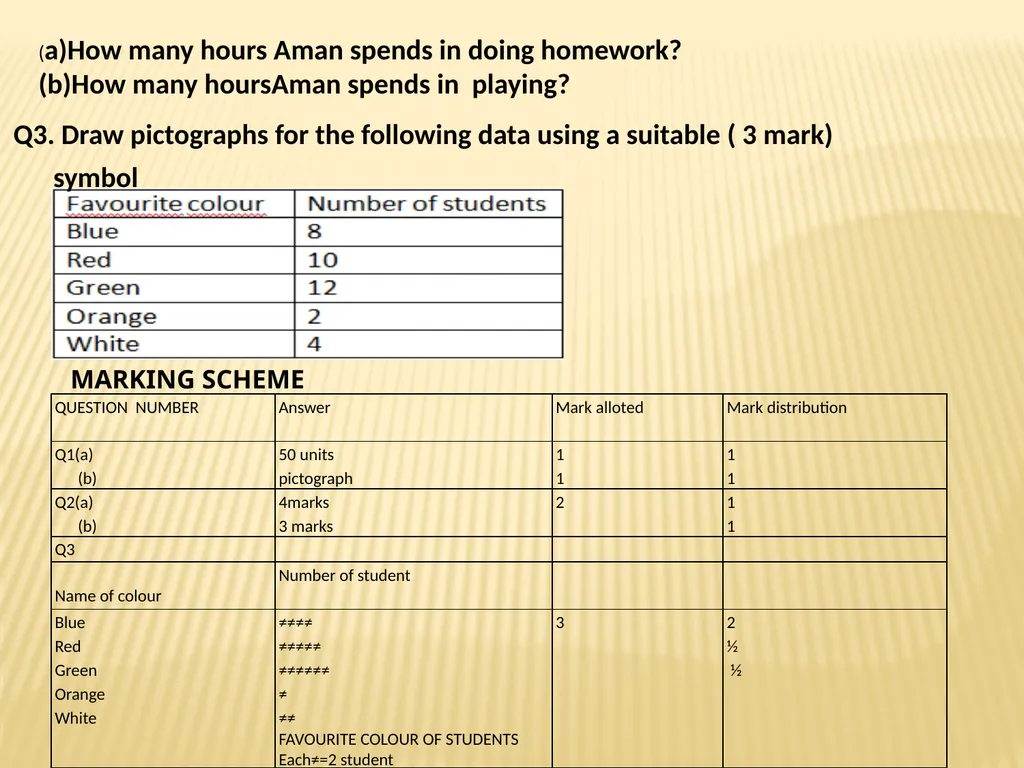
(a)How many hours Aman spends in doing homework?
(b)How many hoursAman spends in playing? Q3. Draw pictographs for the following data using a suitable ( 3 mark) symbol MARKING SCHEME<br>
30
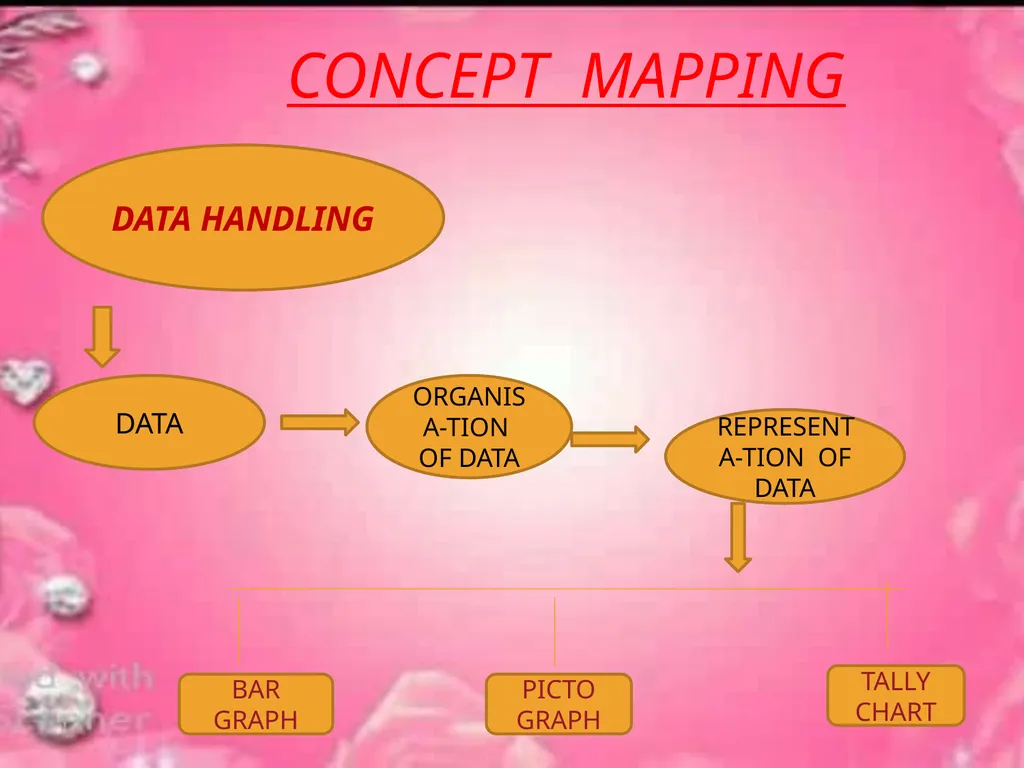
CONCEPT MAPPING DATA HANDLING DATA ORGANISA-TION OF DATA REPRESENTA-TION OF DATA BAR GRAPH PICTO GRAPH TALLY
CHART<br>