
Tariffs, Billing and Cost Recovery Peter van
Description: Tariffs, Billing and Cost Recovery Peter van Niekerk 1 Why Tariffs? Sustainability User-must-pay principle Capital, and interest on capital, must be recovered Operation and management costs must be recovered Costs directly related to
Related Topics
Download Presentation
"Tariffs, Billing and Cost Recovery Peter van" is the property of its rightful owner. Permission is granted to download and print the materials on this website for personal, non-commercial use only, and to display it on your personal computer provided you do not modify the materials and that you retain all copyright notices contained in the materials. By downloading content from our website, you accept the terms of this agreement.
Presentation Transcript
slide1. Tariffs, Billing and Cost Recovery Peter van Niekerk 1<br>
slide2. Why Tariffs? Sustainability
“User-must-pay” principle
Capital, and interest on capital, must be recovered
Operation and management costs must be recovered
Costs directly related to water projects
Costs generally related to water resource management
Resource use must be economically efficient
Correct pricing communicates the scarcity value of a resource and contributes to its efficient use.
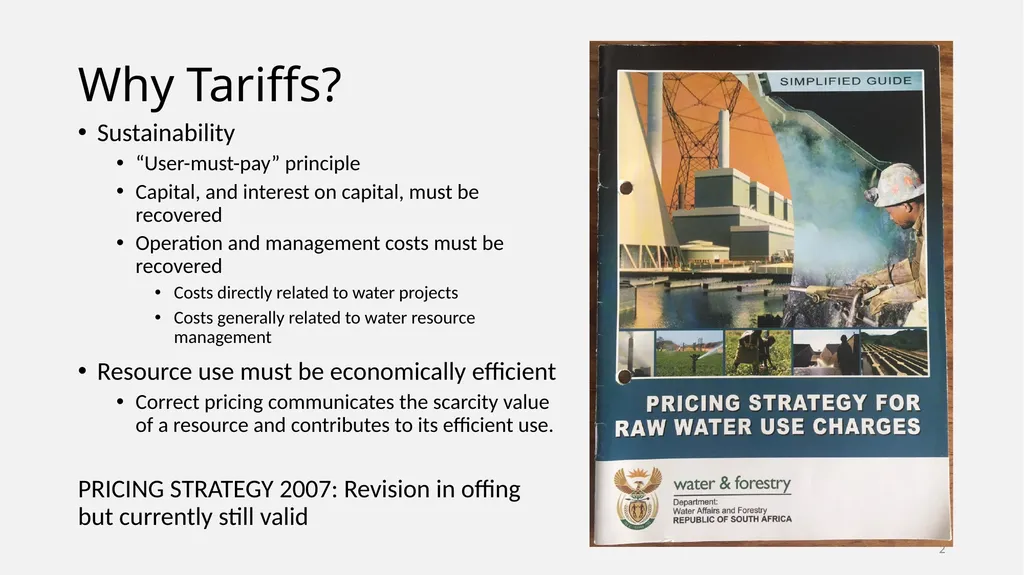
PRICING STRATEGY 2007: Revision in offing but currently still valid 2<br>
slide3. Funding of Water Resource Development and Use of Waterworks Tariffs (called charges in the Strategy) for return on assets and operation and maintenance of capital works (Government Water Schemes) are ring-fenced in the, so-called, Water Trading Entity
The funds in the WTE are to be employed in defraying costs related to these works and certain expenditures towards future such works. 3<br>
slide4. Funding of Water Resource Management (WRM) Intended to fund WRM activities by DWS and/or CMAs
Charges for abstraction
Charges for waste discharges 4<br>
slide5. For more detail on the Pricing Strategy see following presentation compiled by Willie Enright 5<br>
slide6. Pricing Strategy For Raw Water
Willie Enright<br>
slide7. Raw Water Pricing Strategy 2005 Policy framework laid down in Chapter 5 of National Water Act, 1998 (NWA)
Legislative mandate: Sections 56 - 60 of the NWA
Raw Water Pricing Strategy (RWPS) first established in November 1999.
The first revision of the pricing strategy published on 1 July 2005.<br>
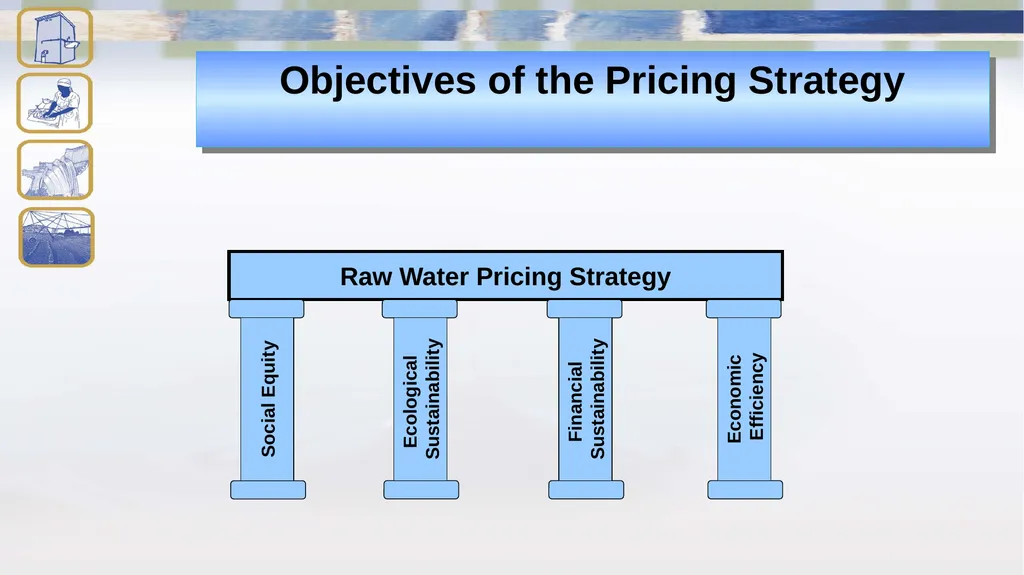
slide8. Objectives of the Pricing Strategy Raw Water Pricing Strategy Social Equity Ecological
Sustainability Financial
Sustainability Economic
Efficiency<br>
slide9. Objectives that shape new Pricing Strategy Social equity
Redressing imbalances
Provision of subsidies, direct access
Ecological sustainability
Reserve (quantity and quality), WC/DM
Management of catchment, Polluter pays
Financial sustainability
Inflation, refurbishment, asset replacement
Economic efficiency
Price of resource be set to reflect scarcity
Incentive to conserve water / opportunity cost<br>
slide10. Catchment management charges:
Water is free
Charges are for management
and control of use
You pay for the service rendered
Differentiate in use
Assurance of supply to be taken in account Pricing Strategy<br>
slide11. The pricing strategy contain a strategy for setting water use charges -
(a) For funding water resource management;
(b) For funding water resource development and use of waterworks;
(c) For achieving the equitable and efficient allocation of water. Pricing Strategy<br>
slide12. Social Equity Redressing the imbalances of the past with respect to:
- Inequitable access to basic water services at affordable tariffs within municipal areas, by facilitating a conditional subsidy on raw water cost where stepped tariffs are introduced
- Inequitable access to water for productive use purposes by subsidising tariffs for emerging farmers for a limited time period.<br>
slide13. Ecological Sustainability Pricing will take account of the cost of:
- Safeguarding the ecological reserve
- The ecological management of the catchment
- Water quality protection
- Water conservation and demand management<br>
slide14. Financial Sustainability Generating adequate revenue for funding the annual cost related to:
-the management of water resources
-the operation and maintenance of existing schemes
-the rehabilitation of existing schemes
- the development of augmentation schemes
In the process of annual tariff increases to reach this objective, the constraints within various user sectors to adapt to price increases will be taken into account<br>
slide15. Economic Efficiency To promote the efficient allocation and beneficial use of water, water should be priced at its opportunity cost.
The Pricing Strategy provides for administrative as well as market-related measures to achieve this goal.<br>
slide16. Contents of Pricing Strategy Minister concurred with Minister of Finance to establish a pricing strategy for water use: 56(1):
for funding water resource management
regulate, manage and maintain water resource/catchment
for funding water resource development and use of waterworks
Planning, design, development, O&M and improvement
Capital costs - Depreciation, Return on Assets
Pre-financing, assurance of supply
for achieving the equitable and efficient allocation of water use<br>
slide17. Contents of Pricing Strategy Types of raw water charges in pricing strategy:
Funding water resource management by water management institutions (WMI)
Funding of the development and use of waterworks
Charging an Economic Charge
Charging a waste discharge charge/levy
Charging a Water Research Levy<br>
slide18. Implications of pricing strategy on CMAs Water use charge are only applied to and collected from registered water users
Where water in the WMA is fully utilised or over allocated (registered use exceeds allocable water) the volume of registered sectoral water use will determine charges
CMA must annually budget for the estimated costs of activities to be performed in the WMA
Water resource management activity costs must be allocated to sectors in proportion to average annual sectoral use<br>
slide19. Catchment management charges to defray costs Functional support (Management)
Planning and implementation of catchment management functions
Dam safety control
Water quality management
Pollution control
Water utilisation
Water allocation
Water use control
Water conservation
Eradication of invasive plants
Demand management<br>
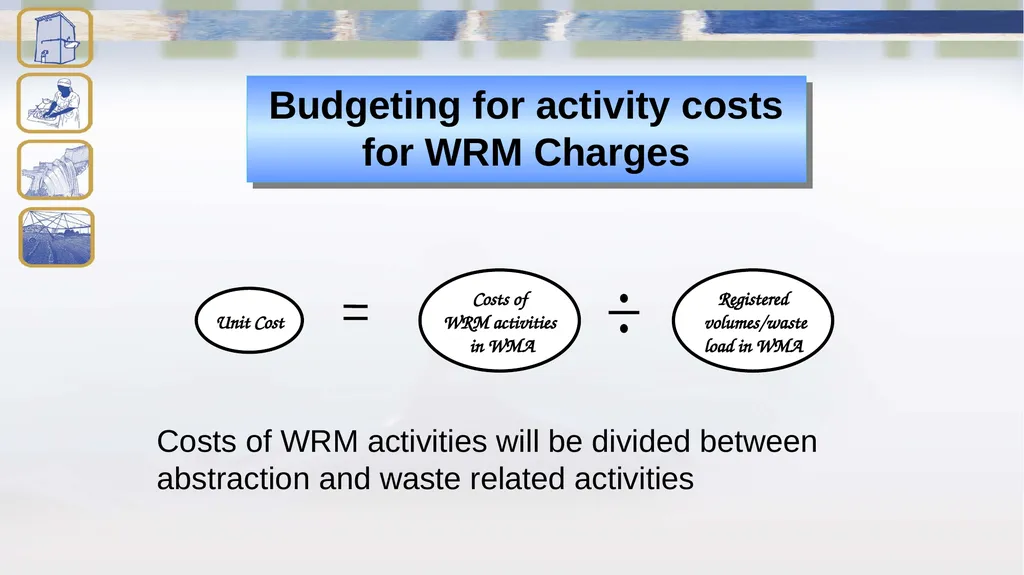
slide20. Budgeting for activity costs for WRM Charges Costs of
WRM activities
in WMA Unit Cost Registered
volumes/waste
load in WMA Costs of WRM activities will be divided between abstraction and waste related activities<br>
slide21. Water Uses subject to pricing Water use includes (Chapter 4):-
(a) taking water from a water resource
(b) storing water
impeding or diverting the flow of water in a water course
(d) engaging in a stream flow reduction activity
(e) engaging in a controlled activity
(f) discharging waste or water containing waste into a water resource through a pipe, canal, sea outfall
(g) disposing of waste in a manner which may detrimentally impact on a water resource. (1/11)<br>
slide22. Water use includes - (continued) (h) disposing of water which contains waste from, or which has been heated in, any industrial or power generation process
(i) altering the bed, banks, course or characteristics of a watercourse
(j) removing, discharging or disposing of water found underground if necessary for the efficient continuation of an activity or for the safety of people
(k) using water for recreational purposes (2/11) Water Uses subject to pricing<br>
slide23. Permissible use in terms of Schedule 1 of the NWA
The reserve related to basic human needs
The ecological reserve
Water required to meet South Africa’s commitments regarding international waters obligations. Allowable water uses not subject to pricing<br>
slide24. Allowable water uses not subject to pricing Schedule 1 to the NWA, can take place without licence or registration:-
Reasonable domestic use (lawful access)
Small gardening (not commercial purposes)
Watering of animals (excluding feedlots)
Store and use of run-off water from a roof
Emergency situations (firefighting)
Recreational purposes (lawful access) Discharge of waste in system controlled by another person<br>
slide25. Sectoral charges must be determined annually for the following sectors:
Water service authorities (municipal)
Industrial, mining, energy and “evaporation ponds”
Irrigation
Stream flow reduction activities - afforestation CMA can set Sectoral Charges<br>
slide26. Costs must be allocated to sectors in proportion to volumetric average annual sectoral use
Registered sectoral water use will take into account the assurance of supply from State and WUA schemes
The Pricing Strategy determines that the following activity costs must not be allocated to the Forestry sector
* Dam safety control
* WFW - control of invasive plants<br>
slide27. Setting of Sectoral Charges Unit costs per sector will be determined for each WMA by dividing budgeted activity costs by the allocatable sectoral use
Unit charges in cents per m3 for pricing purposes will take account of subsidies granted i.r.o the Pricing Strategy
The WFW unit cost for irrigation is subsidised by 90%<br>
slide28. Registered User Sectors Domestic/Industrial/Mining/Energy
Water allocations as reflected on a lawful permit, general authorization or license and and/or verified as existing lawful use and amended for assurance of supply.
Irrigation
The SAPWAT programme developed by the Water Research Commission or other method approved by DWAF to determine average annual irrigation use.
SFRA (Forestry)
Modified tables based on the WRC Report No. TT 173/02 (April 2002): Estimation of stream flow reductions resulting from commercial afforestation in South Africa.<br>
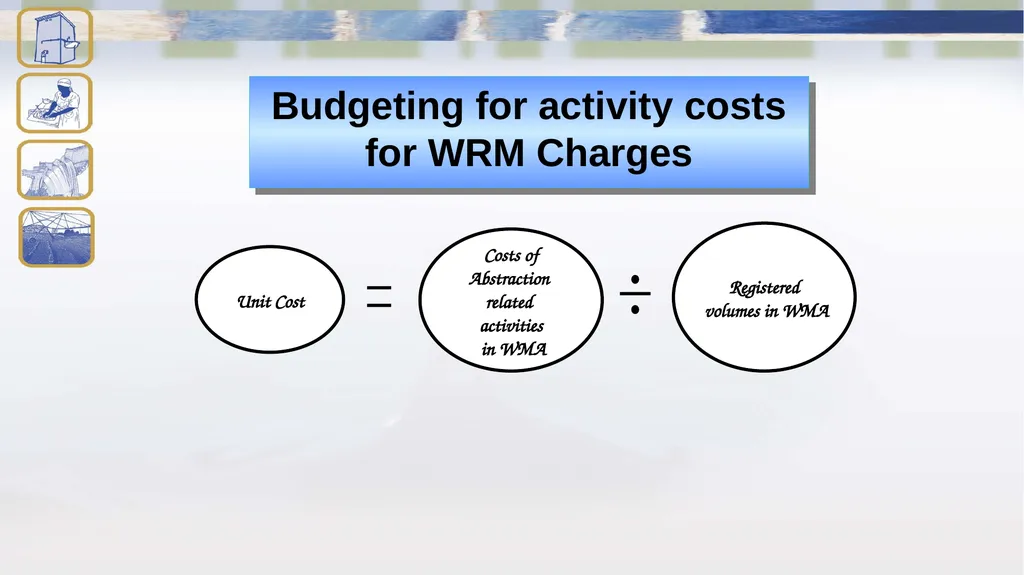
slide29. Budgeting for activity costs for WRM Charges Costs of
Abstraction
related
activities
in WMA Unit Cost Registered
volumes in WMA<br>
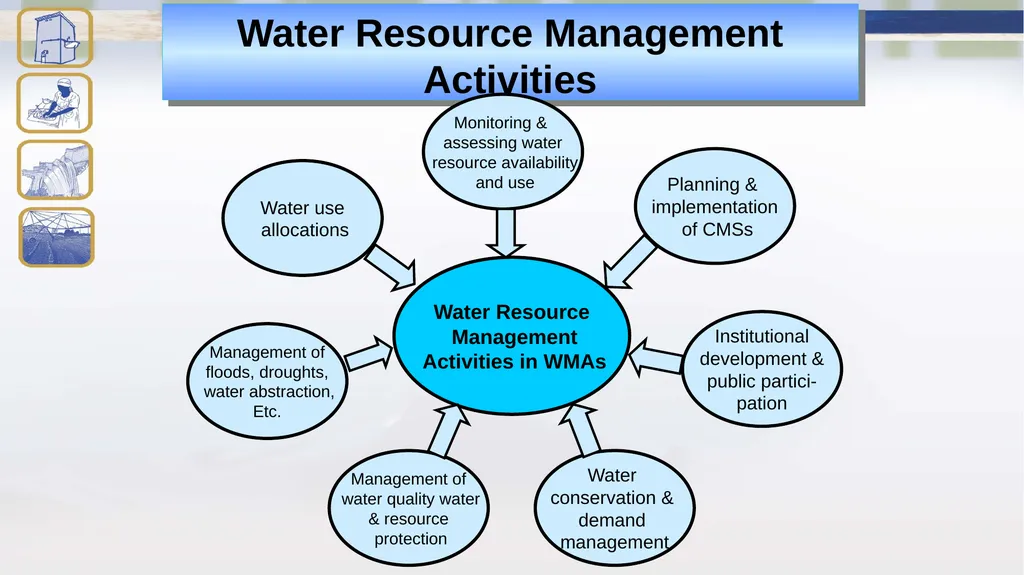
slide30. Water Resource Management Activities Water Resource
Management
Activities in WMAs Planning &
implementation
of CMSs Institutional
development &
public partici-
pation Water
conservation &
demand
management Water use
allocations Monitoring &
assessing water
resource availability
and use Management of
floods, droughts,
water abstraction,
Etc. Management of
water quality water
& resource
protection<br>
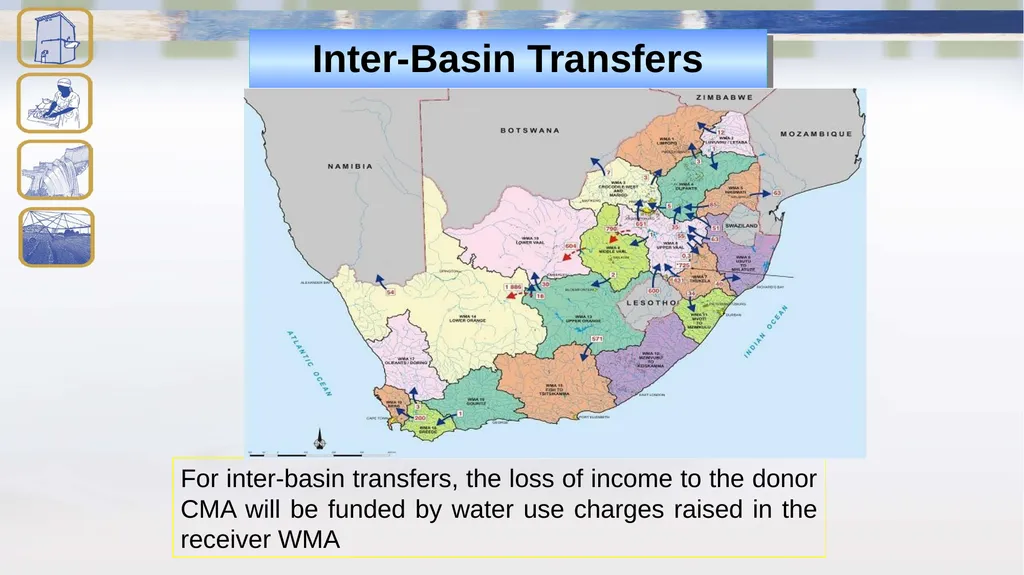
slide31. Inter-Basin Transfers For inter-basin transfers, the loss of income to the donor CMA will be funded by water use charges raised in the receiver WMA<br>
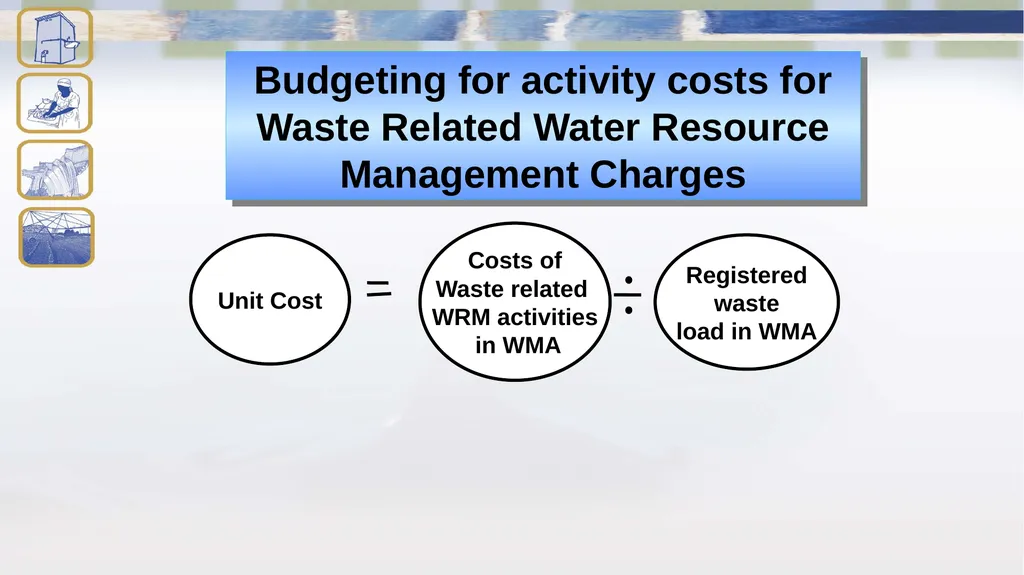
slide32. Budgeting for activity costs for Waste Related Water Resource Management Charges Costs of
Waste related
WRM activities
in WMA Unit Cost Registered
waste
load in WMA<br>
slide33. Waste Discharge Charge System The waste discharge charge system comprise of two distinct water use charges which may be applied in a specific catchment. These are:-
Charge to cover the quantifiable cost of administratively implemented measures for the mitigation of waste discharge related impacts (mitigation charges).
Charge that provides a disincentive or a deterrent to the discharge of waste (incentive charge).<br>
slide34. Water Resource Management charges for waste discharge Waste Discharge WRM activities will be charged to municipal (domestic), industrial, mining, energy and agricultural sectors.
Charges will be calculated on registered discharge waste load of salinity and phosphorus
Salt load will be estimated using electrical conductivity.
Phosphorus will be estimated using soluble phosphorus.<br>
slide35. Waste Discharge Charge System The waste discharge charge system comprise of two distinct water use charges which may be applied in a specific catchment. These are:-
Charge to cover the quantifiable cost of administratively implemented measures for the mitigation of waste discharge related impacts (mitigation charges).
Charge that provides a disincentive or a deterrent to the discharge of waste Economically efficient tool to reduce loads at source(incentive charge).<br>
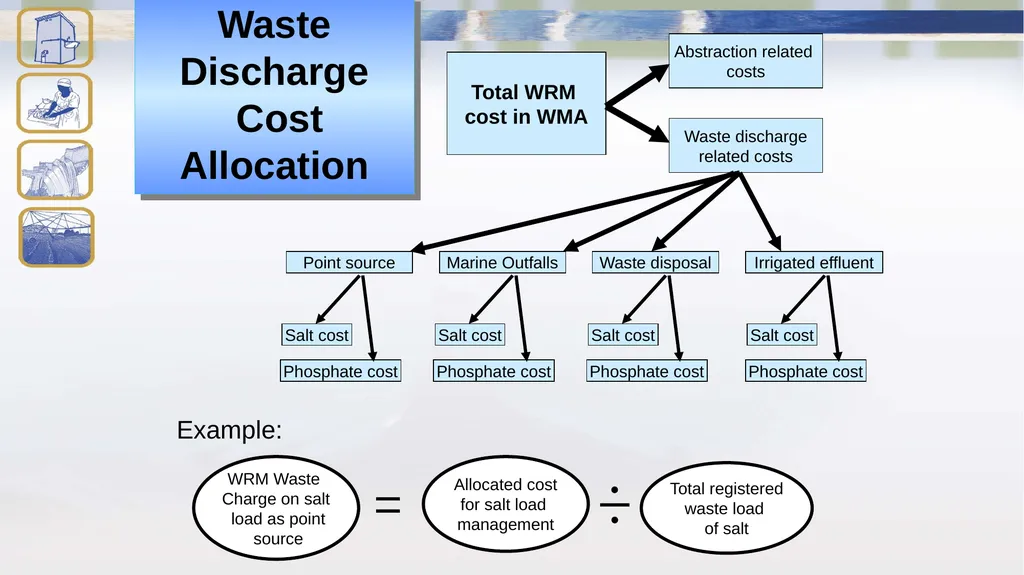
slide36. Waste Discharge Cost Allocation Total WRM
cost in WMA Abstraction related
costs Waste discharge
related costs Point source Marine Outfalls Waste disposal Irrigated effluent Salt cost Phosphate cost Salt cost Phosphate cost Salt cost Phosphate cost Salt cost Phosphate cost WRM Waste
Charge on salt
load as point
source Allocated cost
for salt load
management Total registered
waste load
of salt Example:<br>
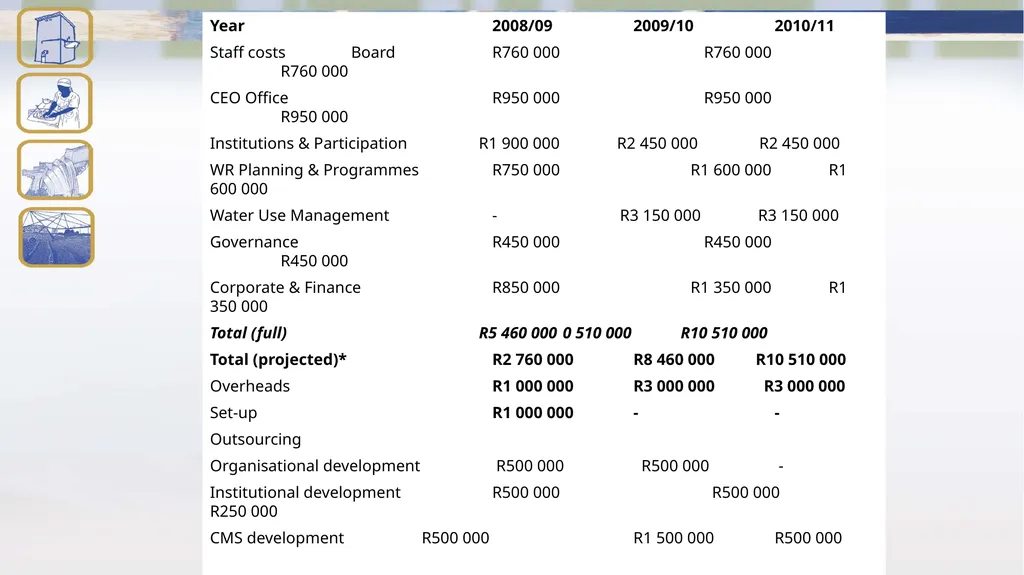
slide37. Year 2008/09 2009/10 2010/11
Staff costs Board R760 000 R760 000 R760 000
CEO Office R950 000 R950 000 R950 000
Institutions & Participation R1 900 000 R2 450 000 R2 450 000
WR Planning & Programmes R750 000 R1 600 000 R1 600 000
Water Use Management - R3 150 000 R3 150 000
Governance R450 000 R450 000 R450 000
Corporate & Finance R850 000 R1 350 000 R1 350 000
Total (full) R5 460 000 0 510 000 R10 510 000
Total (projected)* R2 760 000 R8 460 000 R10 510 000
Overheads R1 000 000 R3 000 000 R3 000 000
Set-up R1 000 000 - -
Outsourcing
Organisational development R500 000 R500 000 -
Institutional development R500 000 R500 000 R250 000
CMS development R500 000 R1 500 000 R500 000
Financial & Corporate R500 000 R500 000 R500 000
Total R2 000 000 R3 000 000 R1 250 000
Capital Repayments - ? ?
TOTAL CMA R6 760 000 R14 460 000 R14 760 000<br>
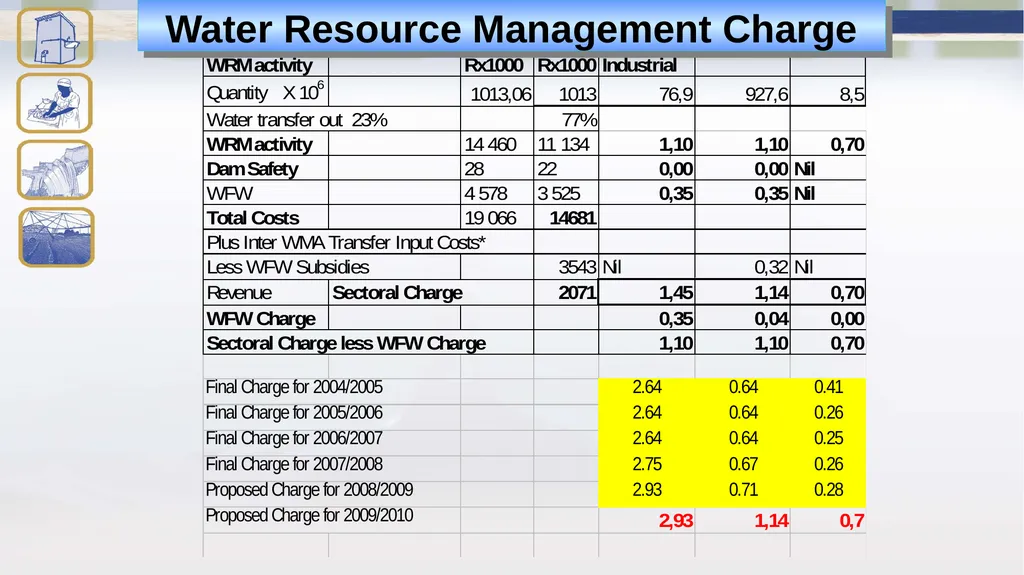
slide38. Water Resource Management Charge<br>
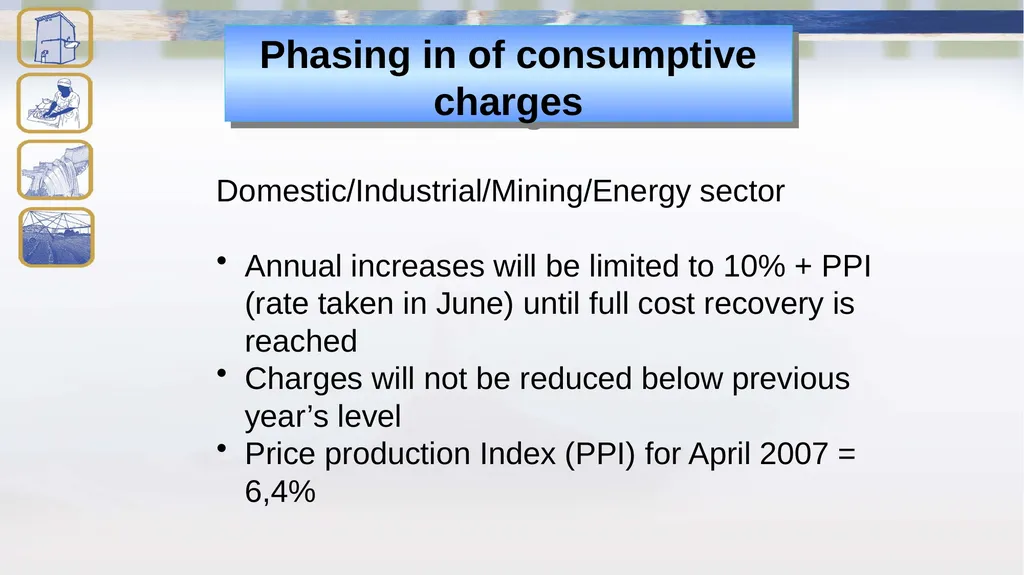
slide39. Phasing in of consumptive charges Domestic/Industrial/Mining/Energy sector
Annual increases will be limited to 10% + PPI (rate taken in June) until full cost recovery is reached
Charges will not be reduced below previous year’s level
Price production Index (PPI) for April 2007 = 6,4%<br>
slide2. Why Tariffs? Sustainability
“User-must-pay” principle
Capital, and interest on capital, must be recovered
Operation and management costs must be recovered
Costs directly related to water projects
Costs generally related to water resource management
Resource use must be economically efficient
Correct pricing communicates the scarcity value of a resource and contributes to its efficient use.
PRICING STRATEGY 2007: Revision in offing but currently still valid 2<br>
slide3. Funding of Water Resource Development and Use of Waterworks Tariffs (called charges in the Strategy) for return on assets and operation and maintenance of capital works (Government Water Schemes) are ring-fenced in the, so-called, Water Trading Entity
The funds in the WTE are to be employed in defraying costs related to these works and certain expenditures towards future such works. 3<br>
slide4. Funding of Water Resource Management (WRM) Intended to fund WRM activities by DWS and/or CMAs
Charges for abstraction
Charges for waste discharges 4<br>
slide5. For more detail on the Pricing Strategy see following presentation compiled by Willie Enright 5<br>
slide6. Pricing Strategy For Raw Water
Willie Enright<br>
slide7. Raw Water Pricing Strategy 2005 Policy framework laid down in Chapter 5 of National Water Act, 1998 (NWA)
Legislative mandate: Sections 56 - 60 of the NWA
Raw Water Pricing Strategy (RWPS) first established in November 1999.
The first revision of the pricing strategy published on 1 July 2005.<br>
slide8. Objectives of the Pricing Strategy Raw Water Pricing Strategy Social Equity Ecological
Sustainability Financial
Sustainability Economic
Efficiency<br>
slide9. Objectives that shape new Pricing Strategy Social equity
Redressing imbalances
Provision of subsidies, direct access
Ecological sustainability
Reserve (quantity and quality), WC/DM
Management of catchment, Polluter pays
Financial sustainability
Inflation, refurbishment, asset replacement
Economic efficiency
Price of resource be set to reflect scarcity
Incentive to conserve water / opportunity cost<br>
slide10. Catchment management charges:
Water is free
Charges are for management
and control of use
You pay for the service rendered
Differentiate in use
Assurance of supply to be taken in account Pricing Strategy<br>
slide11. The pricing strategy contain a strategy for setting water use charges -
(a) For funding water resource management;
(b) For funding water resource development and use of waterworks;
(c) For achieving the equitable and efficient allocation of water. Pricing Strategy<br>
slide12. Social Equity Redressing the imbalances of the past with respect to:
- Inequitable access to basic water services at affordable tariffs within municipal areas, by facilitating a conditional subsidy on raw water cost where stepped tariffs are introduced
- Inequitable access to water for productive use purposes by subsidising tariffs for emerging farmers for a limited time period.<br>
slide13. Ecological Sustainability Pricing will take account of the cost of:
- Safeguarding the ecological reserve
- The ecological management of the catchment
- Water quality protection
- Water conservation and demand management<br>
slide14. Financial Sustainability Generating adequate revenue for funding the annual cost related to:
-the management of water resources
-the operation and maintenance of existing schemes
-the rehabilitation of existing schemes
- the development of augmentation schemes
In the process of annual tariff increases to reach this objective, the constraints within various user sectors to adapt to price increases will be taken into account<br>
slide15. Economic Efficiency To promote the efficient allocation and beneficial use of water, water should be priced at its opportunity cost.
The Pricing Strategy provides for administrative as well as market-related measures to achieve this goal.<br>
slide16. Contents of Pricing Strategy Minister concurred with Minister of Finance to establish a pricing strategy for water use: 56(1):
for funding water resource management
regulate, manage and maintain water resource/catchment
for funding water resource development and use of waterworks
Planning, design, development, O&M and improvement
Capital costs - Depreciation, Return on Assets
Pre-financing, assurance of supply
for achieving the equitable and efficient allocation of water use<br>
slide17. Contents of Pricing Strategy Types of raw water charges in pricing strategy:
Funding water resource management by water management institutions (WMI)
Funding of the development and use of waterworks
Charging an Economic Charge
Charging a waste discharge charge/levy
Charging a Water Research Levy<br>
slide18. Implications of pricing strategy on CMAs Water use charge are only applied to and collected from registered water users
Where water in the WMA is fully utilised or over allocated (registered use exceeds allocable water) the volume of registered sectoral water use will determine charges
CMA must annually budget for the estimated costs of activities to be performed in the WMA
Water resource management activity costs must be allocated to sectors in proportion to average annual sectoral use<br>
slide19. Catchment management charges to defray costs Functional support (Management)
Planning and implementation of catchment management functions
Dam safety control
Water quality management
Pollution control
Water utilisation
Water allocation
Water use control
Water conservation
Eradication of invasive plants
Demand management<br>
slide20. Budgeting for activity costs for WRM Charges Costs of
WRM activities
in WMA Unit Cost Registered
volumes/waste
load in WMA Costs of WRM activities will be divided between abstraction and waste related activities<br>
slide21. Water Uses subject to pricing Water use includes (Chapter 4):-
(a) taking water from a water resource
(b) storing water
impeding or diverting the flow of water in a water course
(d) engaging in a stream flow reduction activity
(e) engaging in a controlled activity
(f) discharging waste or water containing waste into a water resource through a pipe, canal, sea outfall
(g) disposing of waste in a manner which may detrimentally impact on a water resource. (1/11)<br>
slide22. Water use includes - (continued) (h) disposing of water which contains waste from, or which has been heated in, any industrial or power generation process
(i) altering the bed, banks, course or characteristics of a watercourse
(j) removing, discharging or disposing of water found underground if necessary for the efficient continuation of an activity or for the safety of people
(k) using water for recreational purposes (2/11) Water Uses subject to pricing<br>
slide23. Permissible use in terms of Schedule 1 of the NWA
The reserve related to basic human needs
The ecological reserve
Water required to meet South Africa’s commitments regarding international waters obligations. Allowable water uses not subject to pricing<br>
slide24. Allowable water uses not subject to pricing Schedule 1 to the NWA, can take place without licence or registration:-
Reasonable domestic use (lawful access)
Small gardening (not commercial purposes)
Watering of animals (excluding feedlots)
Store and use of run-off water from a roof
Emergency situations (firefighting)
Recreational purposes (lawful access) Discharge of waste in system controlled by another person<br>
slide25. Sectoral charges must be determined annually for the following sectors:
Water service authorities (municipal)
Industrial, mining, energy and “evaporation ponds”
Irrigation
Stream flow reduction activities - afforestation CMA can set Sectoral Charges<br>
slide26. Costs must be allocated to sectors in proportion to volumetric average annual sectoral use
Registered sectoral water use will take into account the assurance of supply from State and WUA schemes
The Pricing Strategy determines that the following activity costs must not be allocated to the Forestry sector
* Dam safety control
* WFW - control of invasive plants<br>
slide27. Setting of Sectoral Charges Unit costs per sector will be determined for each WMA by dividing budgeted activity costs by the allocatable sectoral use
Unit charges in cents per m3 for pricing purposes will take account of subsidies granted i.r.o the Pricing Strategy
The WFW unit cost for irrigation is subsidised by 90%<br>
slide28. Registered User Sectors Domestic/Industrial/Mining/Energy
Water allocations as reflected on a lawful permit, general authorization or license and and/or verified as existing lawful use and amended for assurance of supply.
Irrigation
The SAPWAT programme developed by the Water Research Commission or other method approved by DWAF to determine average annual irrigation use.
SFRA (Forestry)
Modified tables based on the WRC Report No. TT 173/02 (April 2002): Estimation of stream flow reductions resulting from commercial afforestation in South Africa.<br>
slide29. Budgeting for activity costs for WRM Charges Costs of
Abstraction
related
activities
in WMA Unit Cost Registered
volumes in WMA<br>
slide30. Water Resource Management Activities Water Resource
Management
Activities in WMAs Planning &
implementation
of CMSs Institutional
development &
public partici-
pation Water
conservation &
demand
management Water use
allocations Monitoring &
assessing water
resource availability
and use Management of
floods, droughts,
water abstraction,
Etc. Management of
water quality water
& resource
protection<br>
slide31. Inter-Basin Transfers For inter-basin transfers, the loss of income to the donor CMA will be funded by water use charges raised in the receiver WMA<br>
slide32. Budgeting for activity costs for Waste Related Water Resource Management Charges Costs of
Waste related
WRM activities
in WMA Unit Cost Registered
waste
load in WMA<br>
slide33. Waste Discharge Charge System The waste discharge charge system comprise of two distinct water use charges which may be applied in a specific catchment. These are:-
Charge to cover the quantifiable cost of administratively implemented measures for the mitigation of waste discharge related impacts (mitigation charges).
Charge that provides a disincentive or a deterrent to the discharge of waste (incentive charge).<br>
slide34. Water Resource Management charges for waste discharge Waste Discharge WRM activities will be charged to municipal (domestic), industrial, mining, energy and agricultural sectors.
Charges will be calculated on registered discharge waste load of salinity and phosphorus
Salt load will be estimated using electrical conductivity.
Phosphorus will be estimated using soluble phosphorus.<br>
slide35. Waste Discharge Charge System The waste discharge charge system comprise of two distinct water use charges which may be applied in a specific catchment. These are:-
Charge to cover the quantifiable cost of administratively implemented measures for the mitigation of waste discharge related impacts (mitigation charges).
Charge that provides a disincentive or a deterrent to the discharge of waste Economically efficient tool to reduce loads at source(incentive charge).<br>
slide36. Waste Discharge Cost Allocation Total WRM
cost in WMA Abstraction related
costs Waste discharge
related costs Point source Marine Outfalls Waste disposal Irrigated effluent Salt cost Phosphate cost Salt cost Phosphate cost Salt cost Phosphate cost Salt cost Phosphate cost WRM Waste
Charge on salt
load as point
source Allocated cost
for salt load
management Total registered
waste load
of salt Example:<br>
slide37. Year 2008/09 2009/10 2010/11
Staff costs Board R760 000 R760 000 R760 000
CEO Office R950 000 R950 000 R950 000
Institutions & Participation R1 900 000 R2 450 000 R2 450 000
WR Planning & Programmes R750 000 R1 600 000 R1 600 000
Water Use Management - R3 150 000 R3 150 000
Governance R450 000 R450 000 R450 000
Corporate & Finance R850 000 R1 350 000 R1 350 000
Total (full) R5 460 000 0 510 000 R10 510 000
Total (projected)* R2 760 000 R8 460 000 R10 510 000
Overheads R1 000 000 R3 000 000 R3 000 000
Set-up R1 000 000 - -
Outsourcing
Organisational development R500 000 R500 000 -
Institutional development R500 000 R500 000 R250 000
CMS development R500 000 R1 500 000 R500 000
Financial & Corporate R500 000 R500 000 R500 000
Total R2 000 000 R3 000 000 R1 250 000
Capital Repayments - ? ?
TOTAL CMA R6 760 000 R14 460 000 R14 760 000<br>
slide38. Water Resource Management Charge<br>
slide39. Phasing in of consumptive charges Domestic/Industrial/Mining/Energy sector
Annual increases will be limited to 10% + PPI (rate taken in June) until full cost recovery is reached
Charges will not be reduced below previous year’s level
Price production Index (PPI) for April 2007 = 6,4%<br>