
TCD M.Sc.(EPS) – Ronan LYONS – EC8001 Irish
MT
Published · 61 slides · 0 views

1 / 1

Description
TCD M.Sc.(EPS) Ronan LYONS EC8001 Irish Economic Policy ISSUES Context TOPIC C: The Economy Economic Growth Module Outline Topic C: Structure The Economy Economic Growth Conceptualizing the economy National income accounts GDP,
Related Topics
Share
Embed code
Download this presentation From Below
"TCD M.Sc.(EPS) – Ronan LYONS – EC8001 Irish" is the property of its rightful owner. Permission is granted to download and print the materials on this website for personal, non-commercial use only, and to display it on your personal computer provided you do not modify the materials and that you retain all copyright notices contained in the materials. By downloading content from our website, you accept the terms of this agreement.
Presentation Transcript
01
TCD M.Sc.(EPS) – Ronan LYONS – EC8001 Irish Economic Policy ISSUES & Context TOPIC C:
The Economy & Economic Growth<br>
02
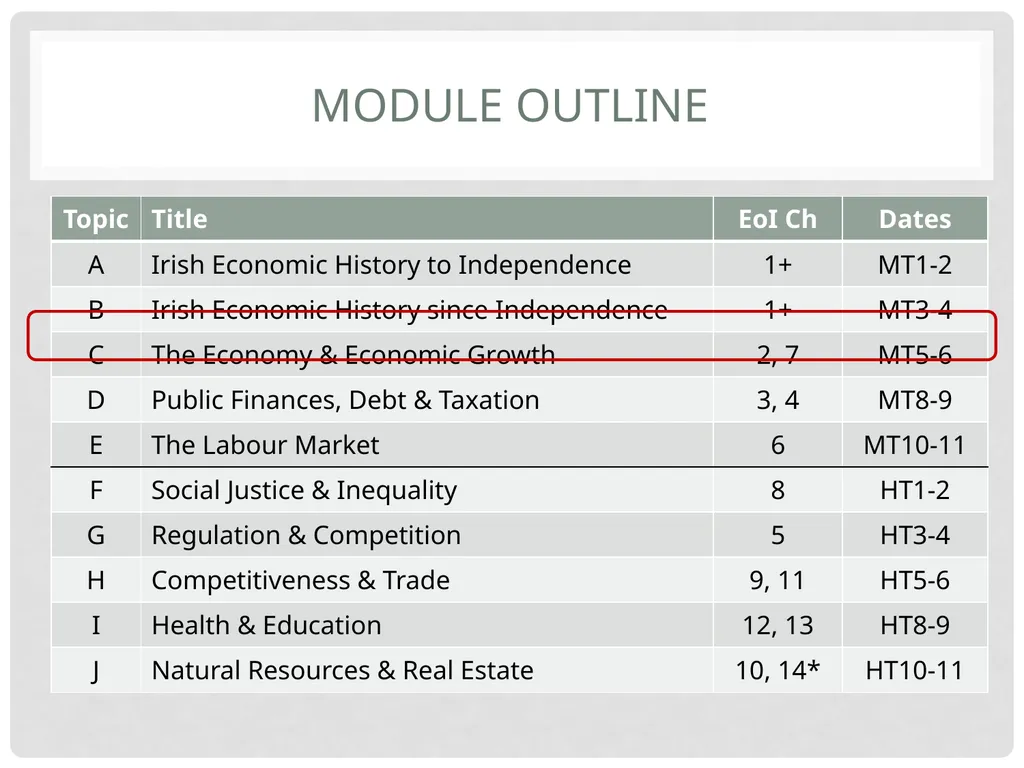
Module Outline<br>
03
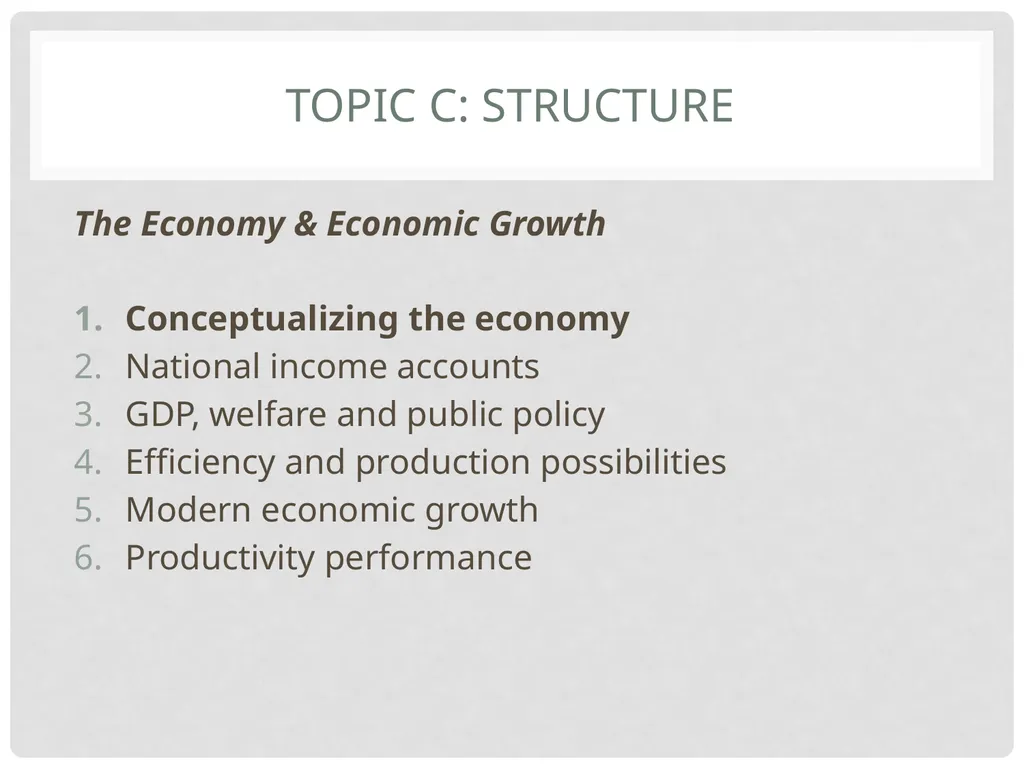
Topic C: Structure The Economy & Economic Growth
Conceptualizing the economy
National income accounts
GDP, welfare and public policy
Efficiency and production possibilities
Modern economic growth
Productivity performance<br>
Conceptualizing the economy
National income accounts
GDP, welfare and public policy
Efficiency and production possibilities
Modern economic growth
Productivity performance<br>
04
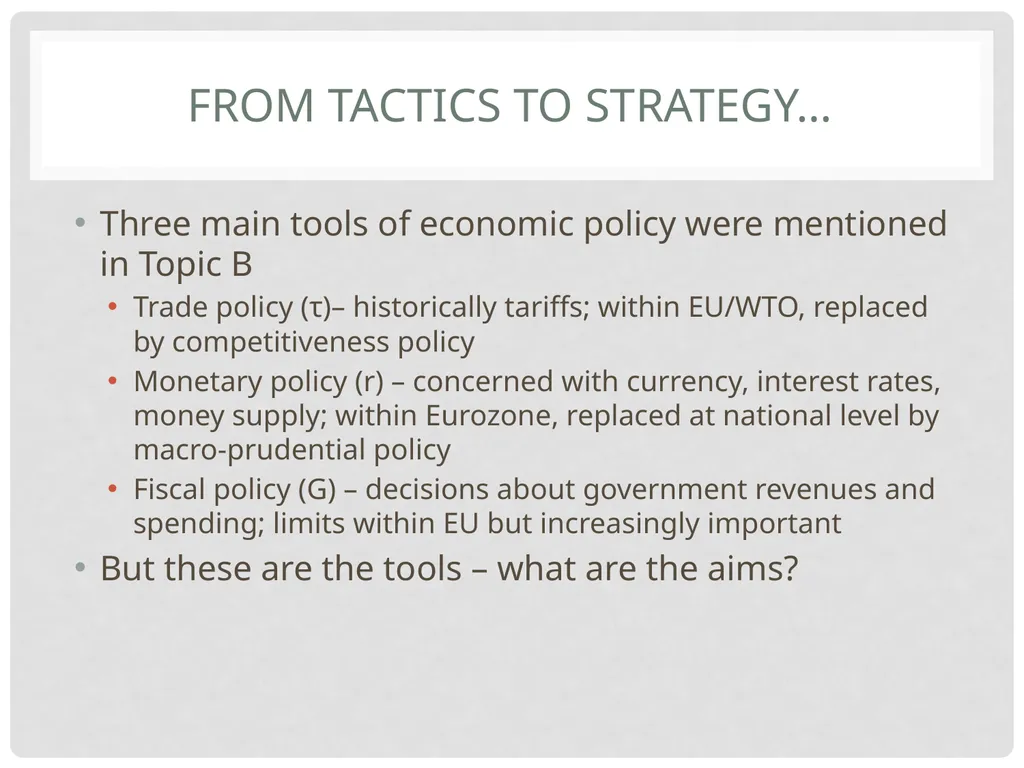
From Tactics to Strategy… Three main tools of economic policy were mentioned in Topic B
Trade policy (τ)– historically tariffs; within EU/WTO, replaced by competitiveness policy
Monetary policy (r) – concerned with currency, interest rates, money supply; within Eurozone, replaced at national level by macro-prudential policy
Fiscal policy (G) – decisions about government revenues and spending; limits within EU but increasingly important
But these are the tools – what are the aims?<br>
Trade policy (τ)– historically tariffs; within EU/WTO, replaced by competitiveness policy
Monetary policy (r) – concerned with currency, interest rates, money supply; within Eurozone, replaced at national level by macro-prudential policy
Fiscal policy (G) – decisions about government revenues and spending; limits within EU but increasingly important
But these are the tools – what are the aims?<br>
05
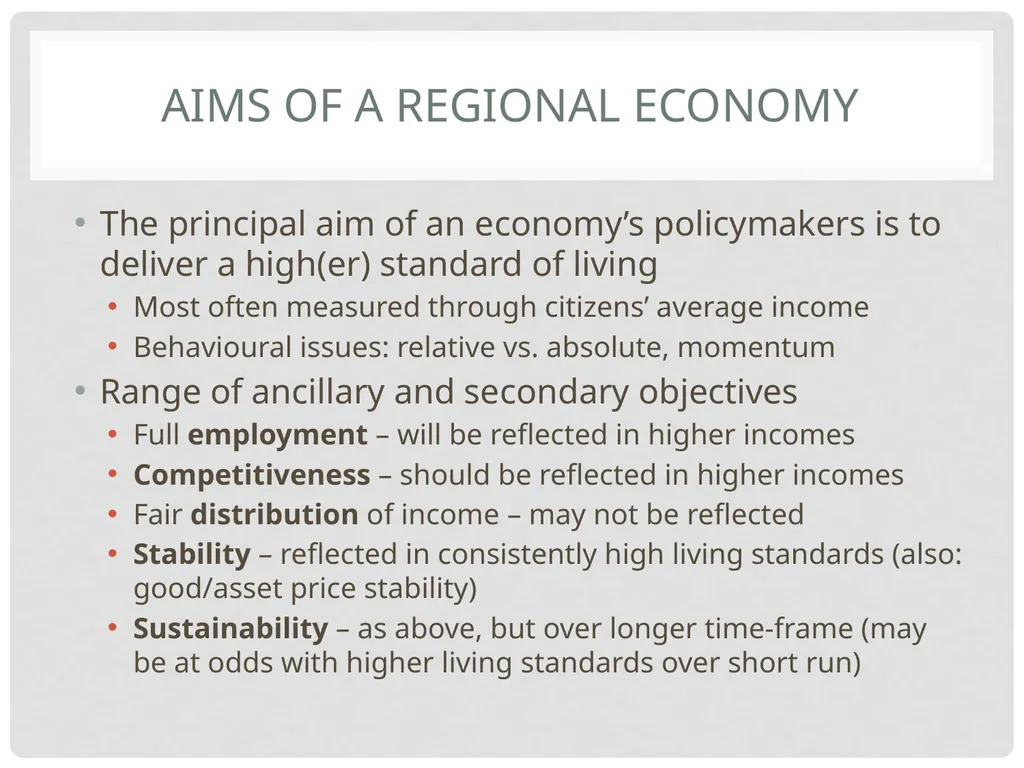
Aims of A Regional Economy The principal aim of an economy’s policymakers is to deliver a high(er) standard of living
Most often measured through citizens’ average income
Behavioural issues: relative vs. absolute, momentum
Range of ancillary and secondary objectives
Full employment – will be reflected in higher incomes
Competitiveness – should be reflected in higher incomes
Fair distribution of income – may not be reflected
Stability – reflected in consistently high living standards (also: good/asset price stability)
Sustainability – as above, but over longer time-frame (may be at odds with higher living standards over short run)<br>
Most often measured through citizens’ average income
Behavioural issues: relative vs. absolute, momentum
Range of ancillary and secondary objectives
Full employment – will be reflected in higher incomes
Competitiveness – should be reflected in higher incomes
Fair distribution of income – may not be reflected
Stability – reflected in consistently high living standards (also: good/asset price stability)
Sustainability – as above, but over longer time-frame (may be at odds with higher living standards over short run)<br>
06
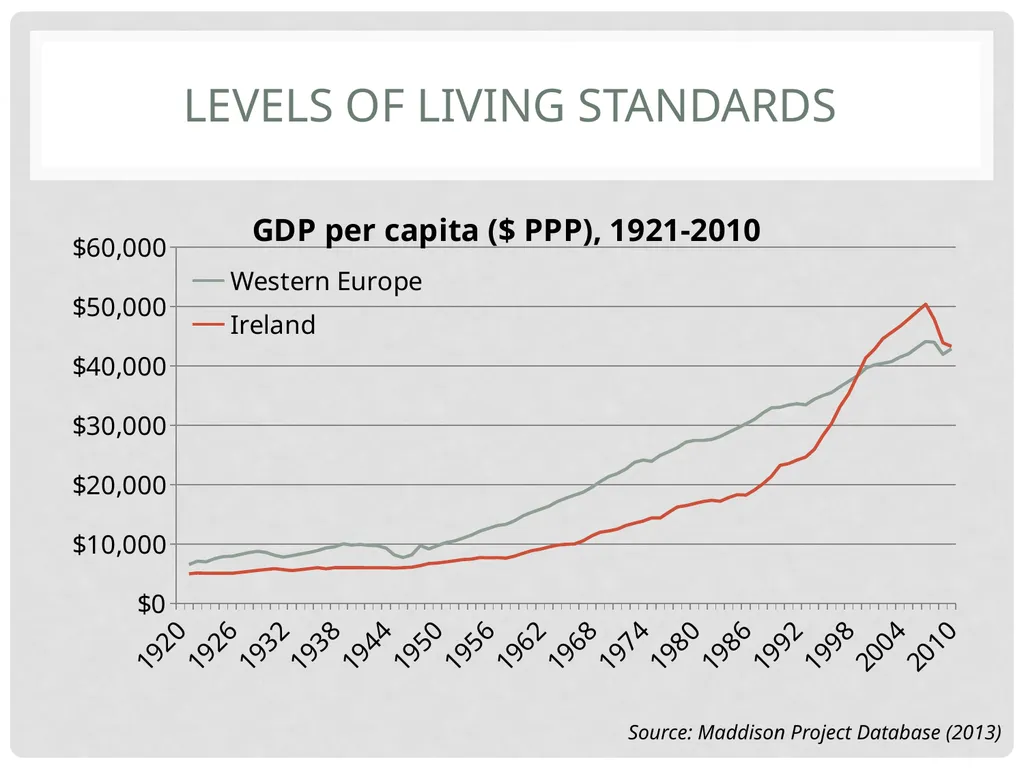
Levels of Living Standards Source: Maddison Project Database (2013)<br>
07
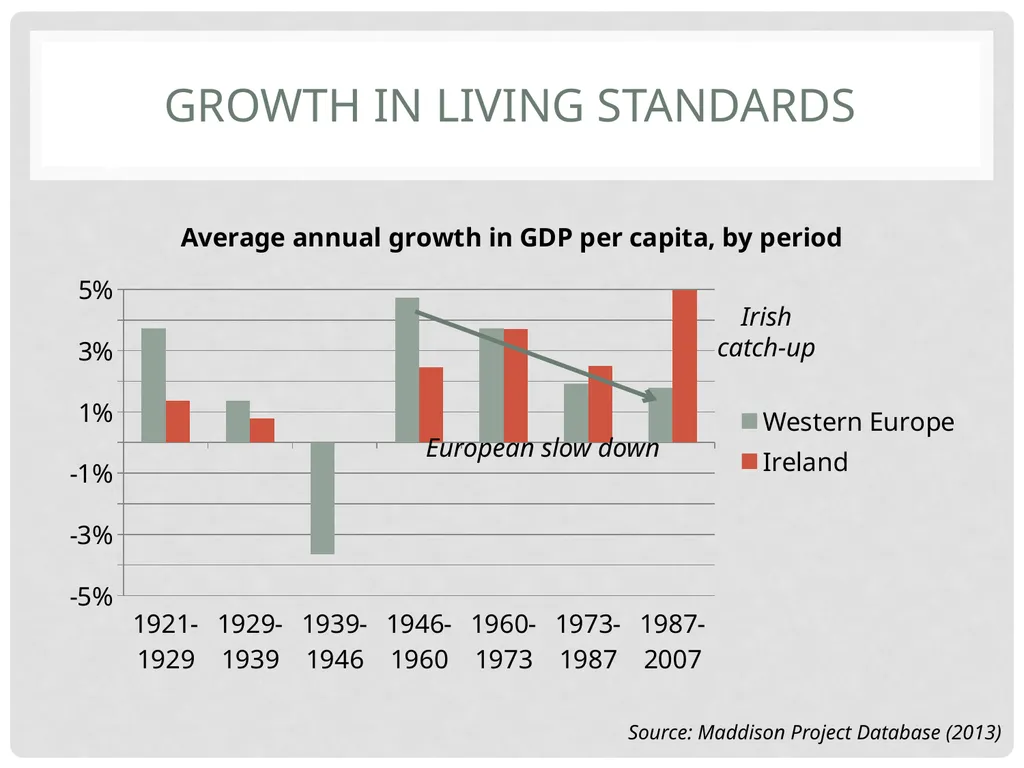
Growth in Living Standards Source: Maddison Project Database (2013) European slow down Irish
catch-up<br>
catch-up<br>
08
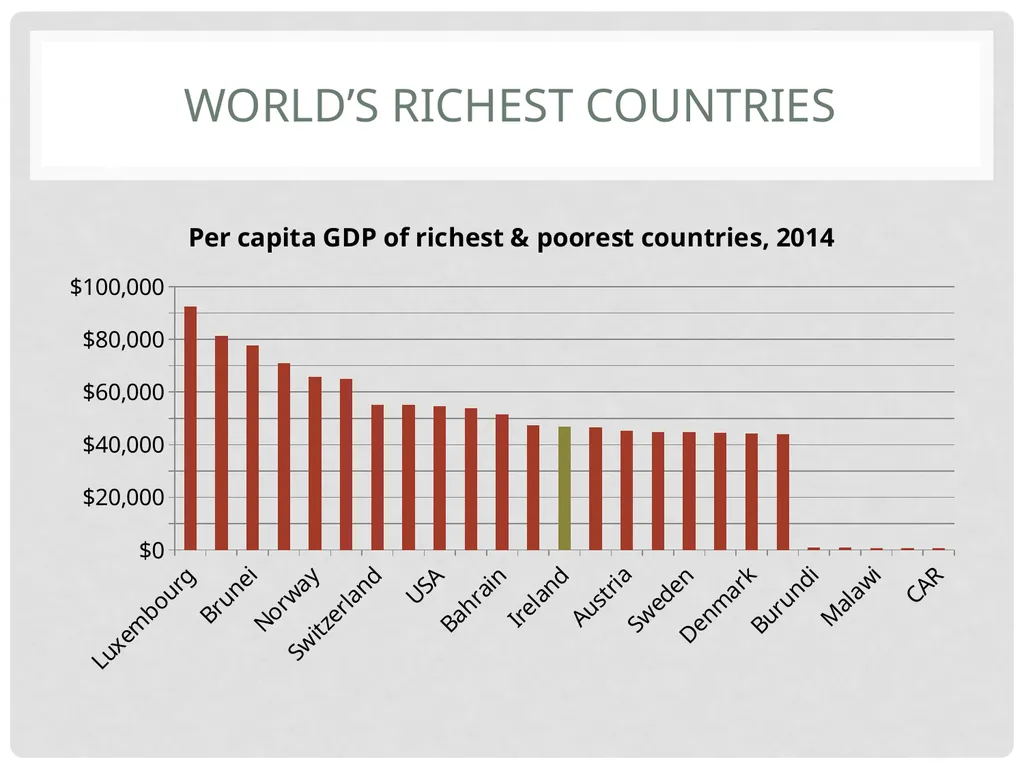
World’s Richest countries<br>
09
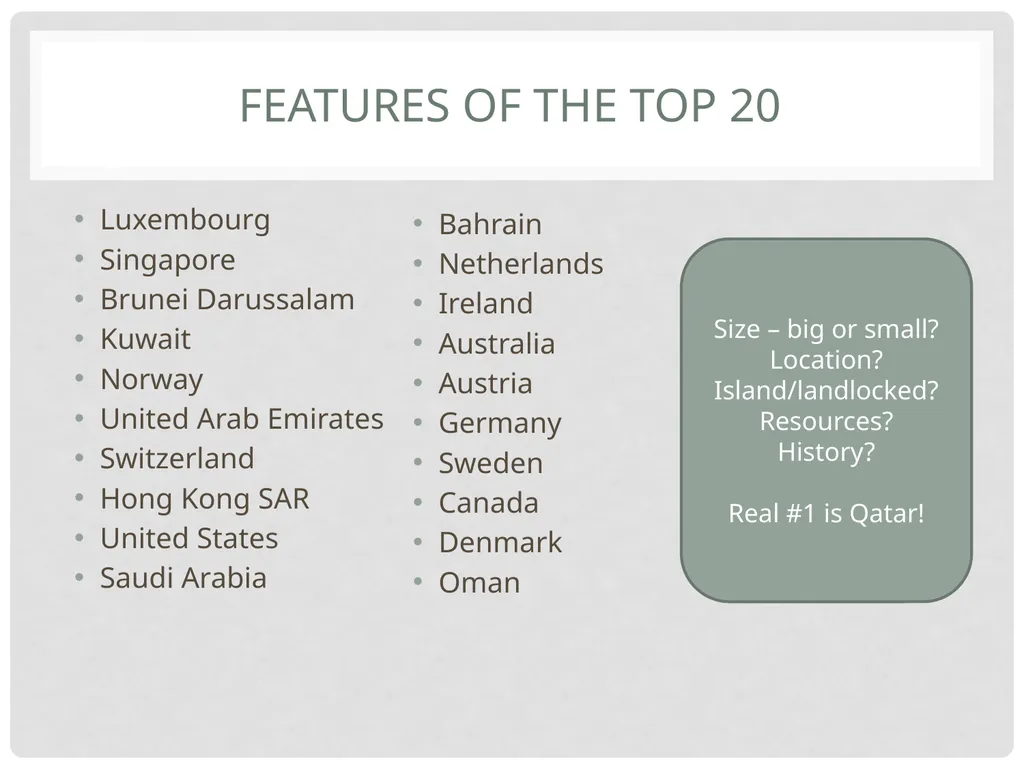
Features of the top 20 Luxembourg
Singapore
Brunei Darussalam
Kuwait
Norway
United Arab Emirates
Switzerland
Hong Kong SAR
United States
Saudi Arabia Bahrain
Netherlands
Ireland
Australia
Austria
Germany
Sweden
Canada
Denmark
Oman Size – big or small?
Location?
Island/landlocked?
Resources?
History?
Real #1 is Qatar!<br>
Singapore
Brunei Darussalam
Kuwait
Norway
United Arab Emirates
Switzerland
Hong Kong SAR
United States
Saudi Arabia Bahrain
Netherlands
Ireland
Australia
Austria
Germany
Sweden
Canada
Denmark
Oman Size – big or small?
Location?
Island/landlocked?
Resources?
History?
Real #1 is Qatar!<br>
10
Model of the entire economy How would you go about modelling an entire economy?
Not as complicated as it sounds: ultimately, in an economy, there are only sellers and buyers
Sellers provide a service
Sometimes that service is a physical item, a commodity like copper or merchandise such as TV – but even then its value lies in the service it provides
Buyers pay money in return<br>
Not as complicated as it sounds: ultimately, in an economy, there are only sellers and buyers
Sellers provide a service
Sometimes that service is a physical item, a commodity like copper or merchandise such as TV – but even then its value lies in the service it provides
Buyers pay money in return<br>
11
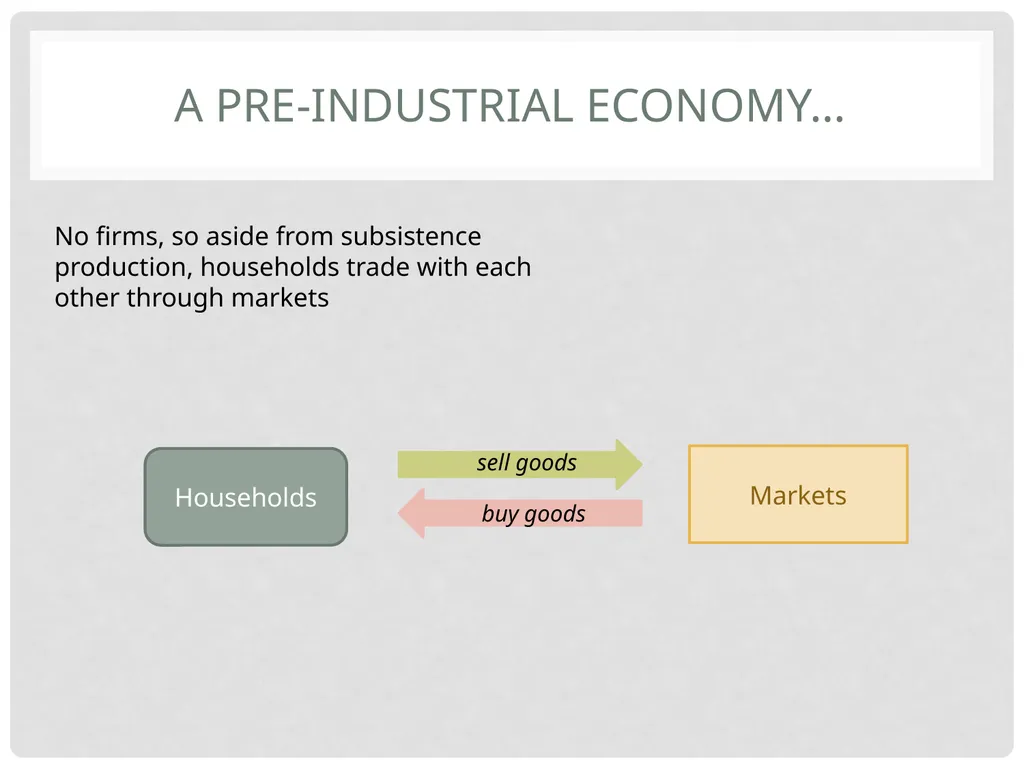
A pre-Industrial Economy… Households No firms, so aside from subsistence production, households trade with each other through markets Markets sell goods buy goods<br>
12
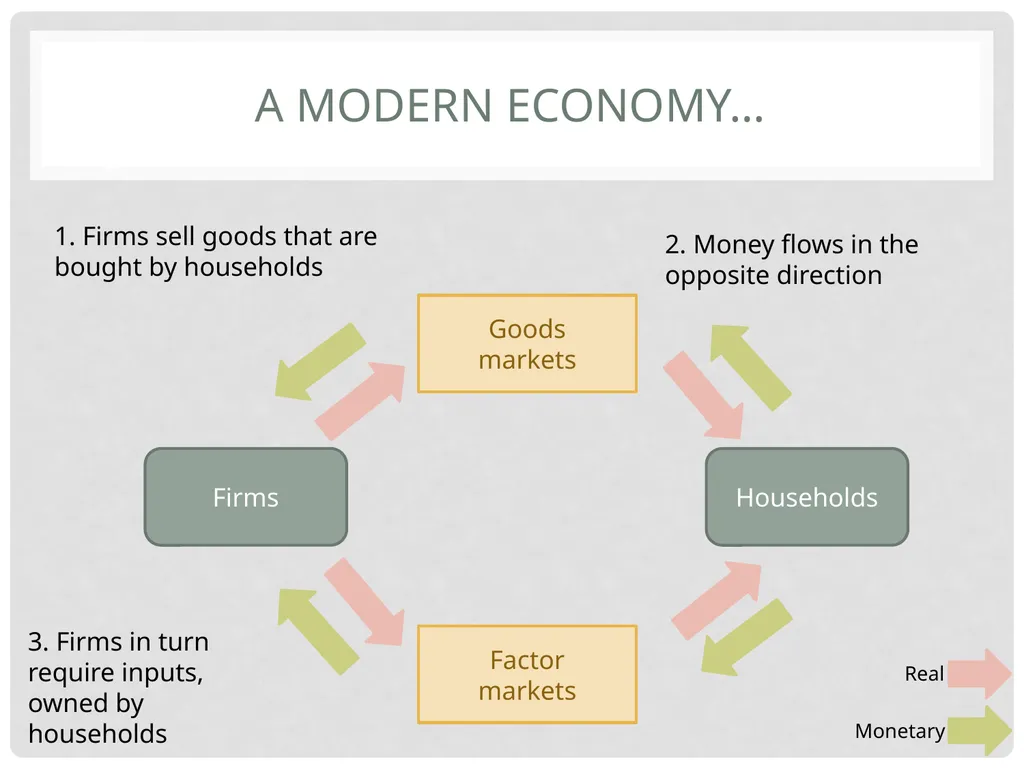
A Modern Economy… 1. Firms sell goods that are bought by households Goods
markets Households Factor
markets Firms 2. Money flows in the opposite direction 3. Firms in turn require inputs, owned by households Real Monetary<br>
markets Households Factor
markets Firms 2. Money flows in the opposite direction 3. Firms in turn require inputs, owned by households Real Monetary<br>
13
Notes on the circular flow Two important features about the ‘circular flow’ model of the economy
Every real flow has a corresponding monetary flow
Some of these may be imputed, e.g. stay-at-home spouse or owner-occupier’s rent
Someone’s expenditure is someone else’s income
Adding up income should be equivalent to adding up expenditure
In an economy like this, any injection (e.g. new deposit) would circulate around economy forever
No leakages – annual impact would depend on velocity<br>
Every real flow has a corresponding monetary flow
Some of these may be imputed, e.g. stay-at-home spouse or owner-occupier’s rent
Someone’s expenditure is someone else’s income
Adding up income should be equivalent to adding up expenditure
In an economy like this, any injection (e.g. new deposit) would circulate around economy forever
No leakages – annual impact would depend on velocity<br>
14
Developing the Circular Flow Three main additions to realism of the circular flow
Government – taxation, a payment by households to government in return for public goods
Banking – saving (non-consumption) generates an income (interest); the financial system transforms into lending (saving and investment as opposites)
Trade – final ‘leakage’ is spending on imports, offset (at least in part) by income from exports
These reduce the final economic impact of any injection into an economy<br>
Government – taxation, a payment by households to government in return for public goods
Banking – saving (non-consumption) generates an income (interest); the financial system transforms into lending (saving and investment as opposites)
Trade – final ‘leakage’ is spending on imports, offset (at least in part) by income from exports
These reduce the final economic impact of any injection into an economy<br>
15
Topic C: Structure The Economy & Economic Growth
Conceptualizing the economy
National income accounts
GDP, welfare and public policy
Efficiency and production possibilities
Modern economic growth
Productivity performance<br>
Conceptualizing the economy
National income accounts
GDP, welfare and public policy
Efficiency and production possibilities
Modern economic growth
Productivity performance<br>
16
Gross domestic product (GDP) “GDP is…
the market value
of all
final
goods and services
produced
within a country
in a given period of time” Usually a year but people also pay attention to quarterly figures In Ireland’s case, only what’s produced here, i.e. doesn’t include any output by a French company part-owned by an Irish household Only new goods counted – e.g. not 2nd-hand cars/homes To avoid double-counting, leaves out intermediate goods (e.g. paper supplies for greeting card company) Everything sold (previously just legally) in the economy Helps compare apples and oranges… everything expressed in euro<br>
the market value
of all
final
goods and services
produced
within a country
in a given period of time” Usually a year but people also pay attention to quarterly figures In Ireland’s case, only what’s produced here, i.e. doesn’t include any output by a French company part-owned by an Irish household Only new goods counted – e.g. not 2nd-hand cars/homes To avoid double-counting, leaves out intermediate goods (e.g. paper supplies for greeting card company) Everything sold (previously just legally) in the economy Helps compare apples and oranges… everything expressed in euro<br>
17
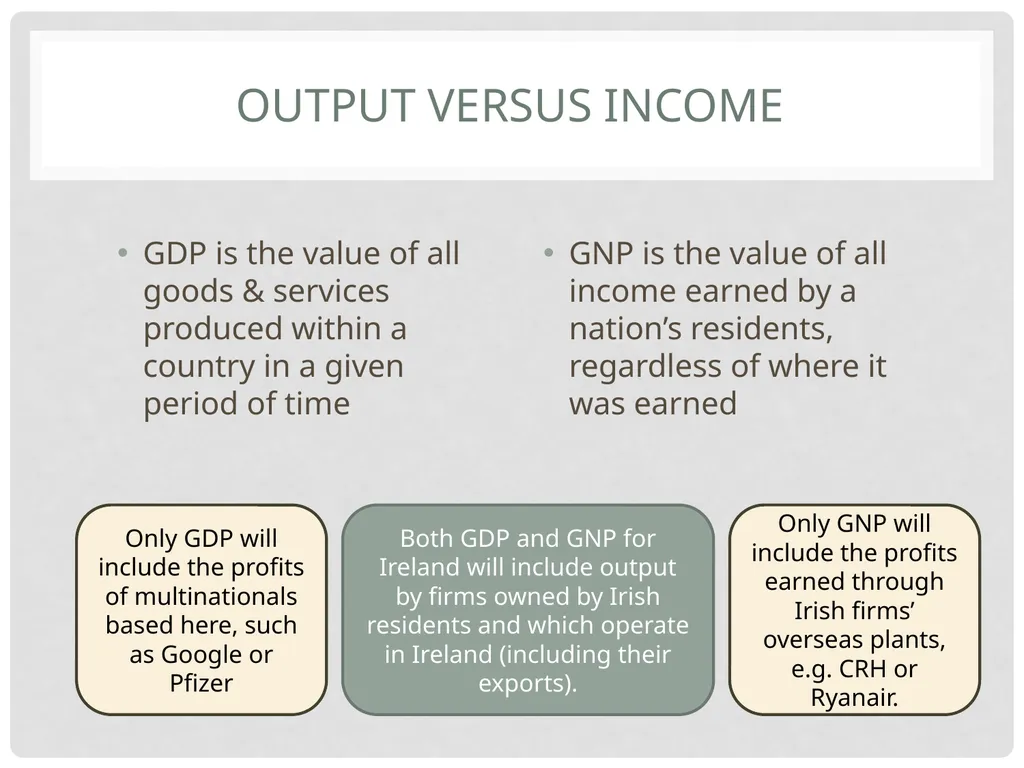
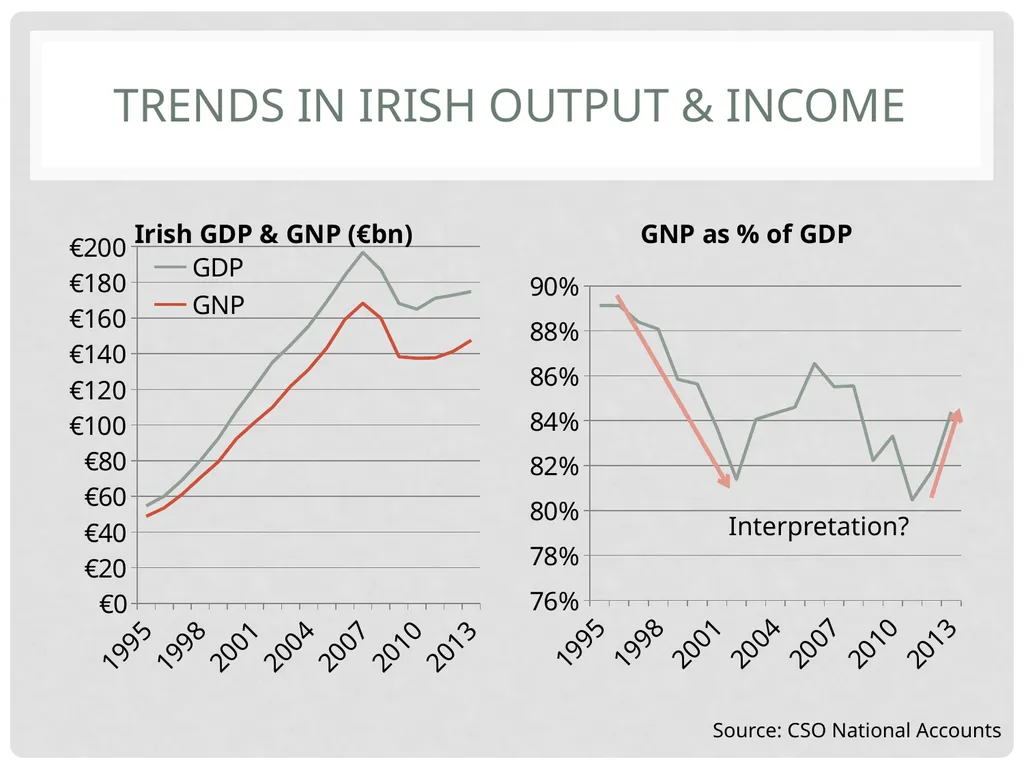
Output versus Income GDP is the value of all goods & services produced within a country in a given period of time GNP is the value of all income earned by a nation’s residents, regardless of where it was earned Both GDP and GNP for Ireland will include output by firms owned by Irish residents and which operate in Ireland (including their exports). Only GDP will include the profits of multinationals based here, such as Google or Pfizer Only GNP will include the profits earned through Irish firms’ overseas plants, e.g. CRH or Ryanair.<br>
18
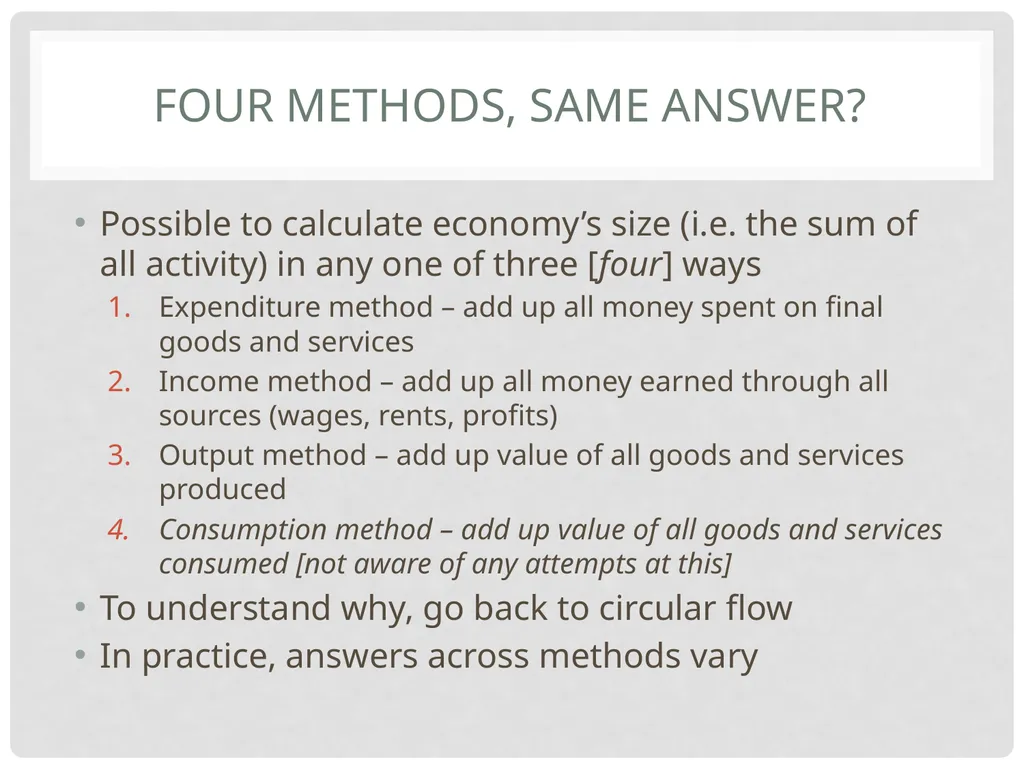
Four methods, same answer? Possible to calculate economy’s size (i.e. the sum of all activity) in any one of three [four] ways
Expenditure method – add up all money spent on final goods and services
Income method – add up all money earned through all sources (wages, rents, profits)
Output method – add up value of all goods and services produced
Consumption method – add up value of all goods and services consumed [not aware of any attempts at this]
To understand why, go back to circular flow
In practice, answers across methods vary<br>
Expenditure method – add up all money spent on final goods and services
Income method – add up all money earned through all sources (wages, rents, profits)
Output method – add up value of all goods and services produced
Consumption method – add up value of all goods and services consumed [not aware of any attempts at this]
To understand why, go back to circular flow
In practice, answers across methods vary<br>
19
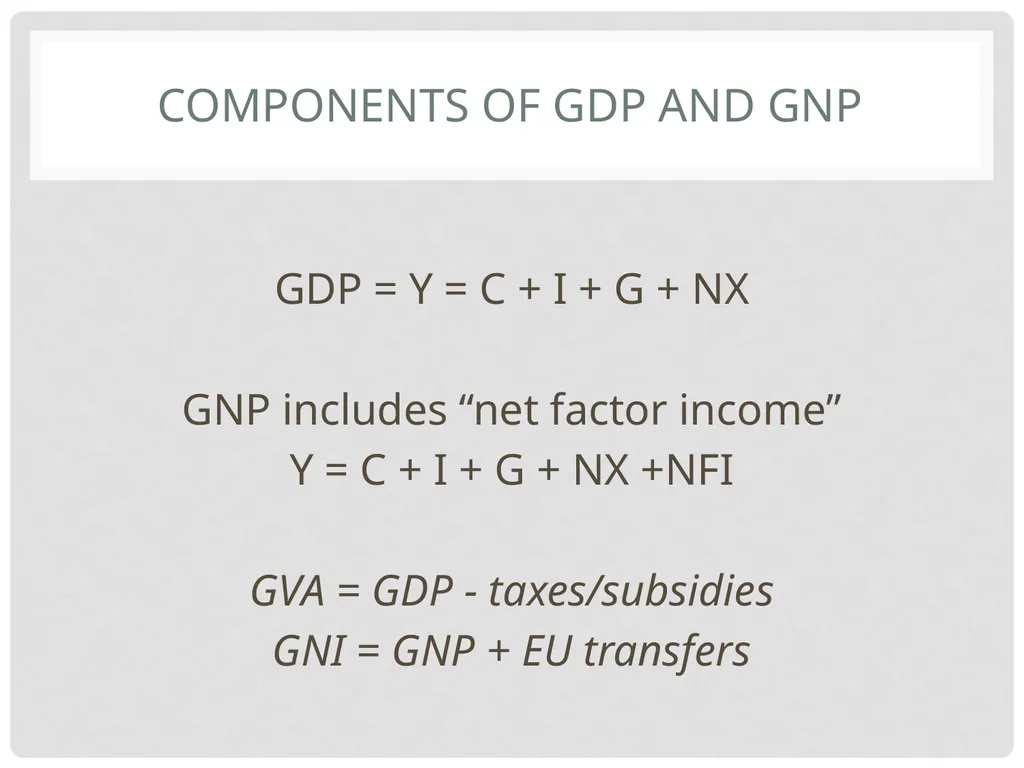
Components of GDP and GNP GDP = Y = C + I + G + NX
GNP includes “net factor income”
Y = C + I + G + NX +NFI
GVA = GDP - taxes/subsidies
GNI = GNP + EU transfers<br>
GNP includes “net factor income”
Y = C + I + G + NX +NFI
GVA = GDP - taxes/subsidies
GNI = GNP + EU transfers<br>
20
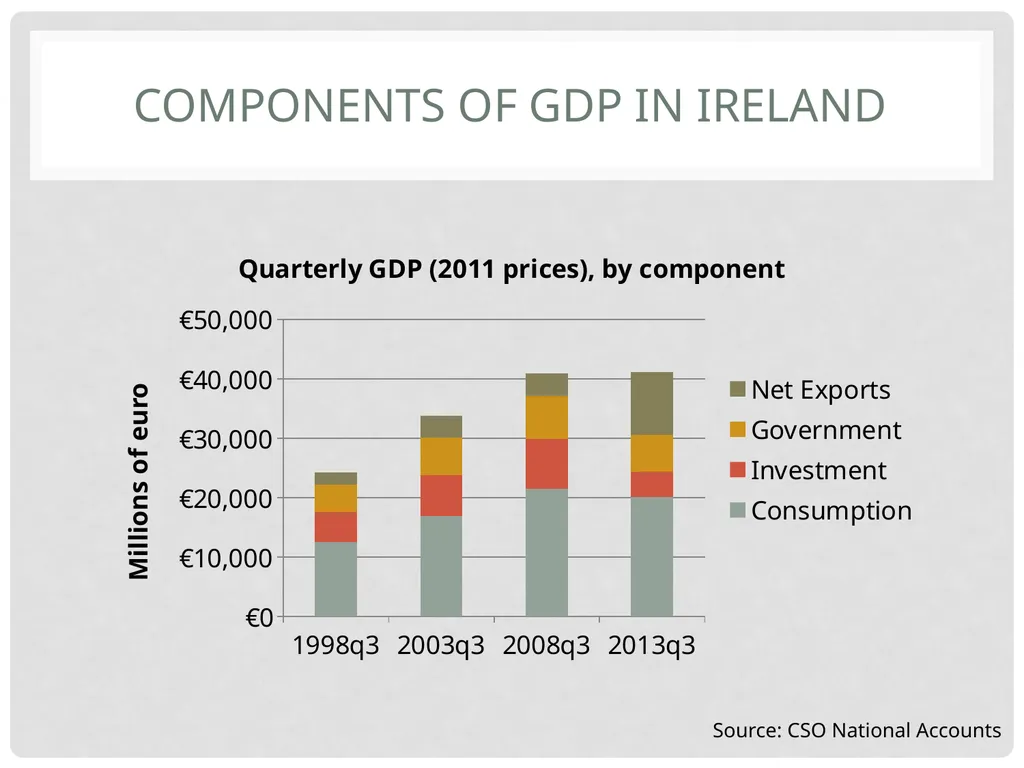
Components of GDP in Ireland Source: CSO National Accounts<br>
21
Trends in Irish output & income Interpretation? Source: CSO National Accounts<br>
22
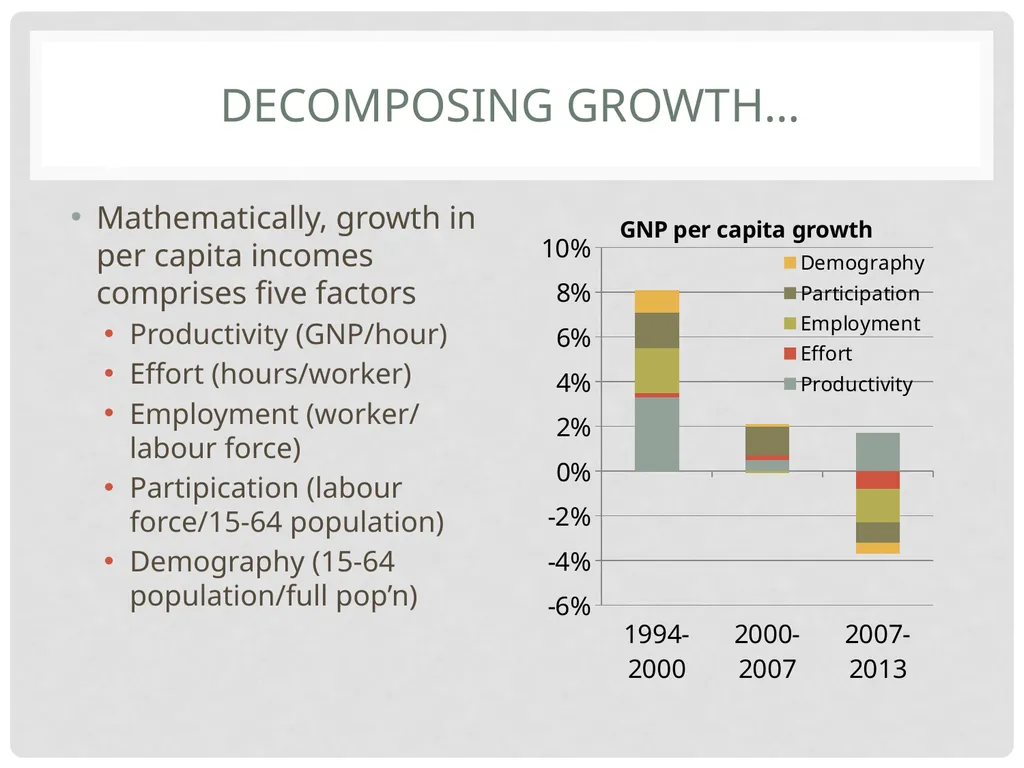
Decomposing growth… Mathematically, growth in per capita incomes comprises five factors
Productivity (GNP/hour)
Effort (hours/worker)
Employment (worker/ labour force)
Partipication (labour force/15-64 population)
Demography (15-64 population/full pop’n)<br>
Productivity (GNP/hour)
Effort (hours/worker)
Employment (worker/ labour force)
Partipication (labour force/15-64 population)
Demography (15-64 population/full pop’n)<br>
23
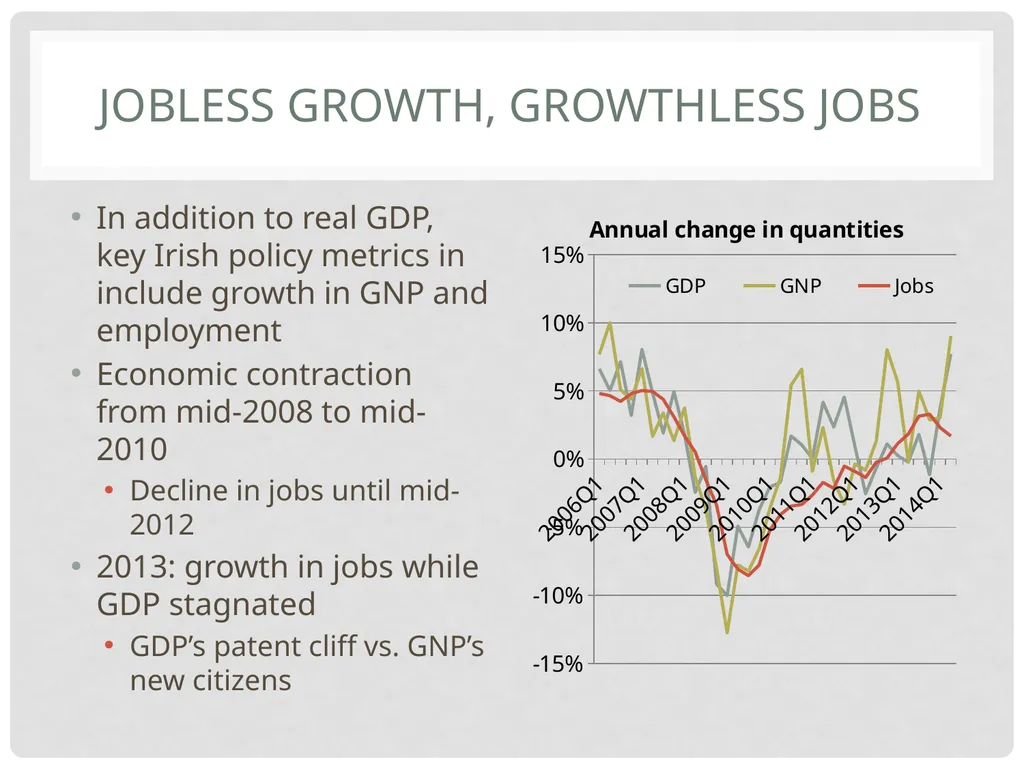
Jobless Growth, Growthless jobs In addition to real GDP, key Irish policy metrics in include growth in GNP and employment
Economic contraction from mid-2008 to mid-2010
Decline in jobs until mid-2012
2013: growth in jobs while GDP stagnated
GDP’s patent cliff vs. GNP’s new citizens<br>
Economic contraction from mid-2008 to mid-2010
Decline in jobs until mid-2012
2013: growth in jobs while GDP stagnated
GDP’s patent cliff vs. GNP’s new citizens<br>
24
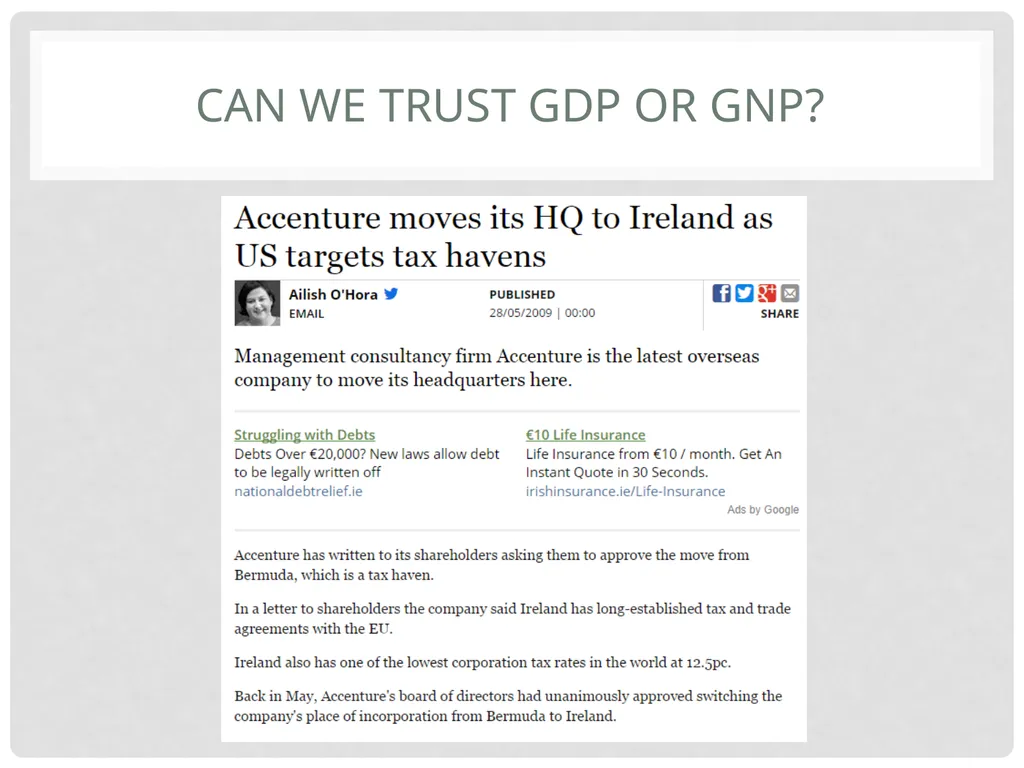
Can we Trust GDP or GNP?<br>
25
Topic C: Structure The Economy & Economic Growth
Conceptualizing the economy
National income accounts
GDP, welfare and public policy
Efficiency and production possibilities
Modern economic growth
Productivity performance<br>
Conceptualizing the economy
National income accounts
GDP, welfare and public policy
Efficiency and production possibilities
Modern economic growth
Productivity performance<br>
26
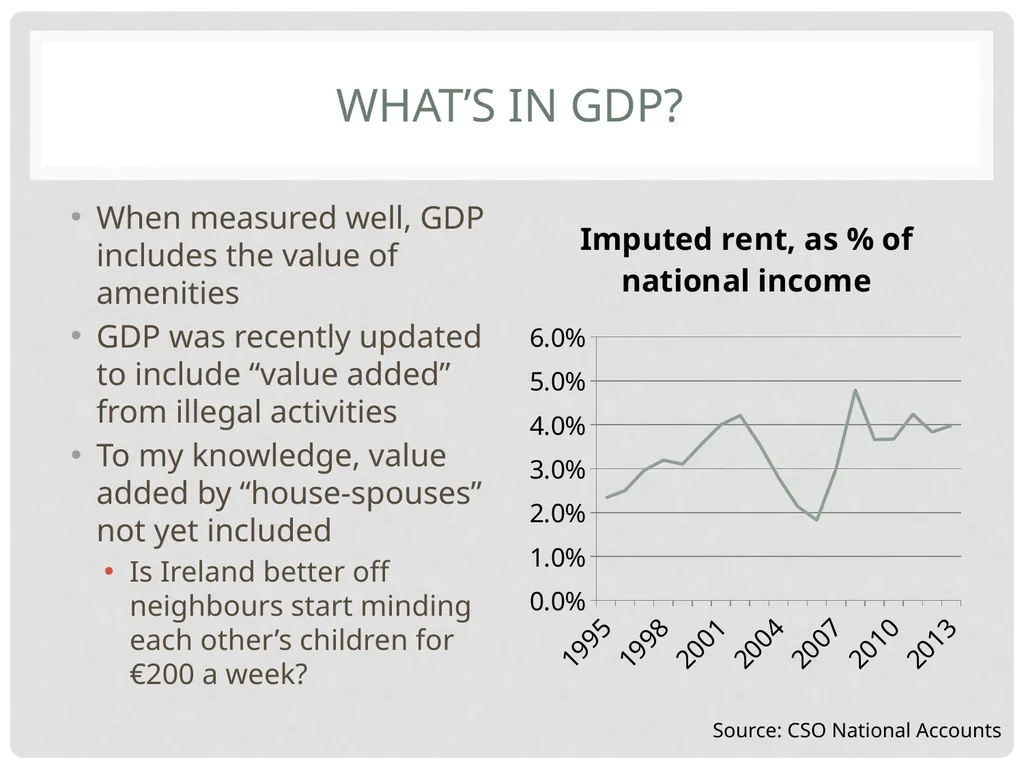
What’s in GDP? When measured well, GDP includes the value of amenities
GDP was recently updated to include “value added” from illegal activities
To my knowledge, value added by “house-spouses” not yet included
Is Ireland better off neighbours start minding each other’s children for €200 a week? Source: CSO National Accounts<br>
GDP was recently updated to include “value added” from illegal activities
To my knowledge, value added by “house-spouses” not yet included
Is Ireland better off neighbours start minding each other’s children for €200 a week? Source: CSO National Accounts<br>
27
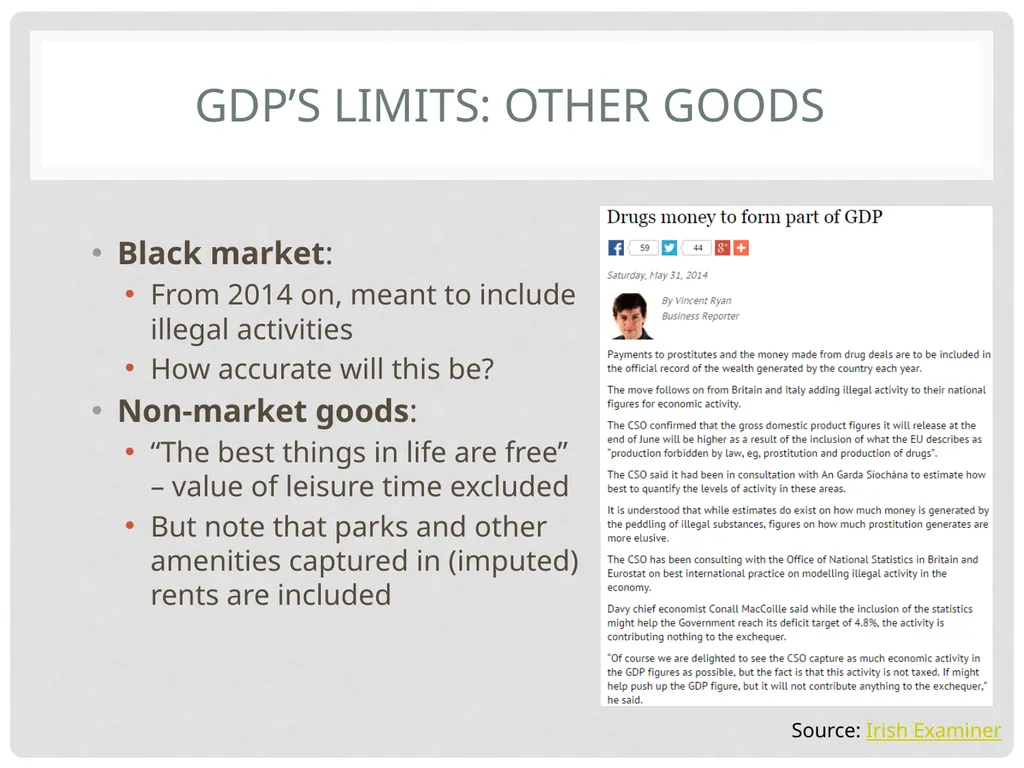
GDP’s limits: other goods Black market:
From 2014 on, meant to include illegal activities
How accurate will this be?
Non-market goods:
“The best things in life are free” – value of leisure time excluded
But note that parks and other amenities captured in (imputed) rents are included Source: Irish Examiner<br>
From 2014 on, meant to include illegal activities
How accurate will this be?
Non-market goods:
“The best things in life are free” – value of leisure time excluded
But note that parks and other amenities captured in (imputed) rents are included Source: Irish Examiner<br>
28
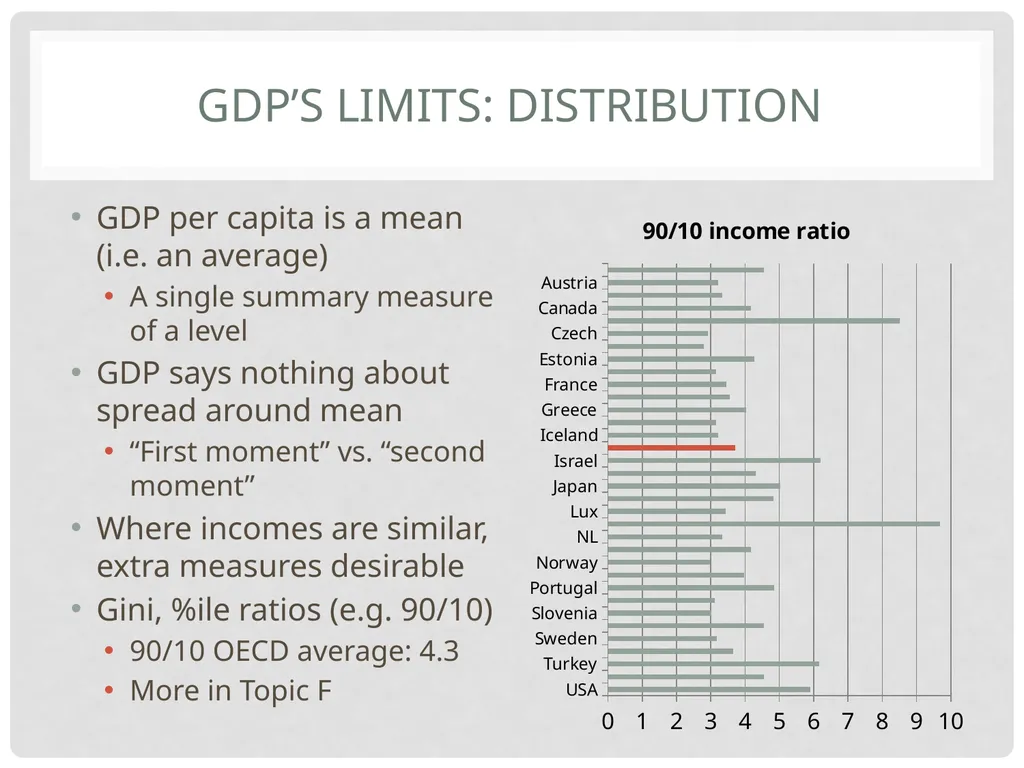
GDP’s Limits: Distribution GDP per capita is a mean (i.e. an average)
A single summary measure of a level
GDP says nothing about spread around mean
“First moment” vs. “second moment”
Where incomes are similar, extra measures desirable
Gini, %ile ratios (e.g. 90/10)
90/10 OECD average: 4.3
More in Topic F<br>
A single summary measure of a level
GDP says nothing about spread around mean
“First moment” vs. “second moment”
Where incomes are similar, extra measures desirable
Gini, %ile ratios (e.g. 90/10)
90/10 OECD average: 4.3
More in Topic F<br>
29
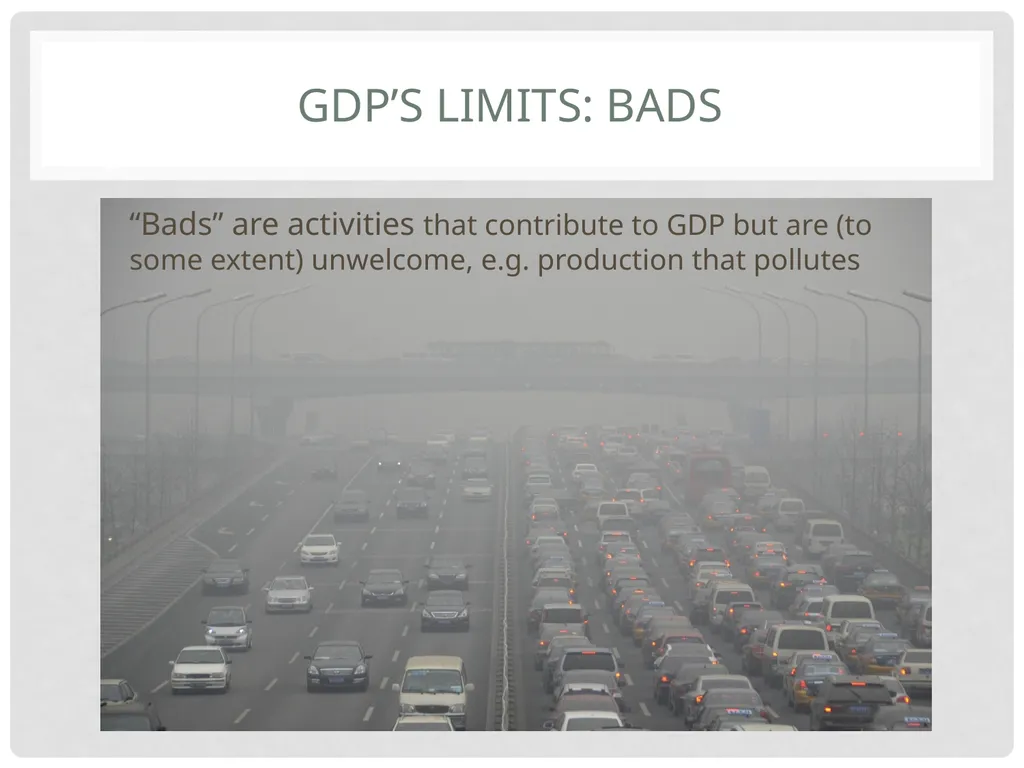
GDP’s limits: bads “Bads” are activities that contribute to GDP but are (to some extent) unwelcome, e.g. production that pollutes<br>
30
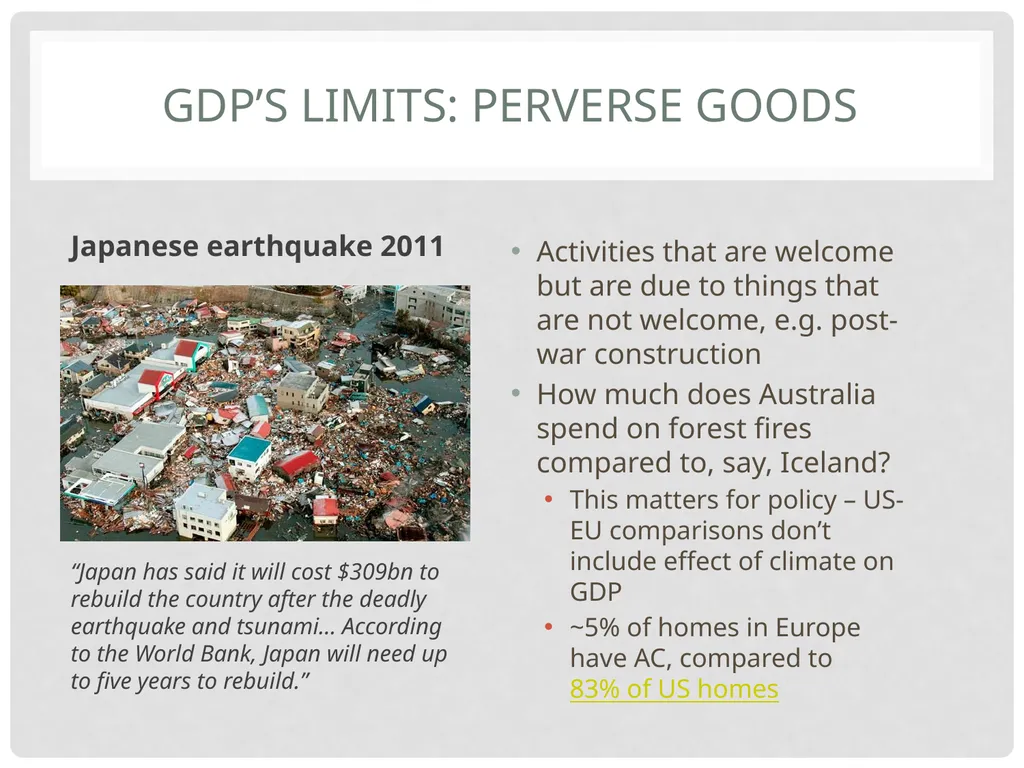
GDP’s limits: Perverse goods Activities that are welcome but are due to things that are not welcome, e.g. post-war construction
How much does Australia spend on forest fires compared to, say, Iceland?
This matters for policy – US-EU comparisons don’t include effect of climate on GDP
~5% of homes in Europe have AC, compared to 83% of US homes Japanese earthquake 2011 “Japan has said it will cost $309bn to rebuild the country after the deadly earthquake and tsunami… According to the World Bank, Japan will need up to five years to rebuild.”<br>
How much does Australia spend on forest fires compared to, say, Iceland?
This matters for policy – US-EU comparisons don’t include effect of climate on GDP
~5% of homes in Europe have AC, compared to 83% of US homes Japanese earthquake 2011 “Japan has said it will cost $309bn to rebuild the country after the deadly earthquake and tsunami… According to the World Bank, Japan will need up to five years to rebuild.”<br>
31
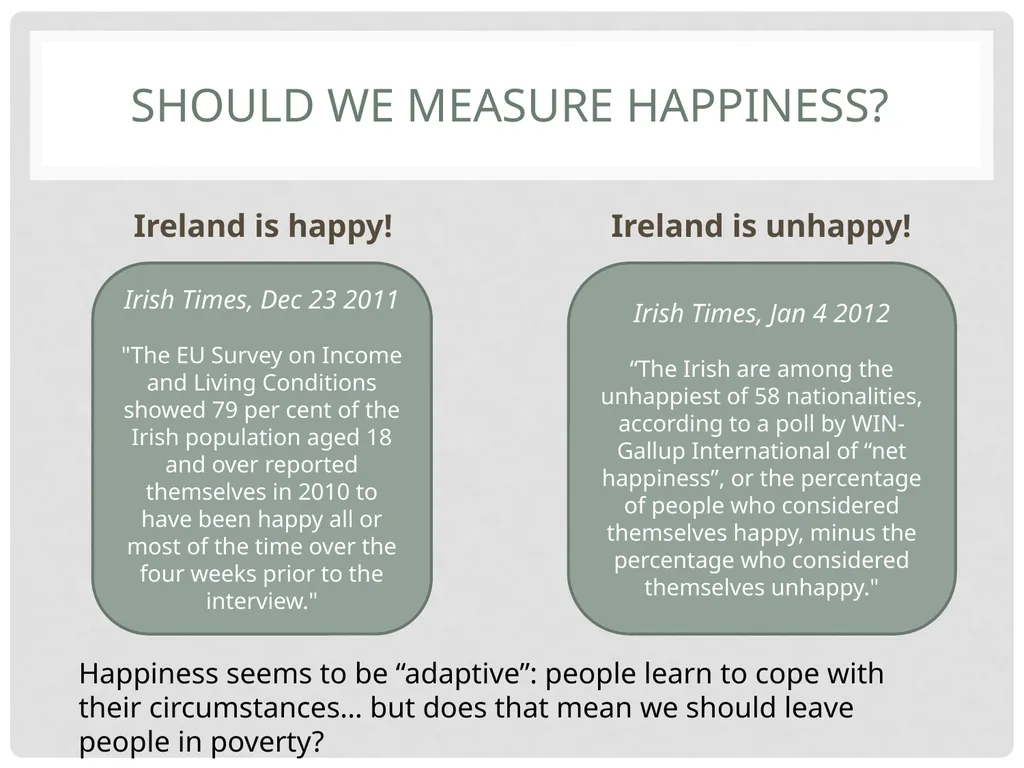
Should we measure happiness? Ireland is happy! Ireland is unhappy! Irish Times, Dec 23 2011
"The EU Survey on Income and Living Conditions showed 79 per cent of the Irish population aged 18 and over reported themselves in 2010 to have been happy all or most of the time over the four weeks prior to the interview." Irish Times, Jan 4 2012
“The Irish are among the unhappiest of 58 nationalities, according to a poll by WIN-Gallup International of “net happiness”, or the percentage of people who considered themselves happy, minus the percentage who considered themselves unhappy." Happiness seems to be “adaptive”: people learn to cope with their circumstances… but does that mean we should leave people in poverty?<br>
"The EU Survey on Income and Living Conditions showed 79 per cent of the Irish population aged 18 and over reported themselves in 2010 to have been happy all or most of the time over the four weeks prior to the interview." Irish Times, Jan 4 2012
“The Irish are among the unhappiest of 58 nationalities, according to a poll by WIN-Gallup International of “net happiness”, or the percentage of people who considered themselves happy, minus the percentage who considered themselves unhappy." Happiness seems to be “adaptive”: people learn to cope with their circumstances… but does that mean we should leave people in poverty?<br>
32
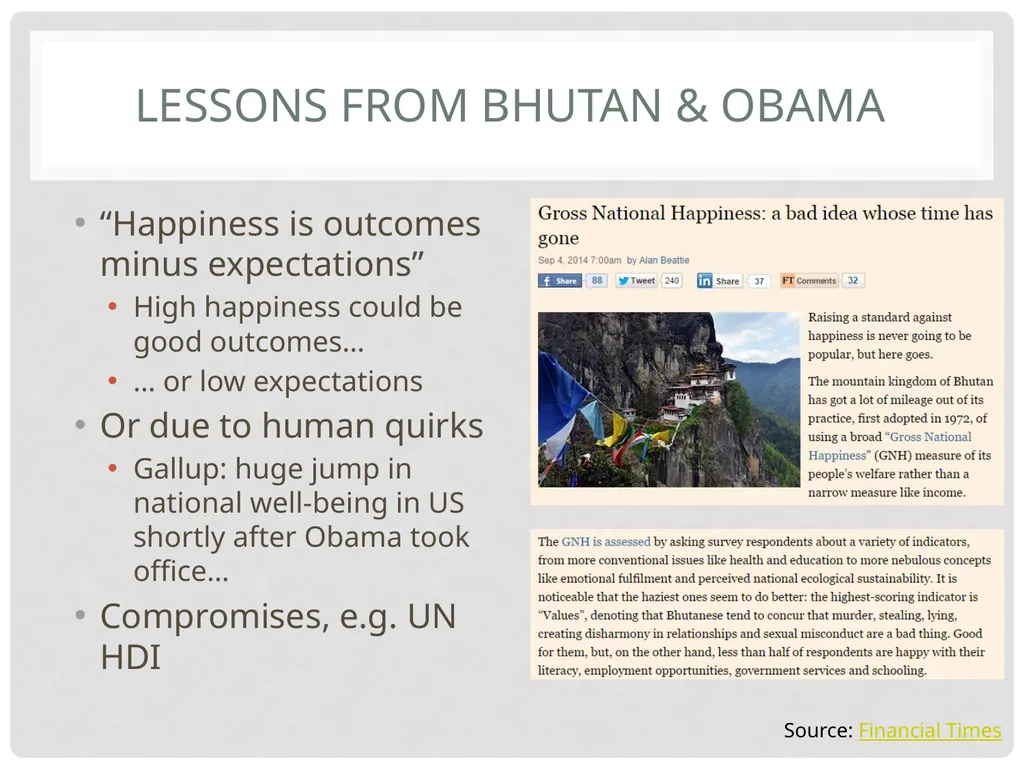
Lessons from Bhutan & OBAMA “Happiness is outcomes minus expectations”
High happiness could be good outcomes…
… or low expectations
Or due to human quirks
Gallup: huge jump in national well-being in US shortly after Obama took office…
Compromises, e.g. UN HDI Source: Financial Times<br>
High happiness could be good outcomes…
… or low expectations
Or due to human quirks
Gallup: huge jump in national well-being in US shortly after Obama took office…
Compromises, e.g. UN HDI Source: Financial Times<br>
33
Topic C: Structure The Economy & Economic Growth
Conceptualizing the economy
National income accounts
GDP, welfare and public policy
Efficiency and production possibilities
Modern economic growth
Productivity performance<br>
Conceptualizing the economy
National income accounts
GDP, welfare and public policy
Efficiency and production possibilities
Modern economic growth
Productivity performance<br>
34
From Expenditure to Output So far, thinking about GDP as the sum of all expenditure – C, I, G, NX
Remember that GDP is also the sum of all income, in wages, profits, rents, etc.
GDP is the flow accruing to factors of production
Stocks vs. flows
Three main factors of production
L: Labour, or human capital
N: Land, or natural capital
K: Physical & financial capital – formed by investment
The relationship between inputs and outputs is ‘technology’, A<br>
Remember that GDP is also the sum of all income, in wages, profits, rents, etc.
GDP is the flow accruing to factors of production
Stocks vs. flows
Three main factors of production
L: Labour, or human capital
N: Land, or natural capital
K: Physical & financial capital – formed by investment
The relationship between inputs and outputs is ‘technology’, A<br>
35
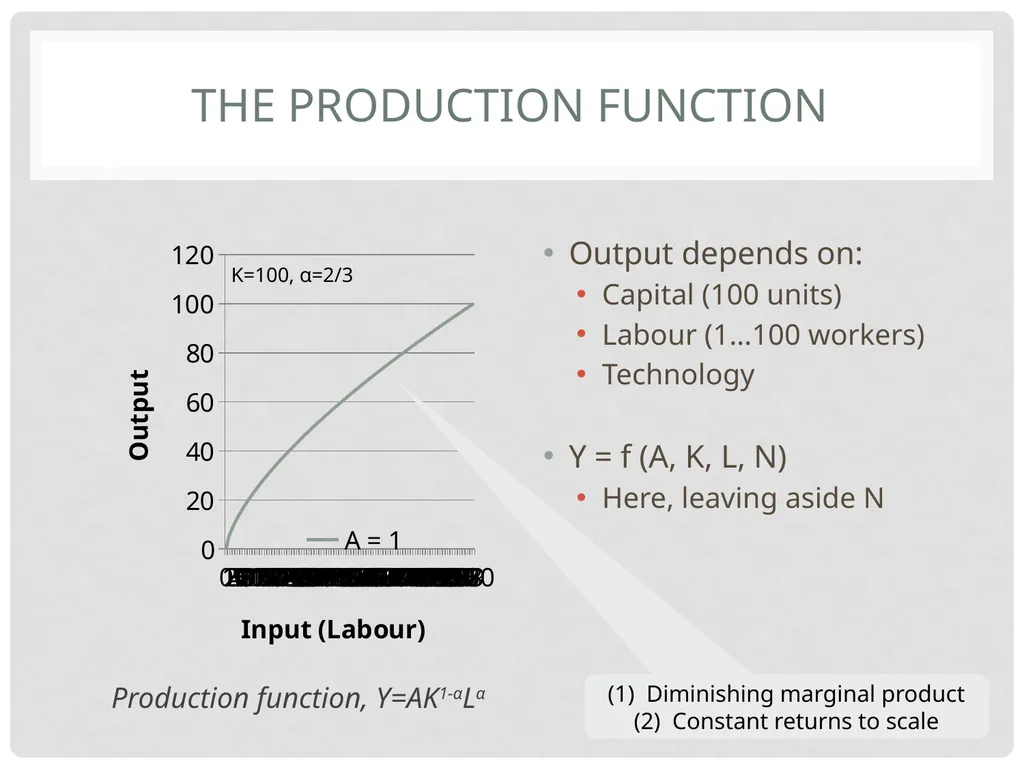
The production function Output depends on:
Capital (100 units)
Labour (1…100 workers)
Technology
Y = f (A, K, L, N)
Here, leaving aside N Diminishing marginal product
Constant returns to scale K=100, α=2/3 Production function, Y=AK1-αLα<br>
Capital (100 units)
Labour (1…100 workers)
Technology
Y = f (A, K, L, N)
Here, leaving aside N Diminishing marginal product
Constant returns to scale K=100, α=2/3 Production function, Y=AK1-αLα<br>
36
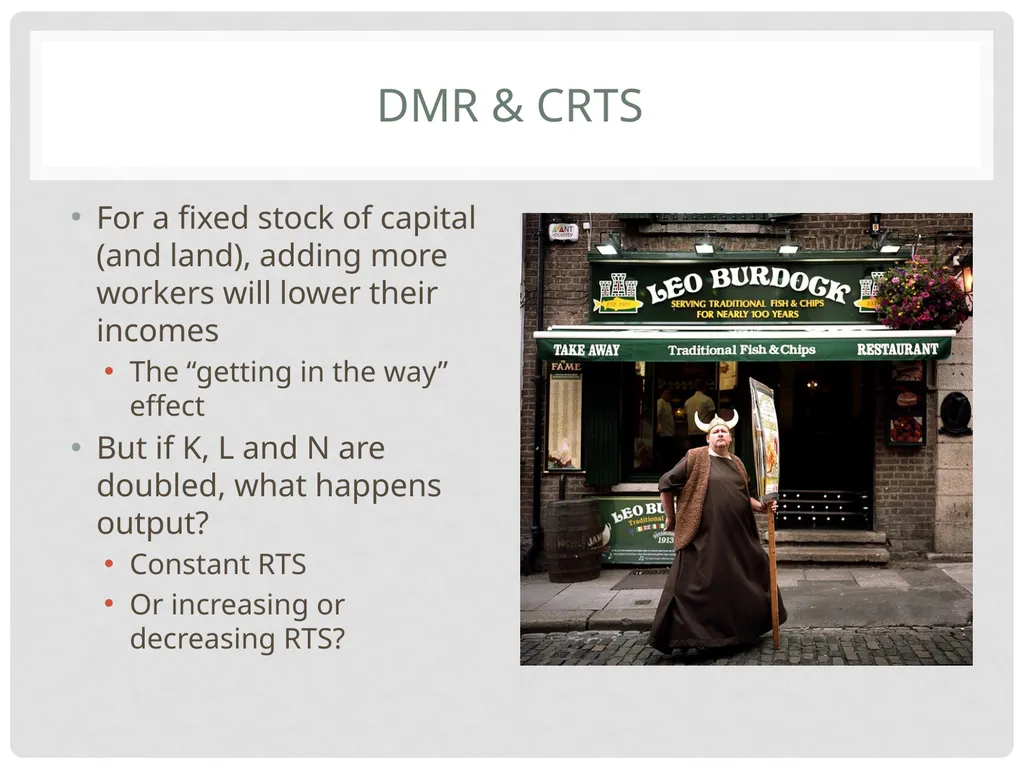
DMR & CRTS For a fixed stock of capital (and land), adding more workers will lower their incomes
The “getting in the way” effect
But if K, L and N are doubled, what happens output?
Constant RTS
Or increasing or decreasing RTS?<br>
The “getting in the way” effect
But if K, L and N are doubled, what happens output?
Constant RTS
Or increasing or decreasing RTS?<br>
37
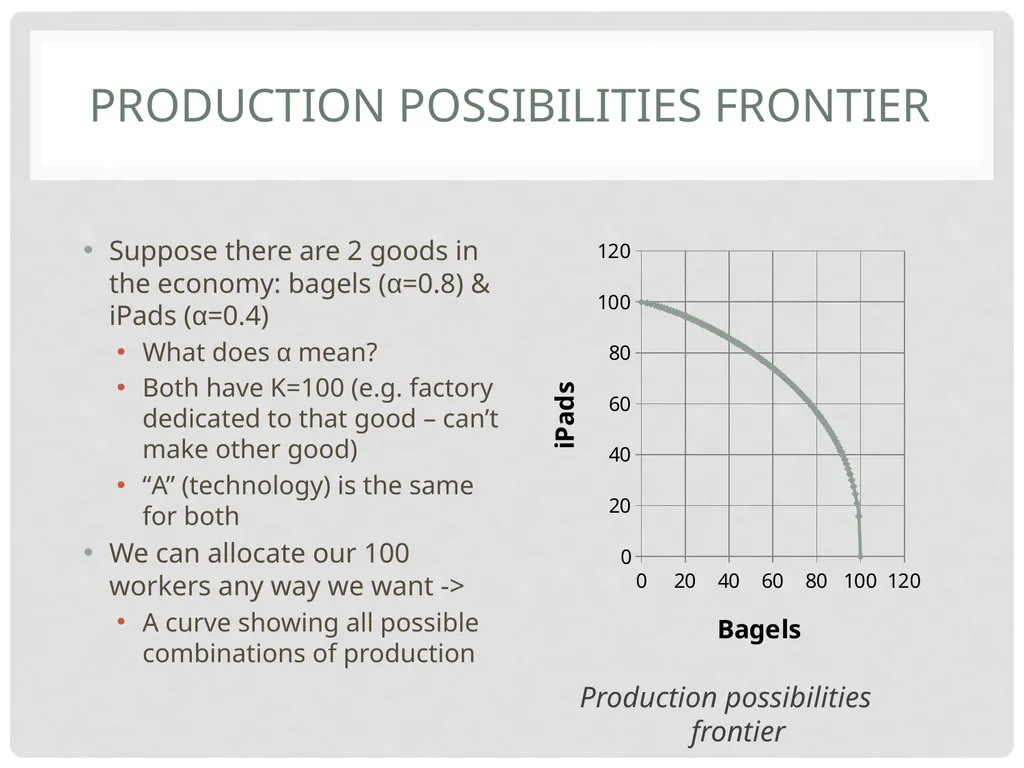
production possibilities frontier Suppose there are 2 goods in the economy: bagels (α=0.8) & iPads (α=0.4)
What does α mean?
Both have K=100 (e.g. factory dedicated to that good – can’t make other good)
“A” (technology) is the same for both
We can allocate our 100 workers any way we want ->
A curve showing all possible combinations of production Production possibilities frontier<br>
What does α mean?
Both have K=100 (e.g. factory dedicated to that good – can’t make other good)
“A” (technology) is the same for both
We can allocate our 100 workers any way we want ->
A curve showing all possible combinations of production Production possibilities frontier<br>
38
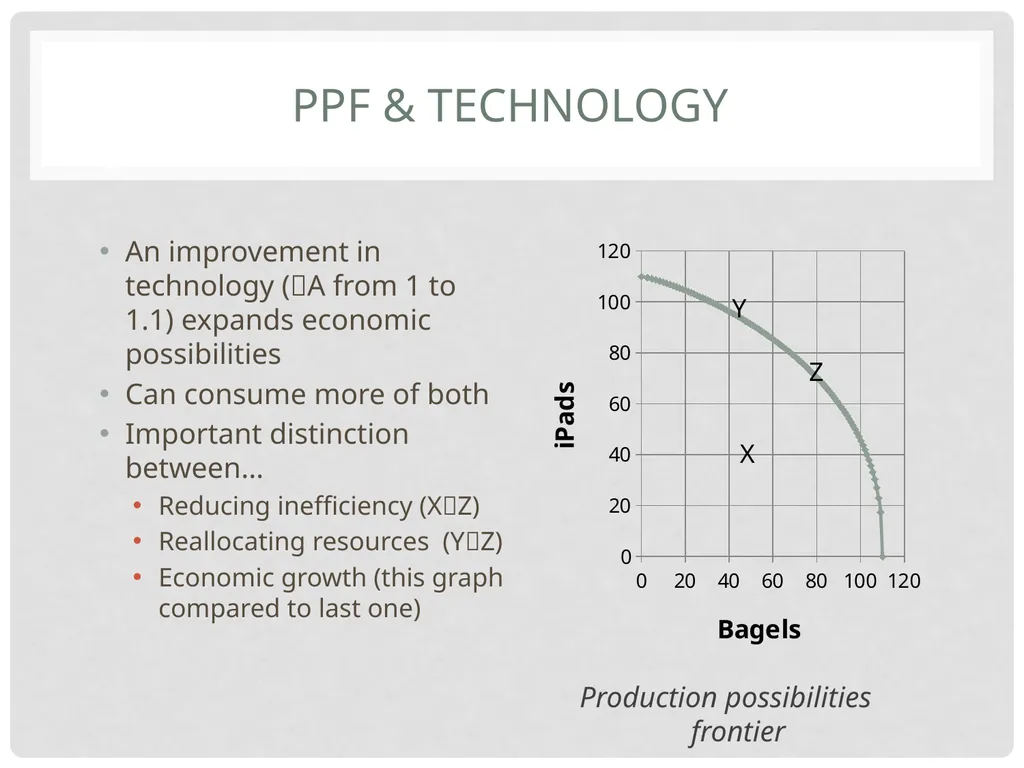
PPF & Technology An improvement in technology (A from 1 to 1.1) expands economic possibilities
Can consume more of both
Important distinction between…
Reducing inefficiency (XZ)
Reallocating resources (YZ)
Economic growth (this graph compared to last one) Production possibilities frontier X Y Z<br>
Can consume more of both
Important distinction between…
Reducing inefficiency (XZ)
Reallocating resources (YZ)
Economic growth (this graph compared to last one) Production possibilities frontier X Y Z<br>
39
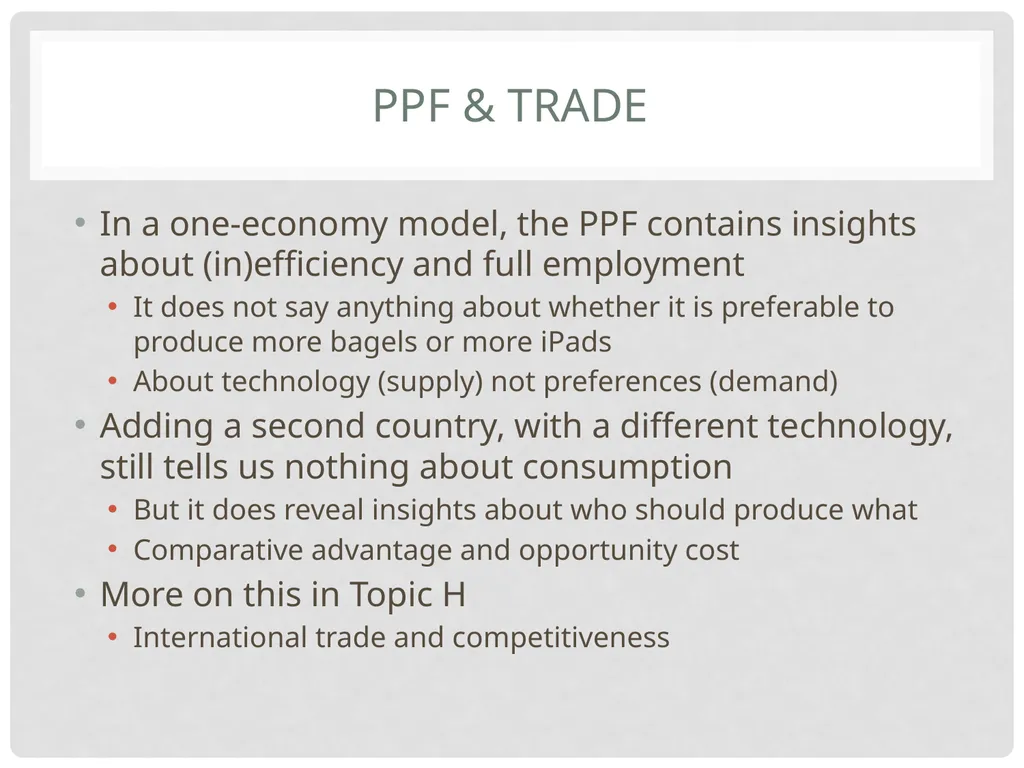
PPF & Trade In a one-economy model, the PPF contains insights about (in)efficiency and full employment
It does not say anything about whether it is preferable to produce more bagels or more iPads
About technology (supply) not preferences (demand)
Adding a second country, with a different technology, still tells us nothing about consumption
But it does reveal insights about who should produce what
Comparative advantage and opportunity cost
More on this in Topic H
International trade and competitiveness<br>
It does not say anything about whether it is preferable to produce more bagels or more iPads
About technology (supply) not preferences (demand)
Adding a second country, with a different technology, still tells us nothing about consumption
But it does reveal insights about who should produce what
Comparative advantage and opportunity cost
More on this in Topic H
International trade and competitiveness<br>
40
Topic C: Structure The Economy & Economic Growth
Conceptualizing the economy
National income accounts
GDP, welfare and public policy
Efficiency and production possibilities
Modern economic growth
Productivity performance<br>
Conceptualizing the economy
National income accounts
GDP, welfare and public policy
Efficiency and production possibilities
Modern economic growth
Productivity performance<br>
41
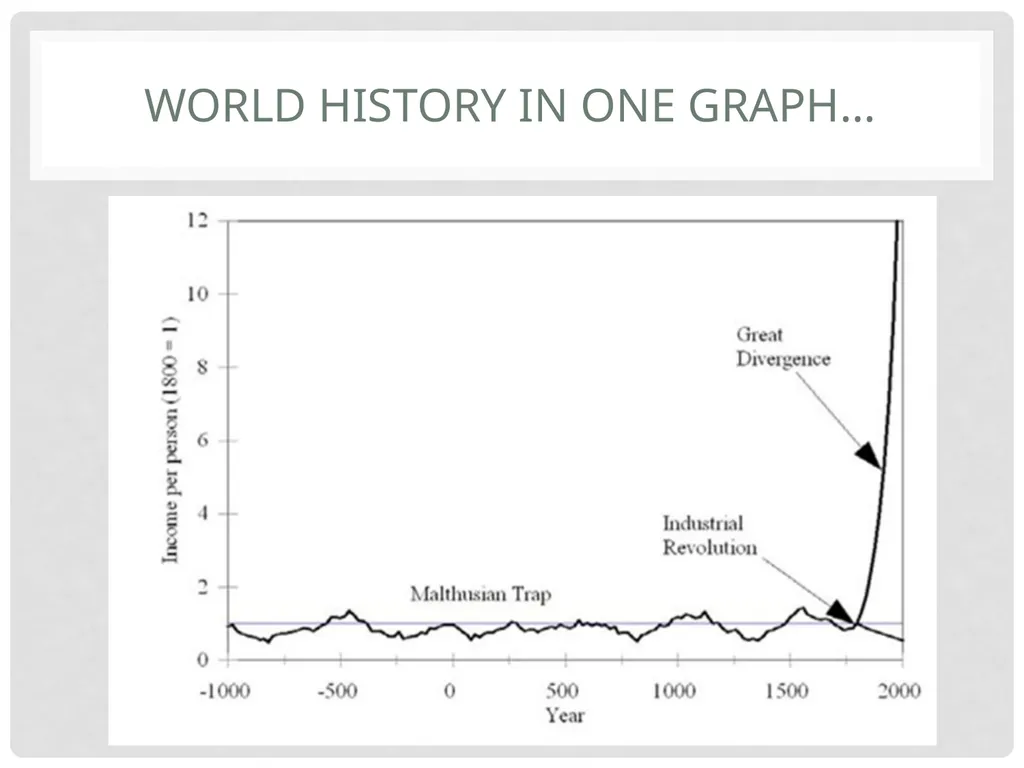
World History in One Graph…<br>
42
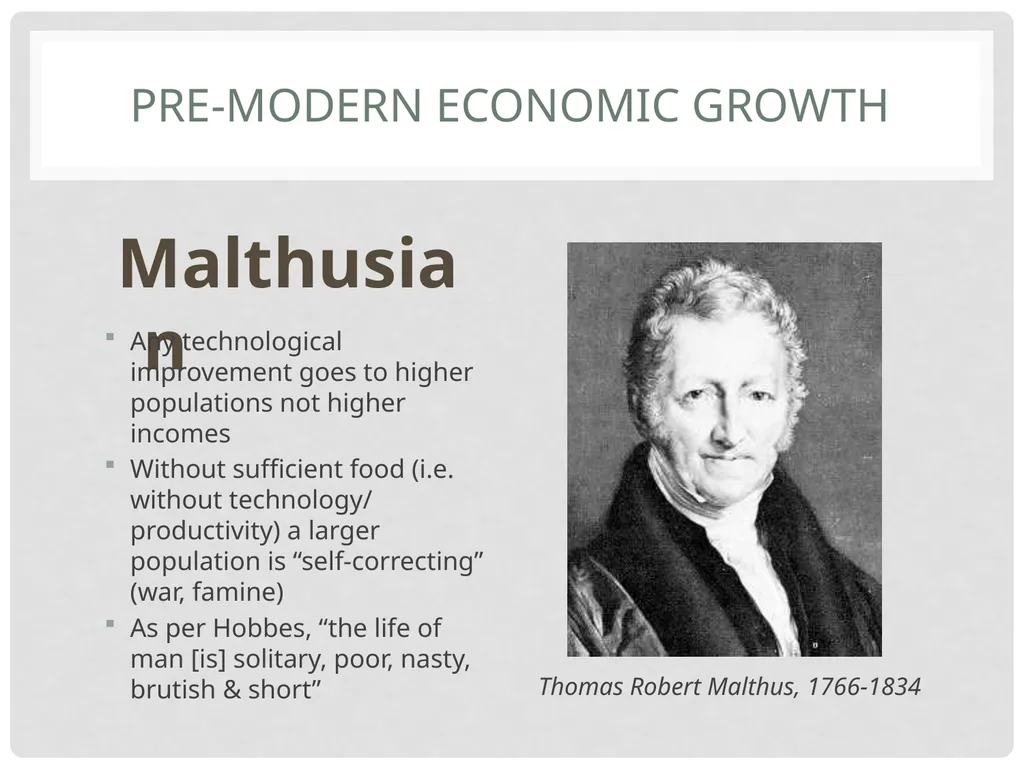
Pre-Modern Economic Growth Malthusian Thomas Robert Malthus, 1766-1834 Any technological improvement goes to higher populations not higher incomes
Without sufficient food (i.e. without technology/ productivity) a larger population is “self-correcting” (war, famine)
As per Hobbes, “the life of man [is] solitary, poor, nasty, brutish & short”<br>
Without sufficient food (i.e. without technology/ productivity) a larger population is “self-correcting” (war, famine)
As per Hobbes, “the life of man [is] solitary, poor, nasty, brutish & short”<br>
43
Switching growth on? How did the trend level of growth in average incomes go from 0% to 2-3%?
Technological progress – in the cotton industry first – is at the heart of the first escape from the Malthusian Trap
Britain in the late 1700s and early 1800s – cf. Topic A
Modern economic growth has spread to most parts of the world in the last two centuries
What does this tell us about how less developed countries today can embark on economic growth?
Need a conceptual framework and theory of economic growth<br>
Technological progress – in the cotton industry first – is at the heart of the first escape from the Malthusian Trap
Britain in the late 1700s and early 1800s – cf. Topic A
Modern economic growth has spread to most parts of the world in the last two centuries
What does this tell us about how less developed countries today can embark on economic growth?
Need a conceptual framework and theory of economic growth<br>
44
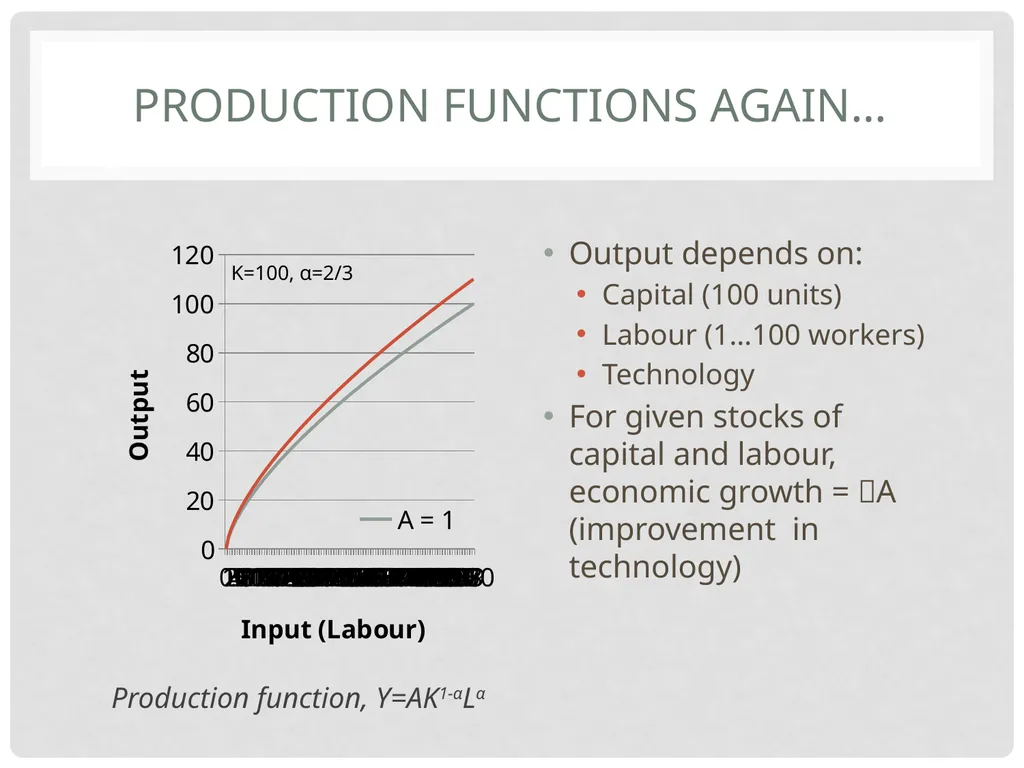
production functions AGAIN… Output depends on:
Capital (100 units)
Labour (1…100 workers)
Technology
For given stocks of capital and labour, economic growth = A (improvement in technology) Production function, Y=AK1-αLα K=100, α=2/3<br>
Capital (100 units)
Labour (1…100 workers)
Technology
For given stocks of capital and labour, economic growth = A (improvement in technology) Production function, Y=AK1-αLα K=100, α=2/3<br>
45
Aggregate vs. Per Capita Aggregate GDP
Y = f (A, K, L, N)
An increase in L leads to an increase GDP (US vs. Ireland)
Per capita GDP
Y/L = f (A, K, N)
With N fixed, growth in per capita output comes from A, K
Hence the focus on…
Attracting capital
Technological progress
Remember that A = “broad technology”
E.g. reducing inefficient processes increases A<br>
Y = f (A, K, L, N)
An increase in L leads to an increase GDP (US vs. Ireland)
Per capita GDP
Y/L = f (A, K, N)
With N fixed, growth in per capita output comes from A, K
Hence the focus on…
Attracting capital
Technological progress
Remember that A = “broad technology”
E.g. reducing inefficient processes increases A<br>
46
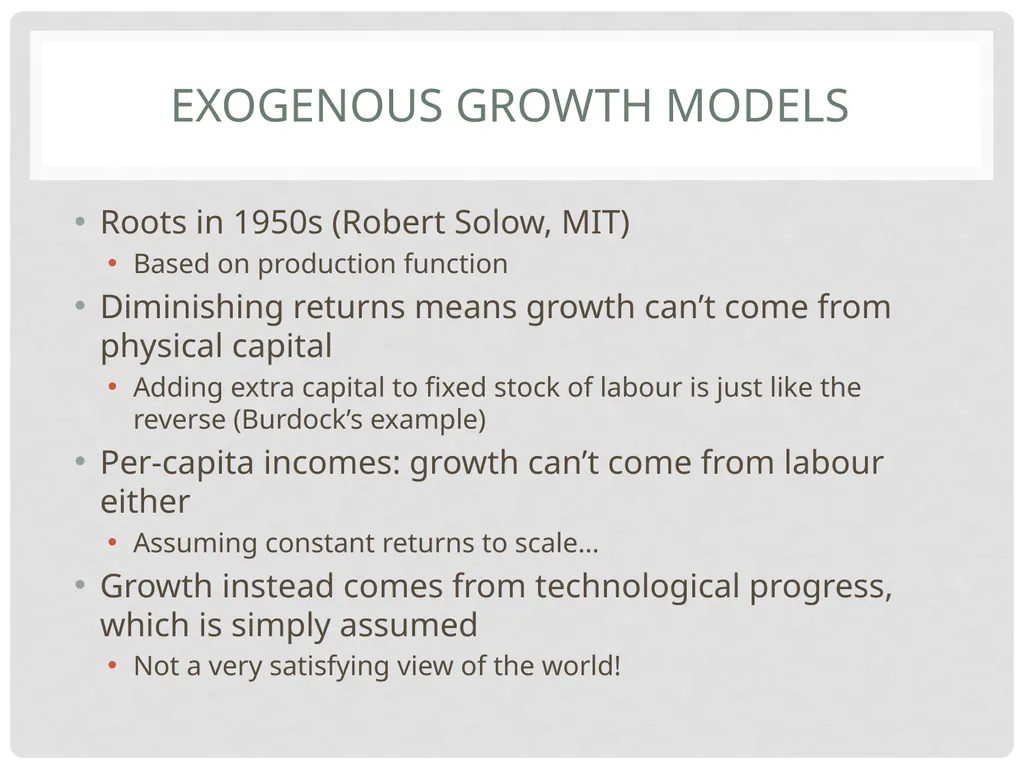
Exogenous growth models Roots in 1950s (Robert Solow, MIT)
Based on production function
Diminishing returns means growth can’t come from physical capital
Adding extra capital to fixed stock of labour is just like the reverse (Burdock’s example)
Per-capita incomes: growth can’t come from labour either
Assuming constant returns to scale…
Growth instead comes from technological progress, which is simply assumed
Not a very satisfying view of the world!<br>
Based on production function
Diminishing returns means growth can’t come from physical capital
Adding extra capital to fixed stock of labour is just like the reverse (Burdock’s example)
Per-capita incomes: growth can’t come from labour either
Assuming constant returns to scale…
Growth instead comes from technological progress, which is simply assumed
Not a very satisfying view of the world!<br>
47
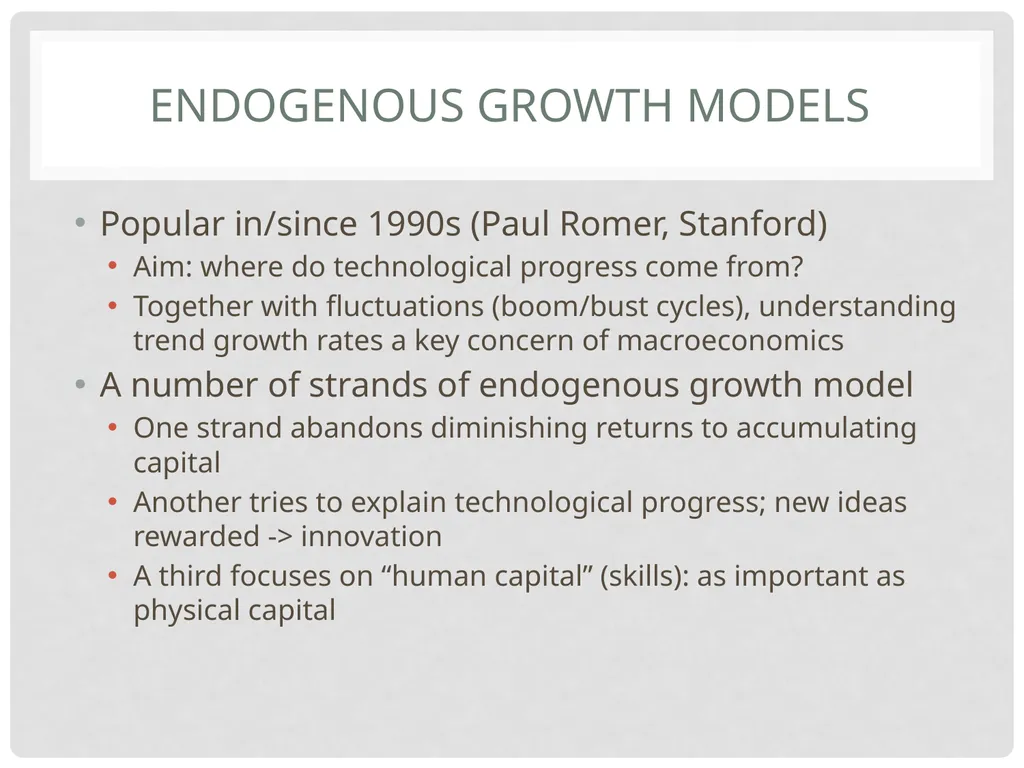
endogenous growth models Popular in/since 1990s (Paul Romer, Stanford)
Aim: where do technological progress come from?
Together with fluctuations (boom/bust cycles), understanding trend growth rates a key concern of macroeconomics
A number of strands of endogenous growth model
One strand abandons diminishing returns to accumulating capital
Another tries to explain technological progress; new ideas rewarded -> innovation
A third focuses on “human capital” (skills): as important as physical capital<br>
Aim: where do technological progress come from?
Together with fluctuations (boom/bust cycles), understanding trend growth rates a key concern of macroeconomics
A number of strands of endogenous growth model
One strand abandons diminishing returns to accumulating capital
Another tries to explain technological progress; new ideas rewarded -> innovation
A third focuses on “human capital” (skills): as important as physical capital<br>
48
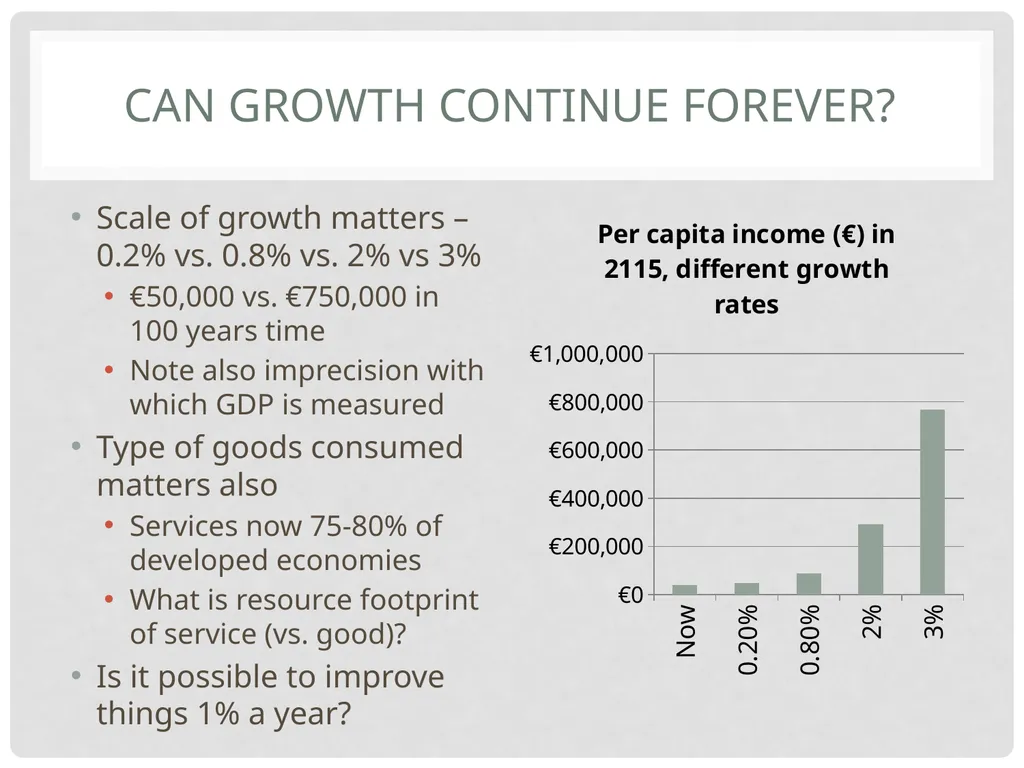
Can Growth Continue Forever? Scale of growth matters – 0.2% vs. 0.8% vs. 2% vs 3%
€50,000 vs. €750,000 in 100 years time
Note also imprecision with which GDP is measured
Type of goods consumed matters also
Services now 75-80% of developed economies
What is resource footprint of service (vs. good)?
Is it possible to improve things 1% a year?<br>
€50,000 vs. €750,000 in 100 years time
Note also imprecision with which GDP is measured
Type of goods consumed matters also
Services now 75-80% of developed economies
What is resource footprint of service (vs. good)?
Is it possible to improve things 1% a year?<br>
49
Topic C: Structure The Economy & Economic Growth
Conceptualizing the economy
National income accounts
GDP, welfare and public policy
Efficiency and production possibilities
Modern economic growth
Productivity performance<br>
Conceptualizing the economy
National income accounts
GDP, welfare and public policy
Efficiency and production possibilities
Modern economic growth
Productivity performance<br>
50
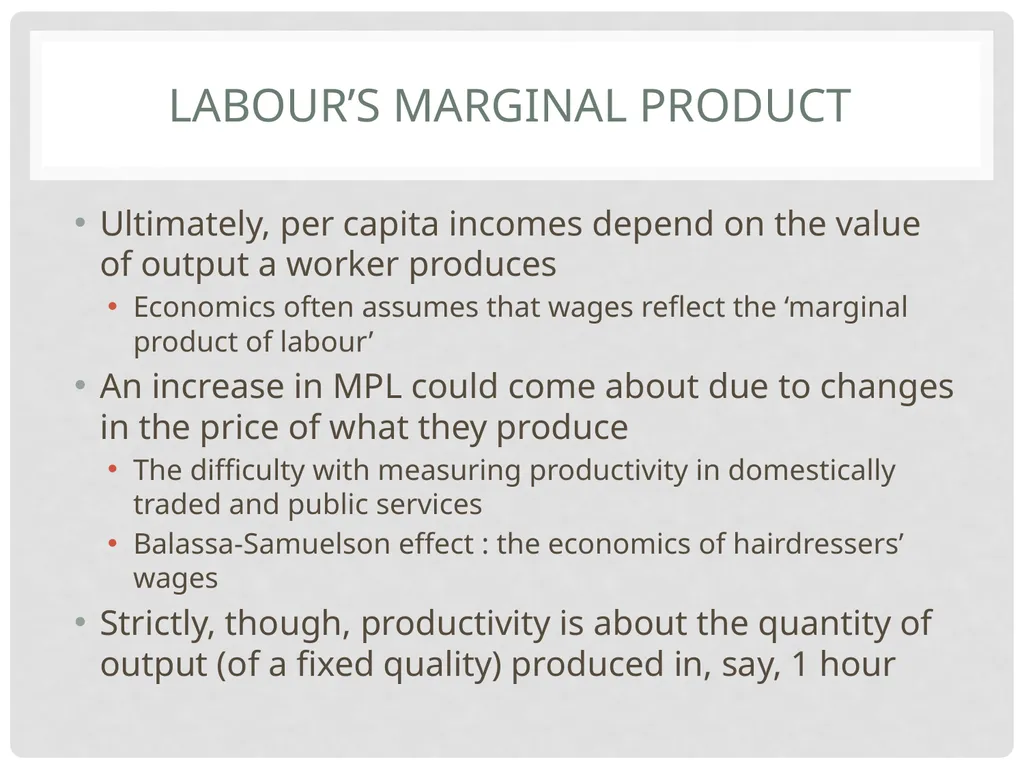
Labour’s Marginal Product Ultimately, per capita incomes depend on the value of output a worker produces
Economics often assumes that wages reflect the ‘marginal product of labour’
An increase in MPL could come about due to changes in the price of what they produce
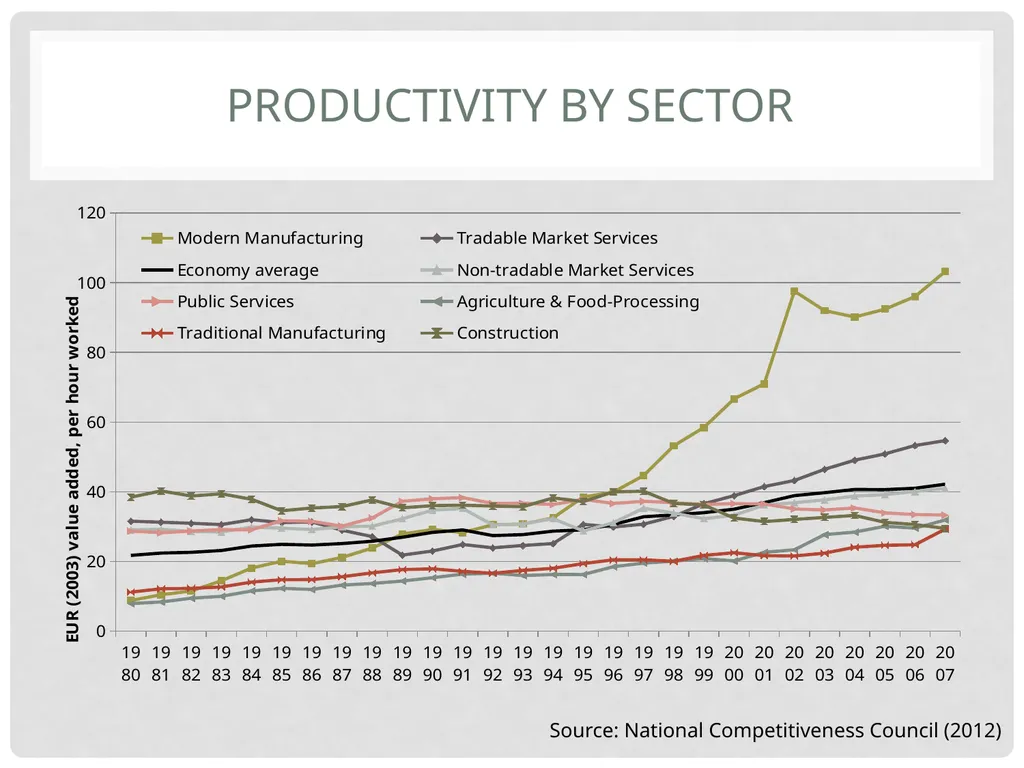
The difficulty with measuring productivity in domestically traded and public services
Balassa-Samuelson effect : the economics of hairdressers’ wages
Strictly, though, productivity is about the quantity of output (of a fixed quality) produced in, say, 1 hour<br>
Economics often assumes that wages reflect the ‘marginal product of labour’
An increase in MPL could come about due to changes in the price of what they produce
The difficulty with measuring productivity in domestically traded and public services
Balassa-Samuelson effect : the economics of hairdressers’ wages
Strictly, though, productivity is about the quantity of output (of a fixed quality) produced in, say, 1 hour<br>
51
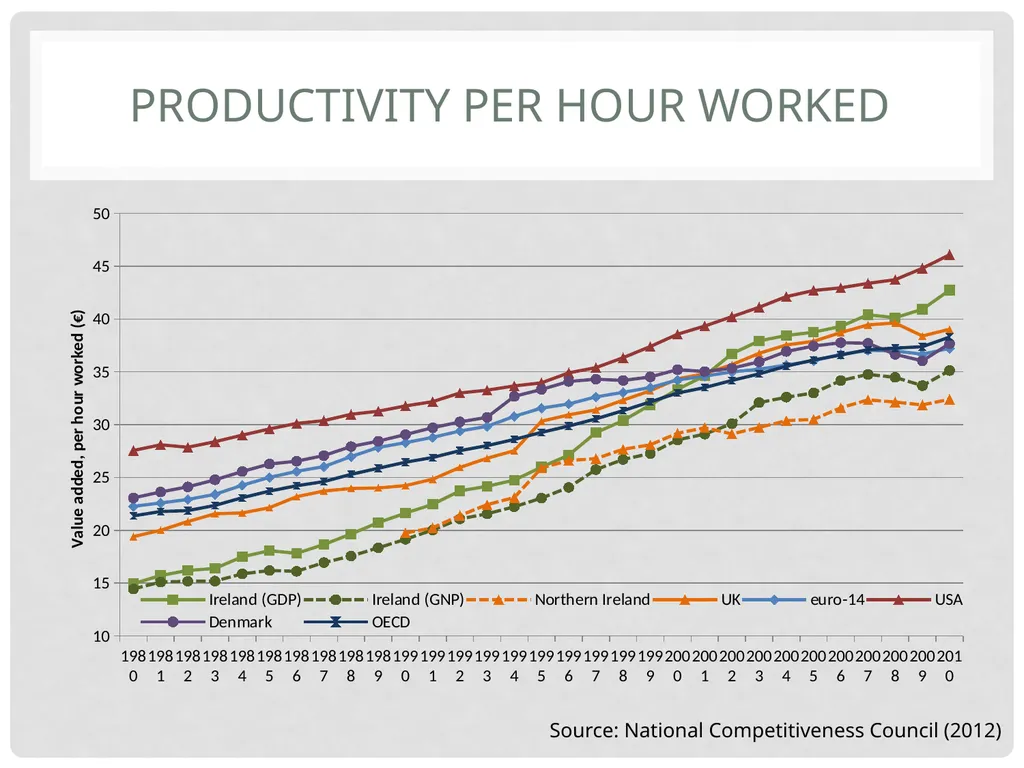
Productivity per Hour worked Source: National Competitiveness Council (2012)<br>
52
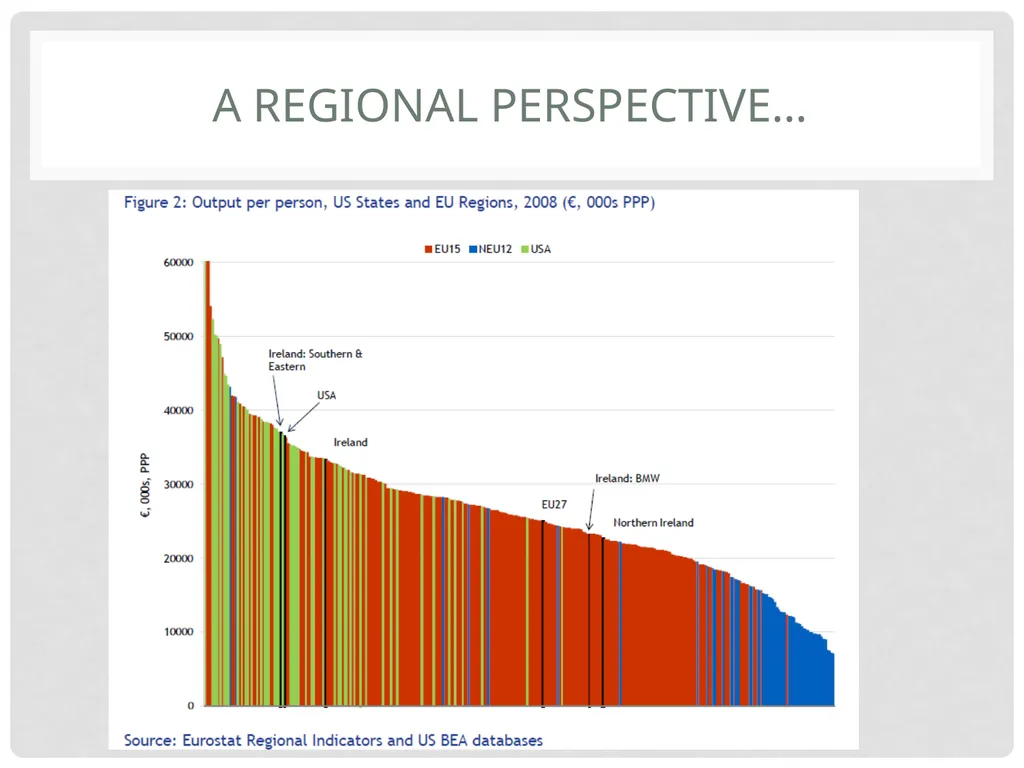
A Regional Perspective…<br>
53
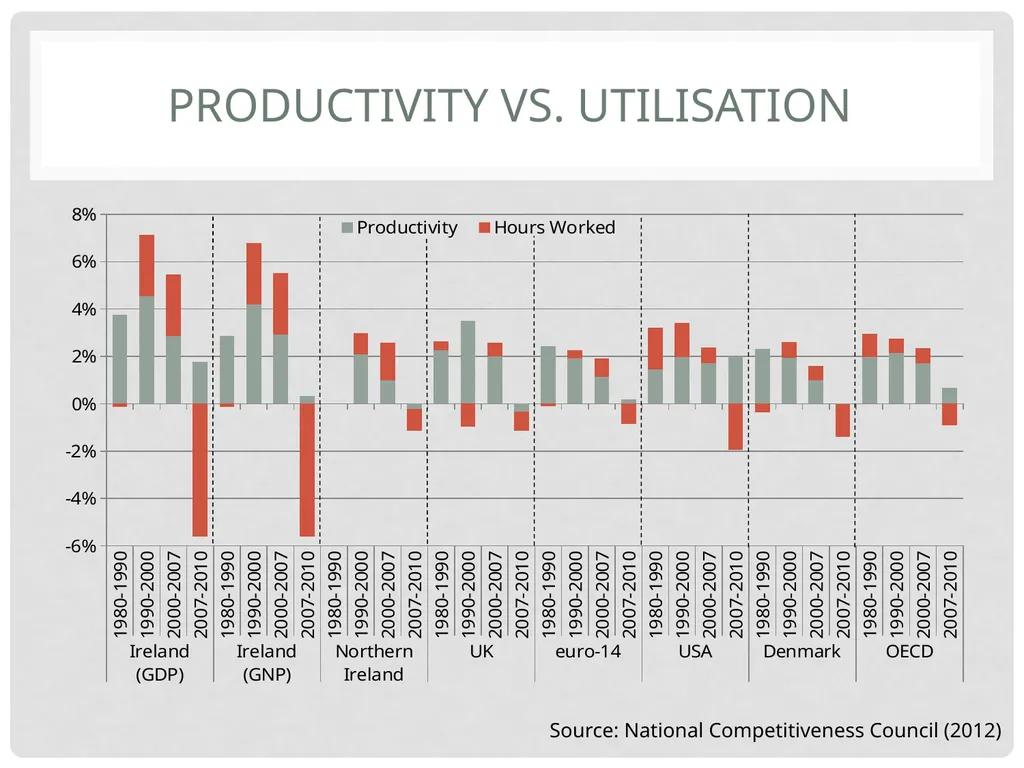
Productivity Vs. Utilisation Source: National Competitiveness Council (2012)<br>
54
Productivity by Sector Source: National Competitiveness Council (2012)<br>
55
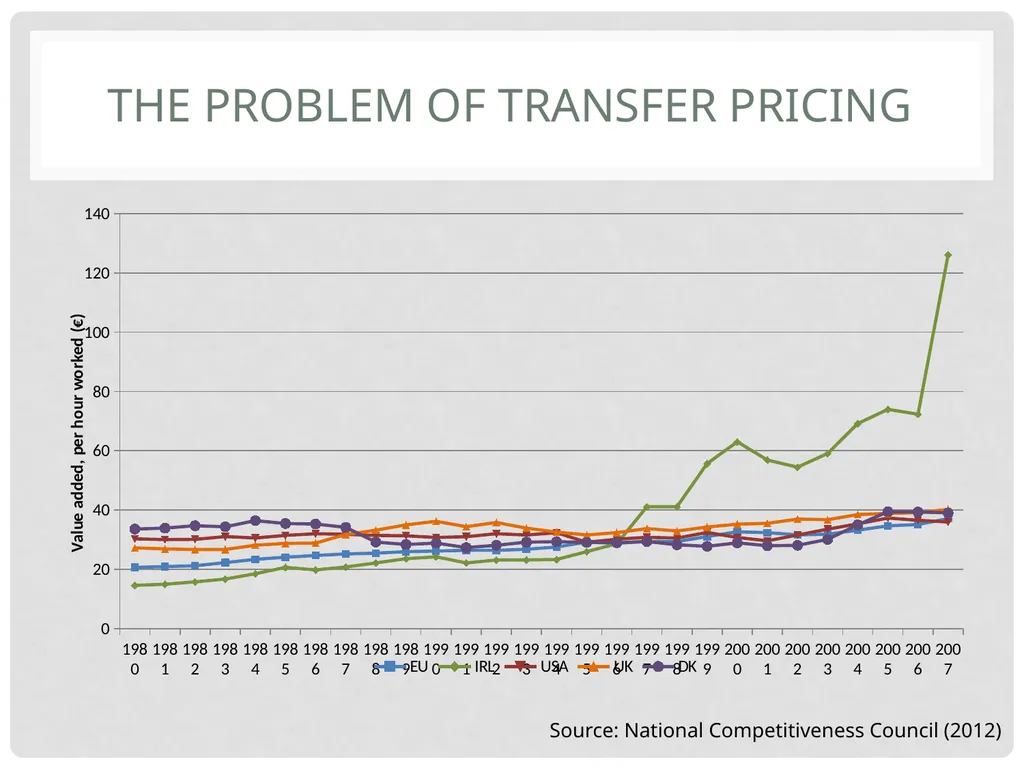
The Problem of Transfer Pricing Source: National Competitiveness Council (2012)<br>
56
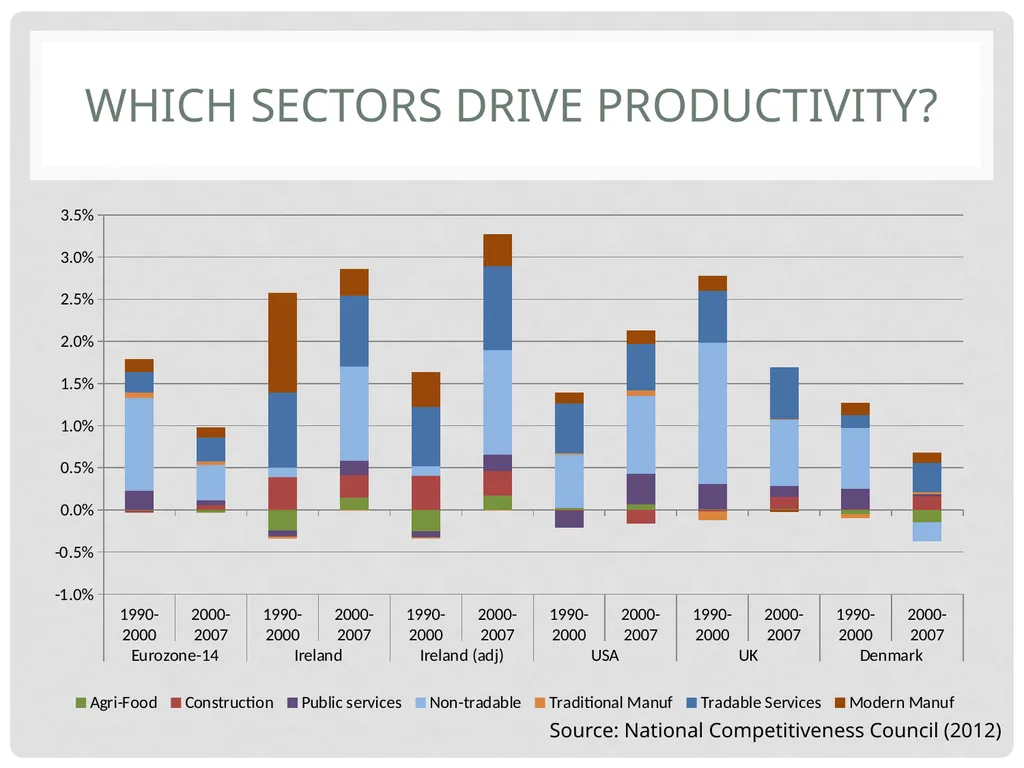
Which Sectors Drive Productivity? Source: National Competitiveness Council (2012)<br>
57
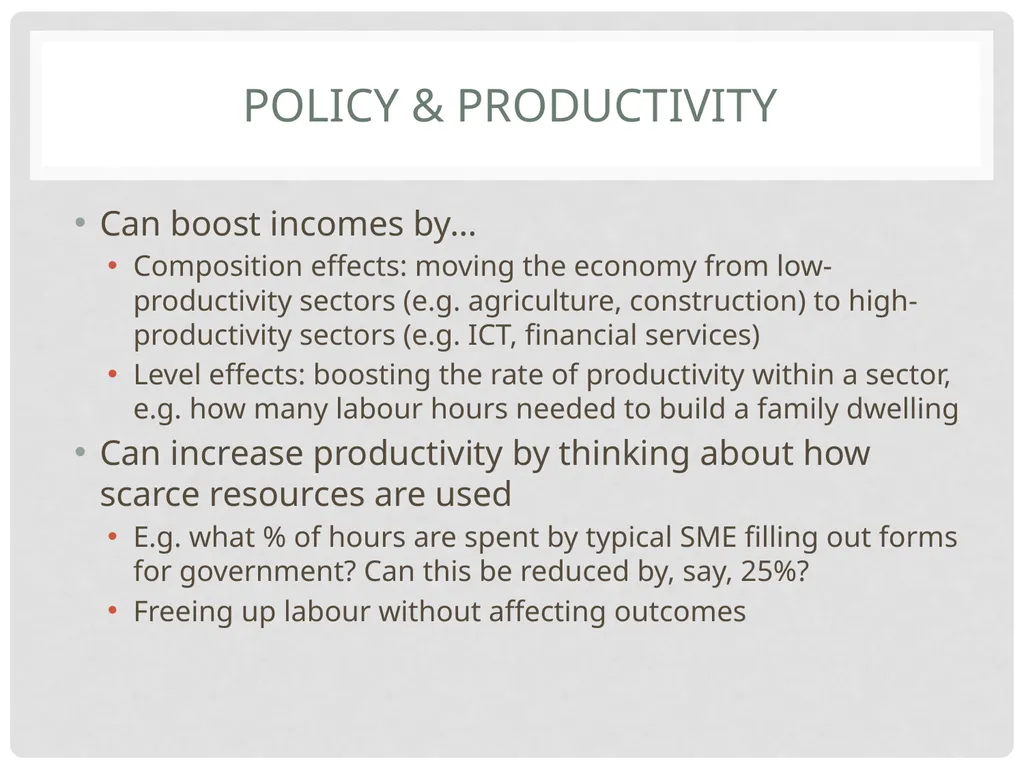
Policy & Productivity Can boost incomes by…
Composition effects: moving the economy from low-productivity sectors (e.g. agriculture, construction) to high-productivity sectors (e.g. ICT, financial services)
Level effects: boosting the rate of productivity within a sector, e.g. how many labour hours needed to build a family dwelling
Can increase productivity by thinking about how scarce resources are used
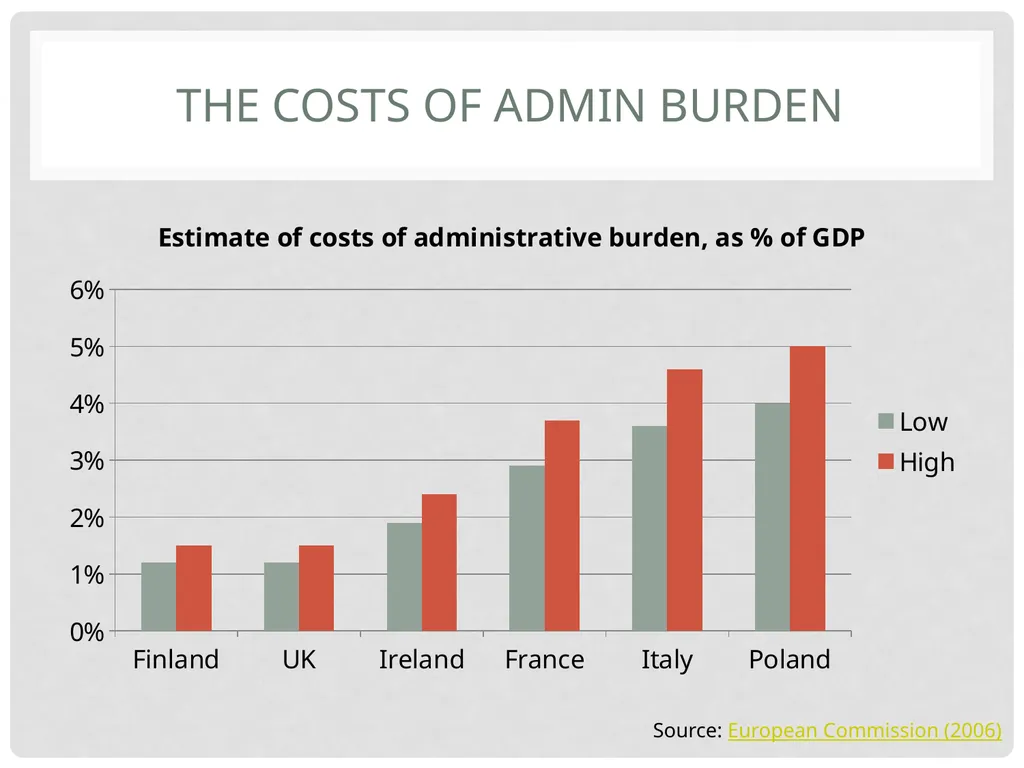
E.g. what % of hours are spent by typical SME filling out forms for government? Can this be reduced by, say, 25%?
Freeing up labour without affecting outcomes<br>
Composition effects: moving the economy from low-productivity sectors (e.g. agriculture, construction) to high-productivity sectors (e.g. ICT, financial services)
Level effects: boosting the rate of productivity within a sector, e.g. how many labour hours needed to build a family dwelling
Can increase productivity by thinking about how scarce resources are used
E.g. what % of hours are spent by typical SME filling out forms for government? Can this be reduced by, say, 25%?
Freeing up labour without affecting outcomes<br>
58
The Costs of Admin Burden Source: European Commission (2006)<br>
59
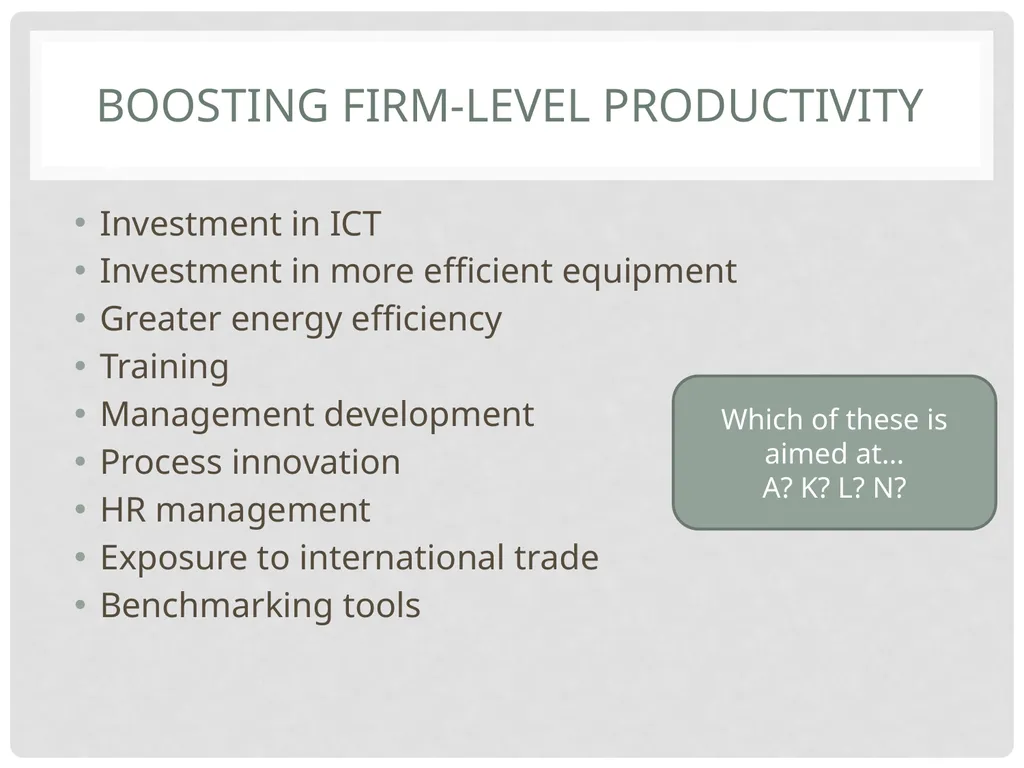
Boosting Firm-Level Productivity Investment in ICT
Investment in more efficient equipment
Greater energy efficiency
Training
Management development
Process innovation
HR management
Exposure to international trade
Benchmarking tools Which of these is aimed at…
A? K? L? N?<br>
Investment in more efficient equipment
Greater energy efficiency
Training
Management development
Process innovation
HR management
Exposure to international trade
Benchmarking tools Which of these is aimed at…
A? K? L? N?<br>
60
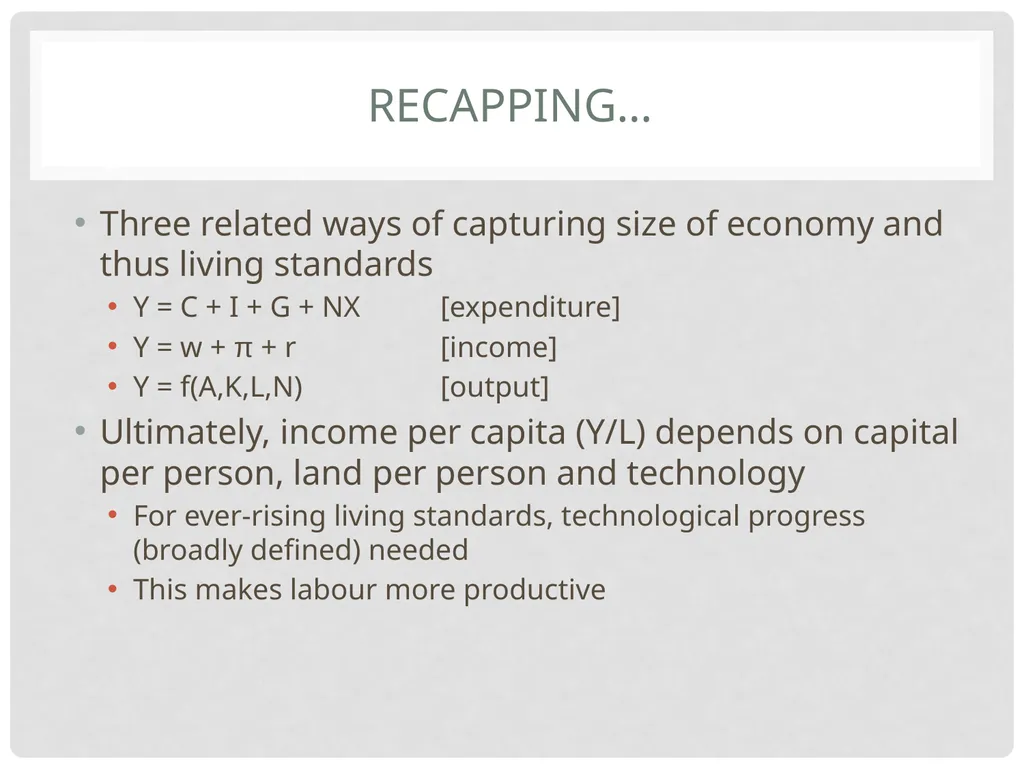
Recapping… Three related ways of capturing size of economy and thus living standards
Y = C + I + G + NX [expenditure]
Y = w + π + r [income]
Y = f(A,K,L,N) [output]
Ultimately, income per capita (Y/L) depends on capital per person, land per person and technology
For ever-rising living standards, technological progress (broadly defined) needed
This makes labour more productive<br>
Y = C + I + G + NX [expenditure]
Y = w + π + r [income]
Y = f(A,K,L,N) [output]
Ultimately, income per capita (Y/L) depends on capital per person, land per person and technology
For ever-rising living standards, technological progress (broadly defined) needed
This makes labour more productive<br>
61
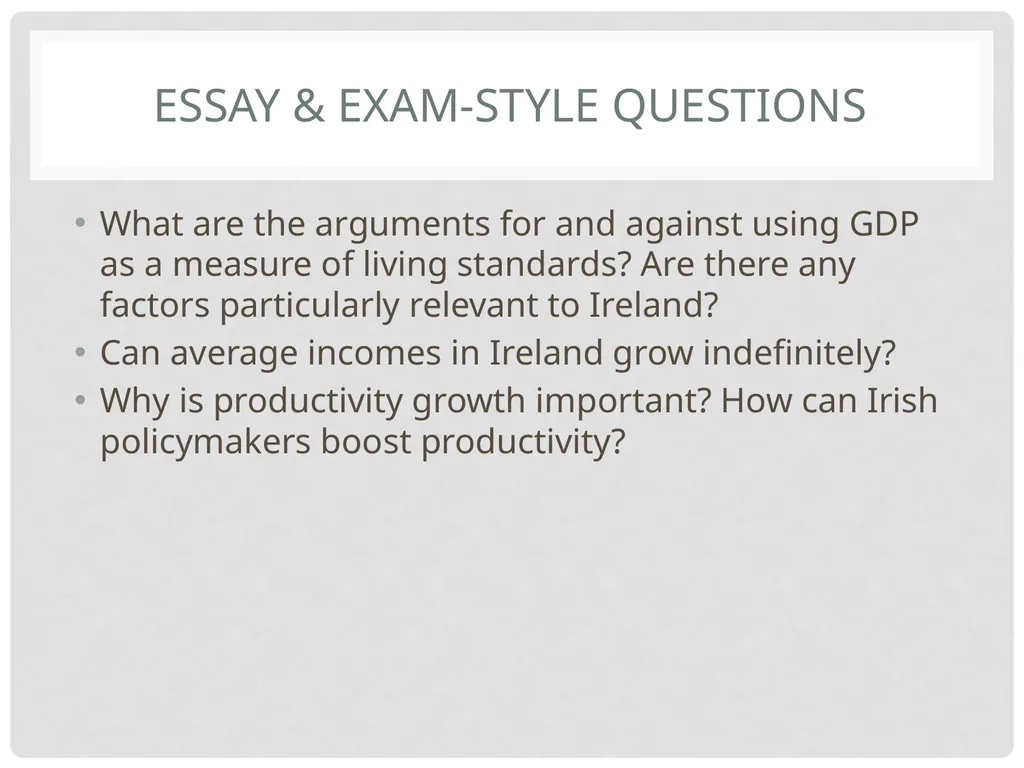
Essay & Exam-Style Questions What are the arguments for and against using GDP as a measure of living standards? Are there any factors particularly relevant to Ireland?
Can average incomes in Ireland grow indefinitely?
Why is productivity growth important? How can Irish policymakers boost productivity?<br>
Can average incomes in Ireland grow indefinitely?
Why is productivity growth important? How can Irish policymakers boost productivity?<br>