
Terrain-mapped Cross Sections in MATLAB Erik

Published  . 0 views
↓ Download
Terrain-mapped Cross Sections in MATLAB Erik
1 / 1
Terrain-mapped Cross Sections in MATLAB Erik - slide 1 of 11 Terrain-mapped Cross Sections in MATLAB Erik - slide 2 of 11 Terrain-mapped Cross Sections in MATLAB Erik - slide 3 of 11 Terrain-mapped Cross Sections in MATLAB Erik - slide 4 of 11 Terrain-mapped Cross Sections in MATLAB Erik - slide 5 of 11 Terrain-mapped Cross Sections in MATLAB Erik - slide 6 of 11 Terrain-mapped Cross Sections in MATLAB Erik - slide 7 of 11 Terrain-mapped Cross Sections in MATLAB Erik - slide 8 of 11 Terrain-mapped Cross Sections in MATLAB Erik - slide 9 of 11 Terrain-mapped Cross Sections in MATLAB Erik - slide 10 of 11 Terrain-mapped Cross Sections in MATLAB Erik - slide 11 of 11
Description: Terrain-mapped Cross Sections in MATLAB Erik Neemann 15 April 2014 Objective Create cross sections visually similar to what is produced in RIP Add capability to plot time-averaged data Before After Notes Code originally built to produce

Related Topics

Download Presentation

"Terrain-mapped Cross Sections in MATLAB Erik" is the property of its rightful owner. Permission is granted to download and print the materials on this website for personal, non-commercial use only, and to display it on your personal computer provided you do not modify the materials and that you retain all copyright notices contained in the materials. By downloading content from our website, you accept the terms of this agreement.

Presentation Transcript

slide1. Terrain-mapped Cross Sections in MATLAB Erik Neemann
15 April 2014<br>
slide2. Objective Create cross sections visually similar to what is produced in RIP
Add capability to plot time-averaged data<br>
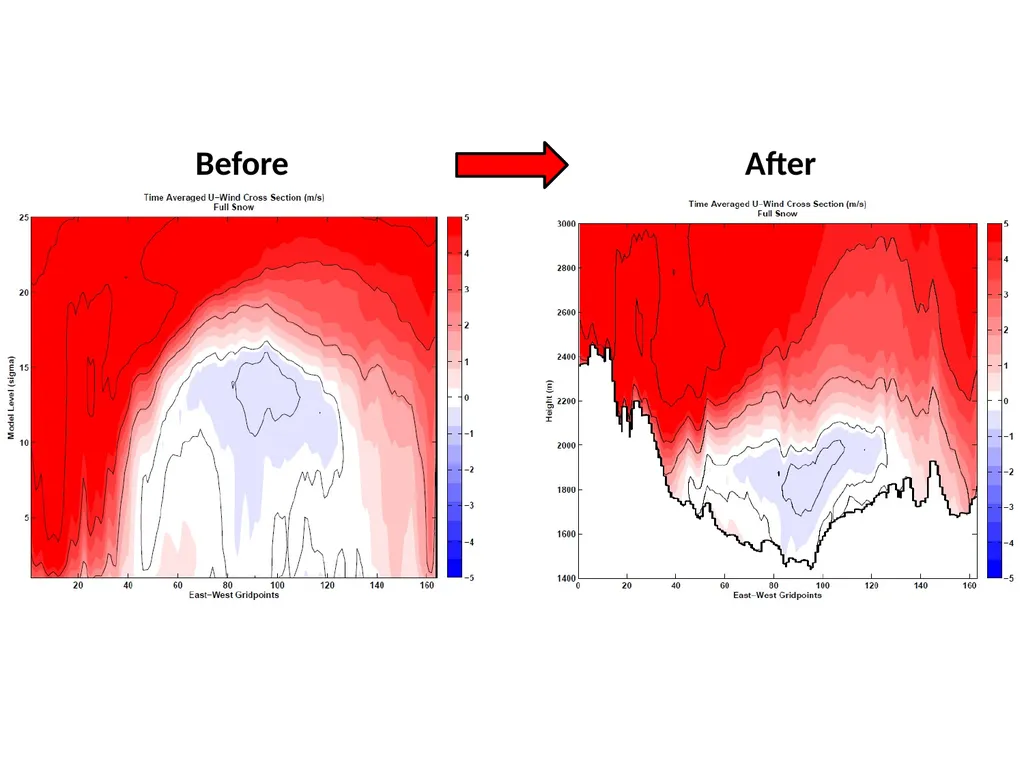
slide3. Before After<br>
slide4. Notes Code originally built to produce cross section of zonal wind component in Uintah Basin
Data is time-averaged
Based on wrfout files every 6 hours with 6 times each (hourly data)
Data is spatially averaged over 10 points on each side of cross section centerline (customizable)
Depth of cross section originally set to 25 model levels and 6000 m (customizable)
Total height (in m) must cover height of top model level + terrain elevation (~3500 + 2000 = 5500 m, in my case)
Produces multi-page pdf for figures and requires ps2pdf function, found here:
http://www.mathworks.com/matlabcentral/fileexchange/19516-ps2pdf<br>
slide5. Options & Editable parameters Can skip time-average part and just use on single wrfout file or time
Just input start & end points for cross section (i,j) and the code will calculate the slope and y-intercept of the equation for your cross section
Point A (i_pta, j_pta) - westernmost point
Point B (i_ptb, j_ptb) - easternmost point
depth (25) - to cover all data along xsect (model levels)
width (10) - grid point avg on each side of xsect<br>
slide6. Basic Steps of the Code Cut angled xsect through 3D domain
 Results in 2D array of data
Find all model level heights at each point along xsect
Plot data value in new array at model level height
 New array has 6000 vertical levels of 1 meter each
Linearly interpolated in vertical direction between data points for each gridpoint along xsect
“Outline” terrain by making all data below ground level = -9999
Plot final data<br>
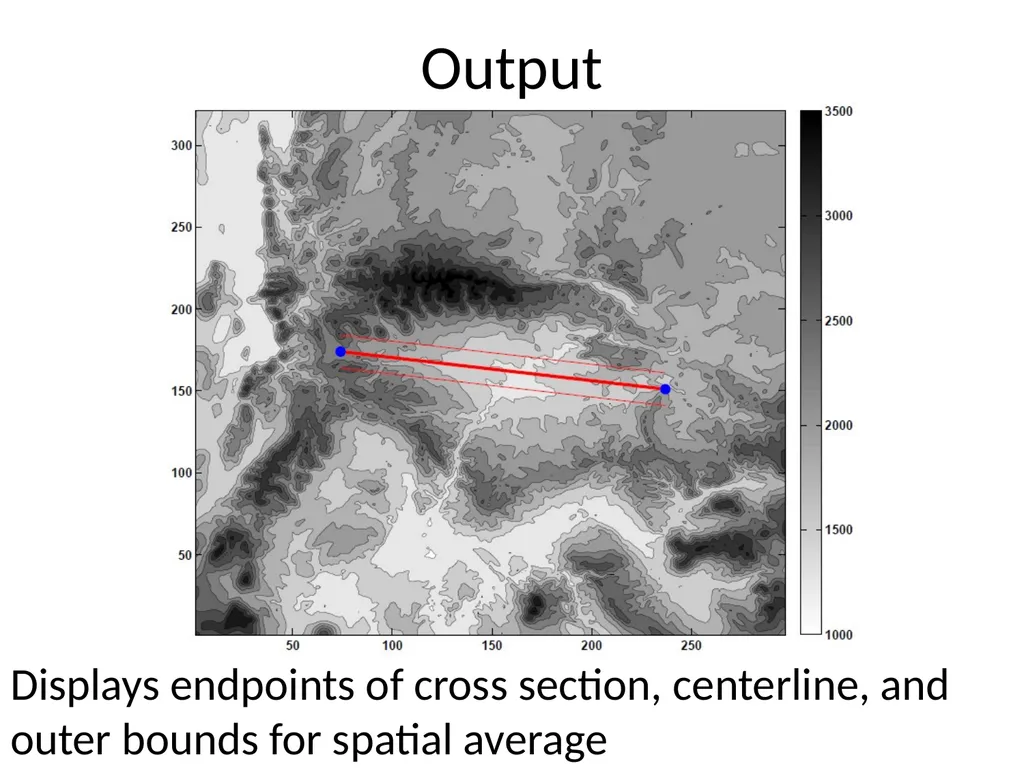
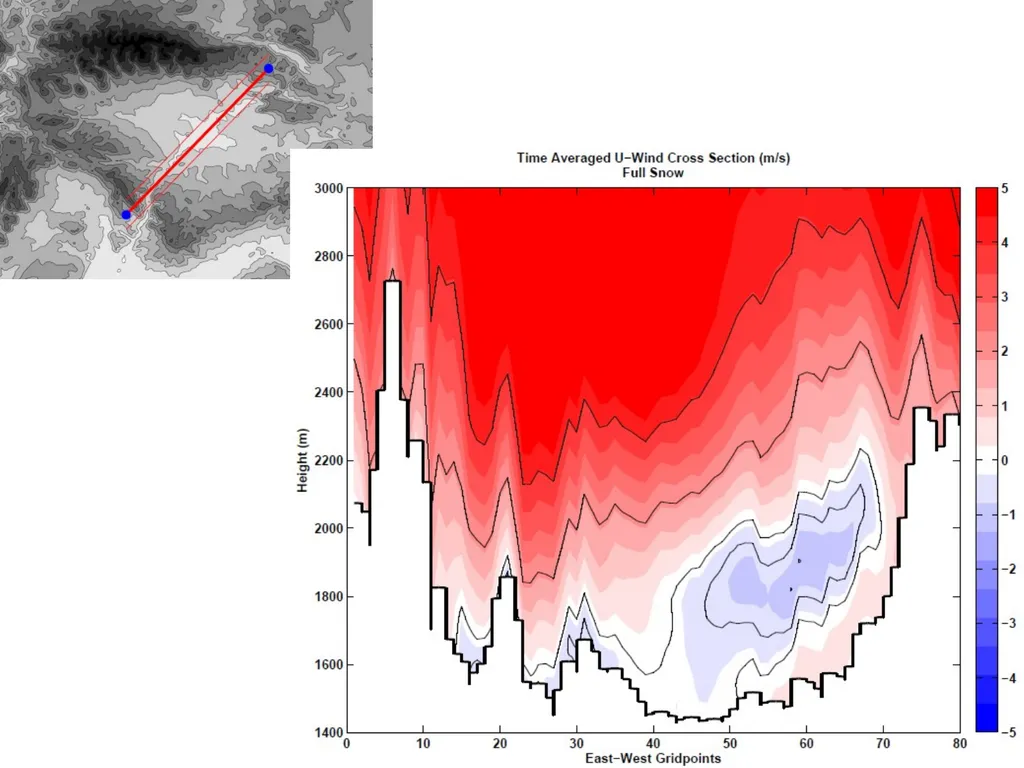
slide7. Output Displays endpoints of cross section, centerline, and outer bounds for spatial average<br>
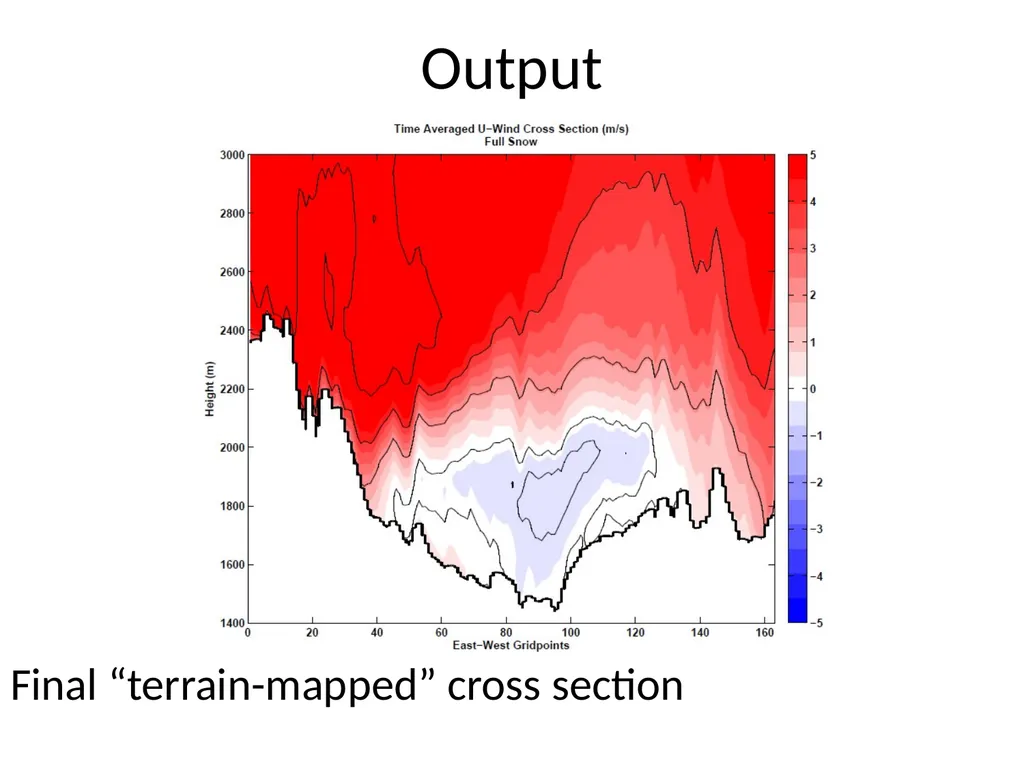
slide8. Output Final “terrain-mapped” cross section<br>