04
Testing of Hypothesis Testing of Hypothesis:
In hypothesis testing, we decide whether to accept or reject a particular value of a set, of particular values of a parameter or those of several parameters. It is seen that, although the exact value of a parameter may be unknown, there is often same idea about the true value. The data collected from samples helps us in rejecting or accepting our hypothesis. In other words, in dealing with problems of hypothesis testing, we try to arrive at a right decision about a pre-stated hypothesis.
Definition:
A test of a statistical hypothesis is a two action decision problem after the experimental sample values have been obtained, the two–actions being the acceptance or rejection of the hypothesis.<br>
05
Statistical Hypothesis:
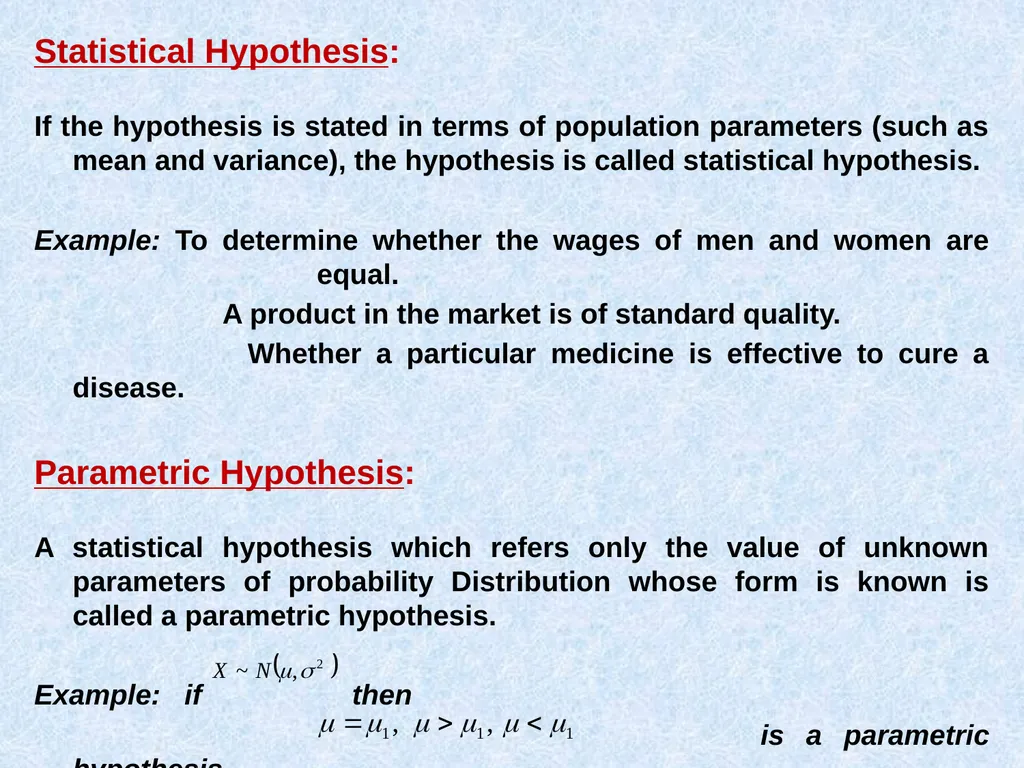
If the hypothesis is stated in terms of population parameters (such as mean and variance), the hypothesis is called statistical hypothesis.
Example: To determine whether the wages of men and women are equal.
A product in the market is of standard quality.
Whether a particular medicine is effective to cure a disease.
Parametric Hypothesis:
A statistical hypothesis which refers only the value of unknown parameters of probability Distribution whose form is known is called a parametric hypothesis.
Example: if then
is a parametric hypothesis<br>
06
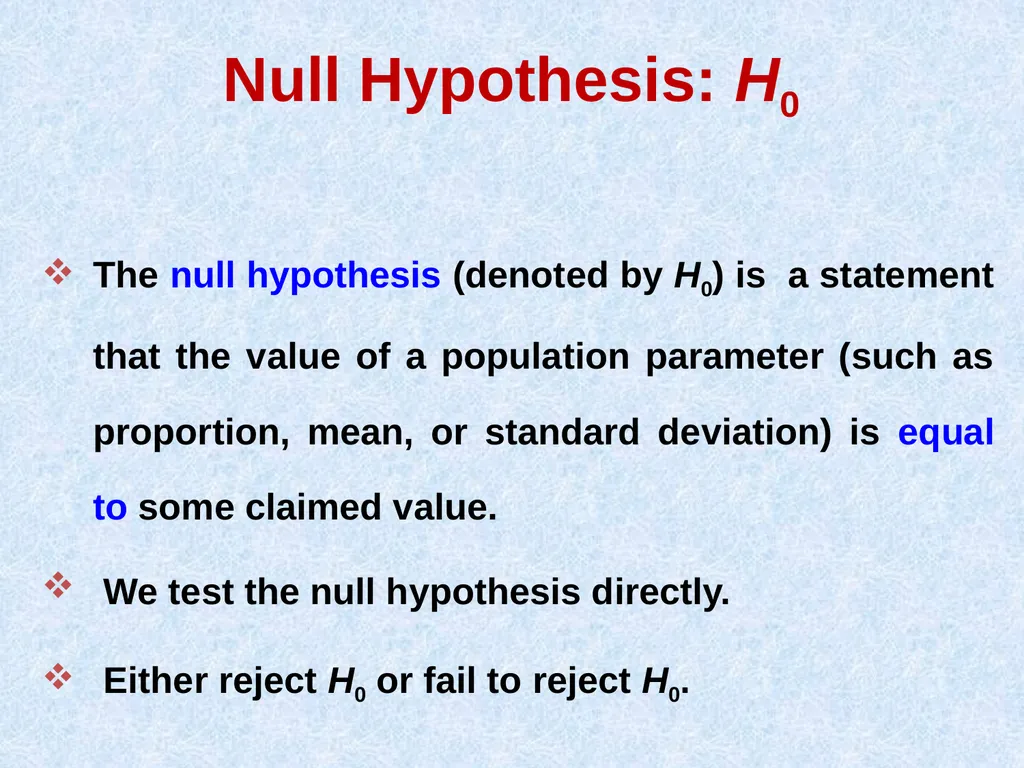
Null Hypothesis: H0 The null hypothesis (denoted by H0) is a statement that the value of a population parameter (such as proportion, mean, or standard deviation) is equal to some claimed value.
We test the null hypothesis directly.
Either reject H0 or fail to reject H0.<br>
07
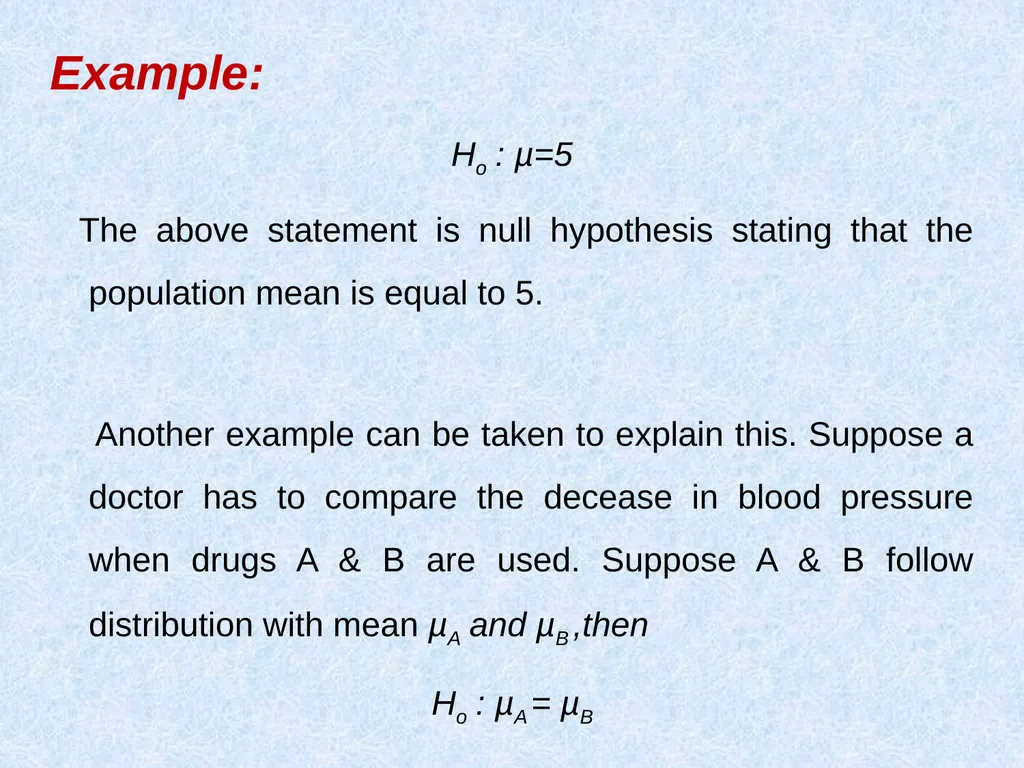
Example:
Ho : µ=5
The above statement is null hypothesis stating that the population mean is equal to 5.
Another example can be taken to explain this. Suppose a doctor has to compare the decease in blood pressure when drugs A & B are used. Suppose A & B follow distribution with mean µA and µB ,then
Ho : µA = µB<br>
08
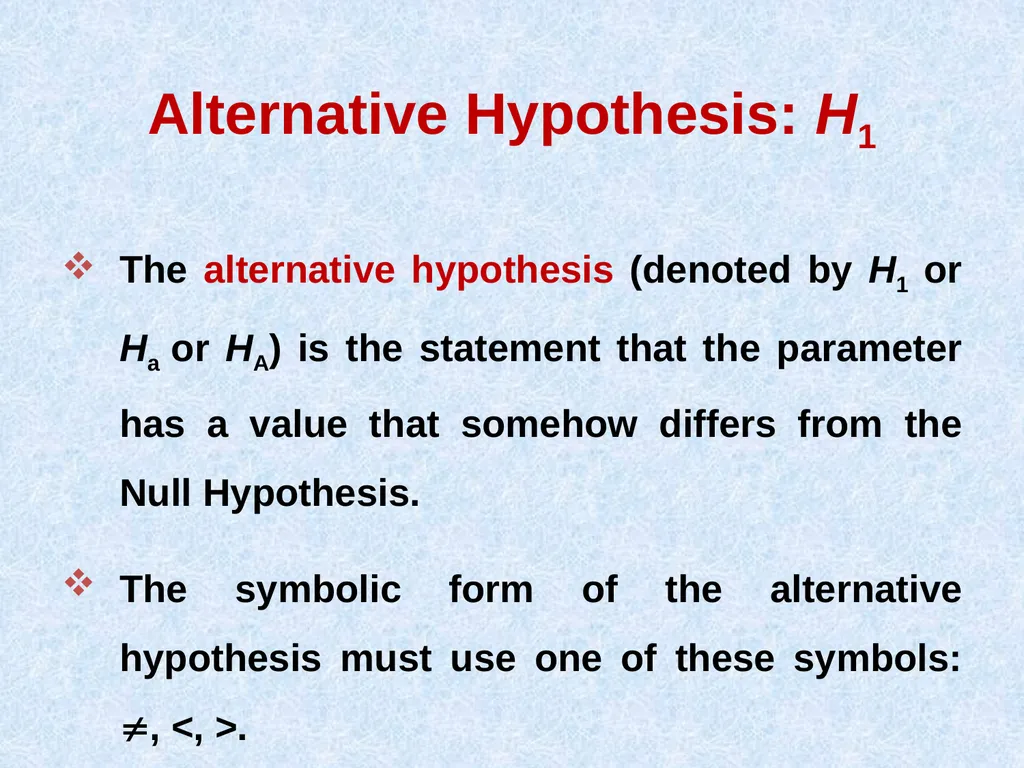
Alternative Hypothesis: H1 The alternative hypothesis (denoted by H1 or Ha or HA) is the statement that the parameter has a value that somehow differs from the Null Hypothesis.
The symbolic form of the alternative hypothesis must use one of these symbols: , <, >.<br>
09
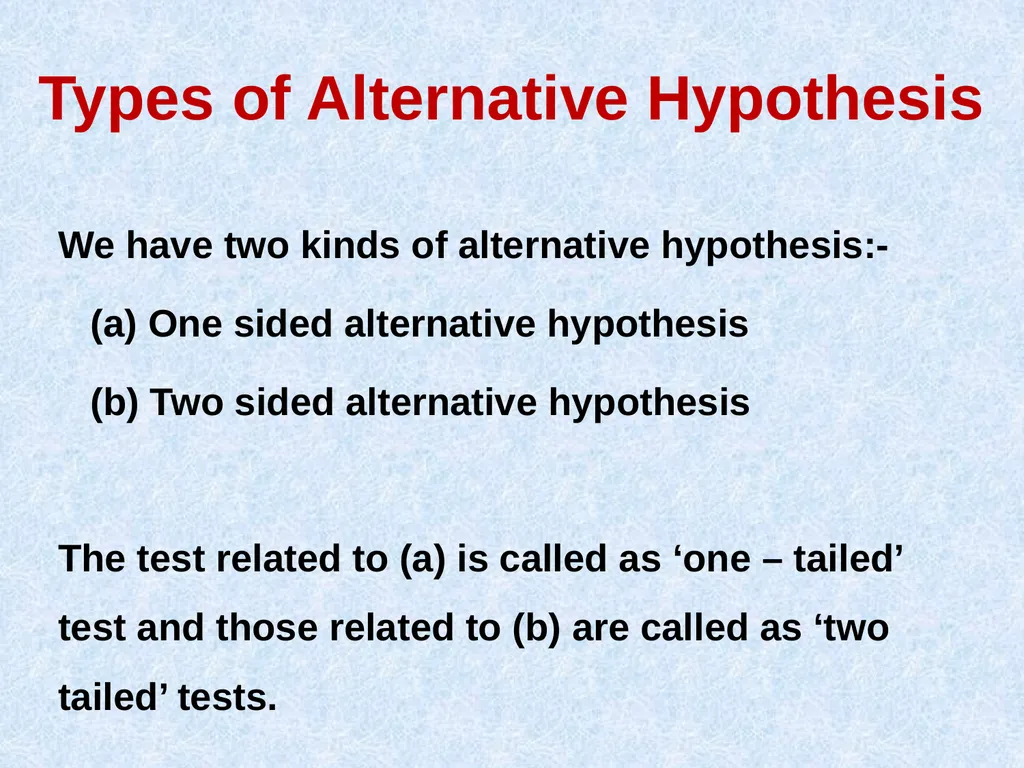
Types of Alternative Hypothesis We have two kinds of alternative hypothesis:-
(a) One sided alternative hypothesis
(b) Two sided alternative hypothesis
The test related to (a) is called as ‘one – tailed’ test and those related to (b) are called as ‘two tailed’ tests.<br>
10
Ho : µ = µ0
Then
H1 : µ < µ0 or H1 : µ > µ0
One sided alternative hypothesis
H1 : µ ≠ µ0
Two sided alternative hypothesis<br>
11
Note about Forming Your �Own Claims (Hypotheses) If you are conducting a study and want to use a hypothesis test to support your claim, the claim must be worded so that it becomes the alternative hypothesis.<br>
12
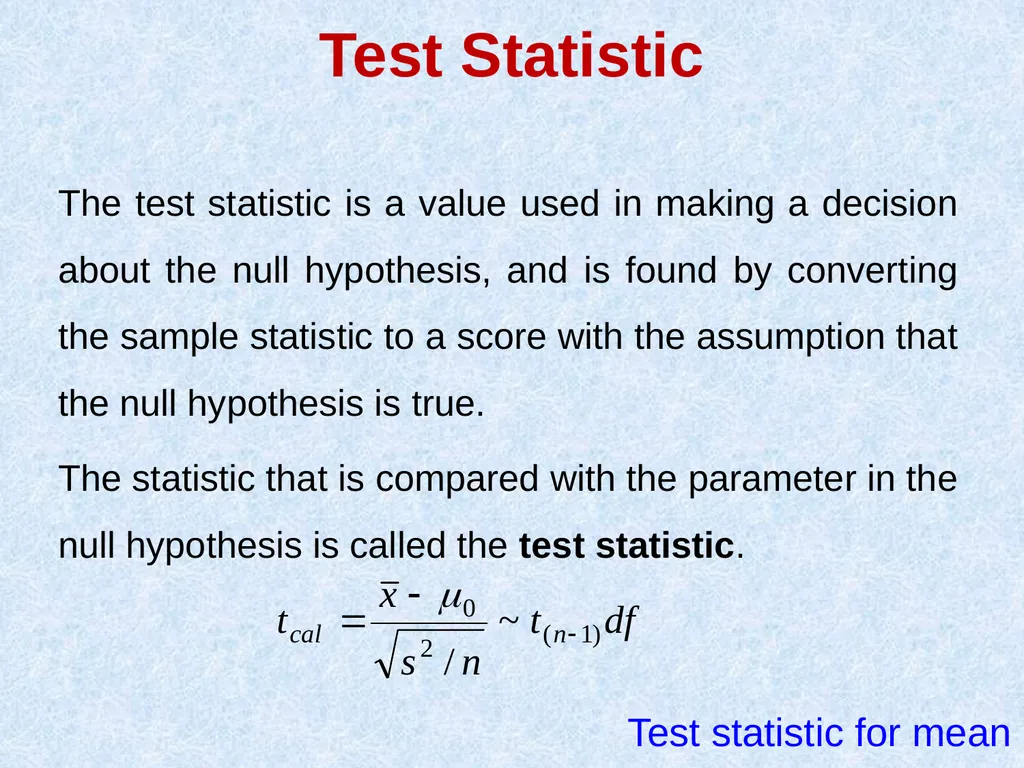
Test Statistic The test statistic is a value used in making a decision about the null hypothesis, and is found by converting the sample statistic to a score with the assumption that the null hypothesis is true.
The statistic that is compared with the parameter in the null hypothesis is called the test statistic. Test statistic for mean<br>
13
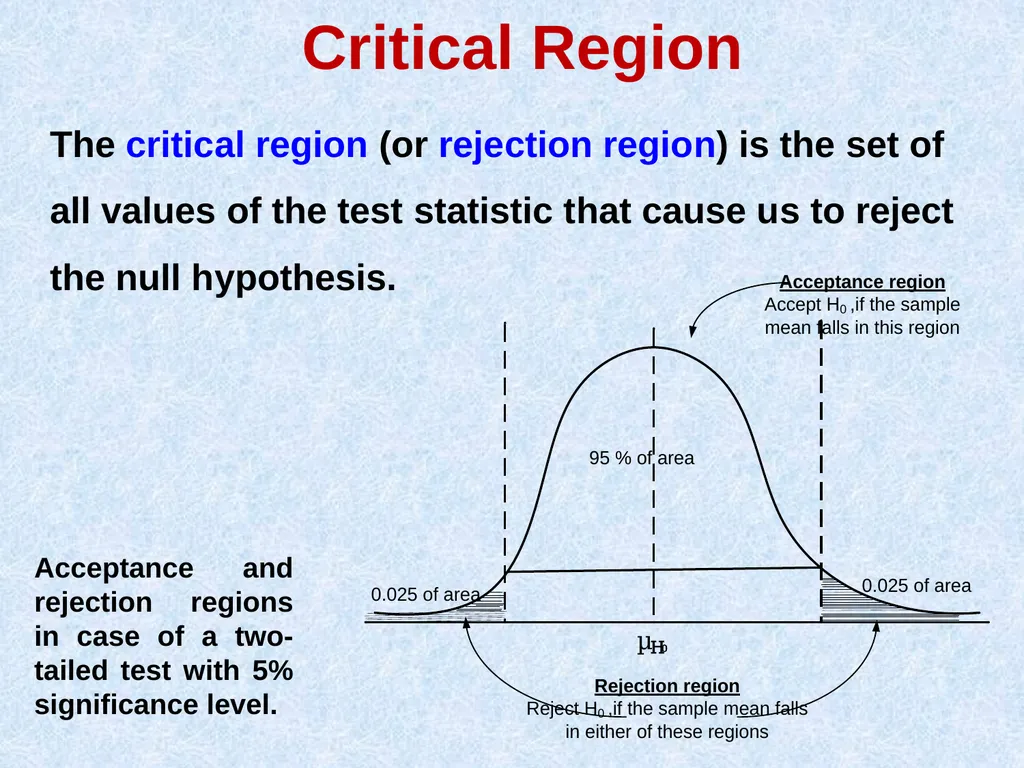
Critical Region The critical region (or rejection region) is the set of all values of the test statistic that cause us to reject the null hypothesis. Acceptance and rejection regions in case of a two-tailed test with 5% significance level.<br>
14
Significance Level The significance level (denoted by ) is the probability that the test statistic will fall in the critical region when the null hypothesis is actually true. Common choices for are 0.05, 0.01, and 0.10.<br>
15
Critical Value A critical value is any value that separates the critical region (where we reject the null hypothesis) from the values of the test statistic that do not lead to rejection of the null hypothesis. The critical values depend on the nature of the null hypothesis, the sampling distribution that applies, and the significance level .<br>
16
Two-tailed, Right-tailed,�Left-tailed Tests The tails in a distribution are the extreme regions bounded by critical values.<br>
17
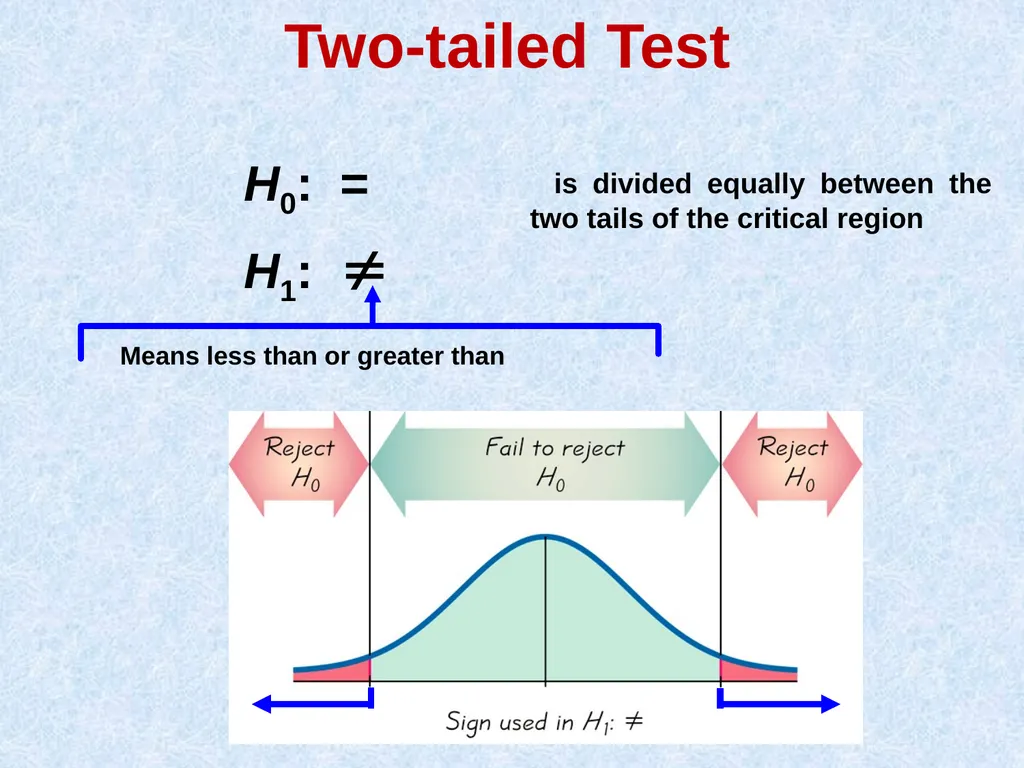
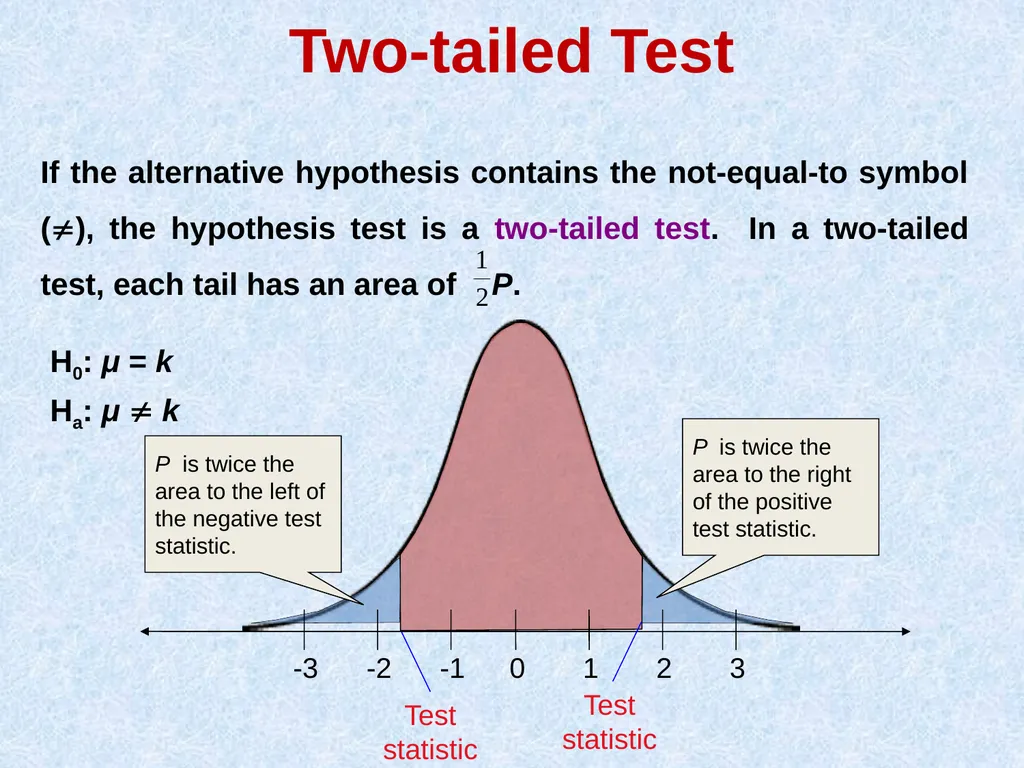
Two-tailed Test H0: =
H1: is divided equally between the two tails of the critical region<br>
18
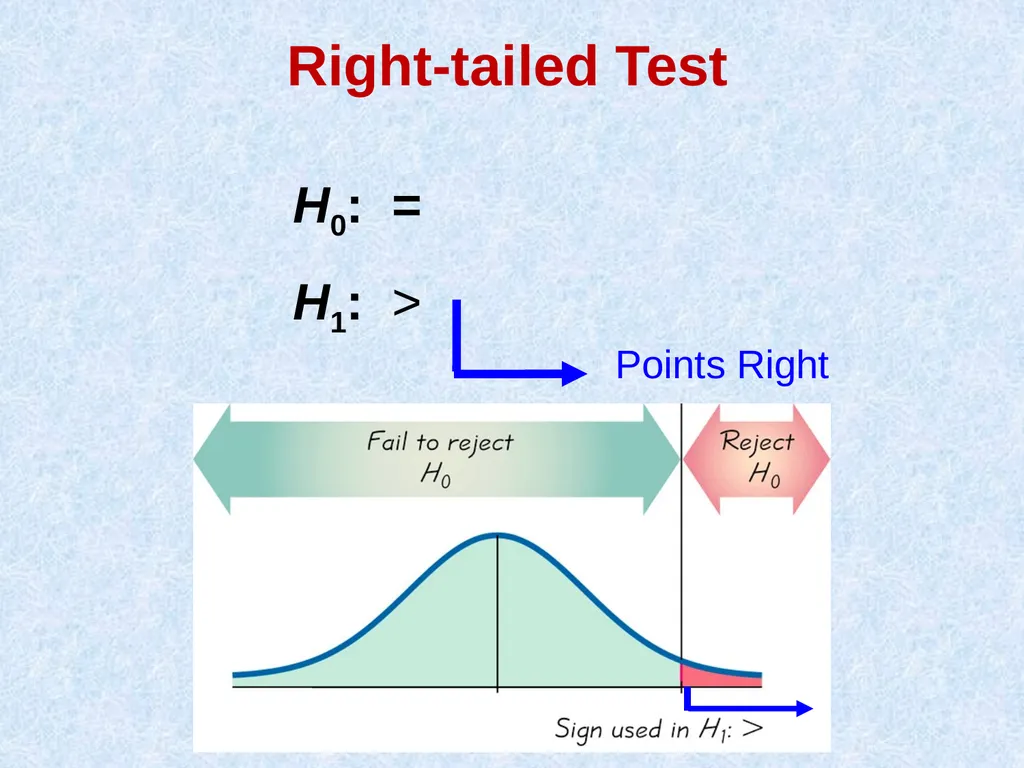
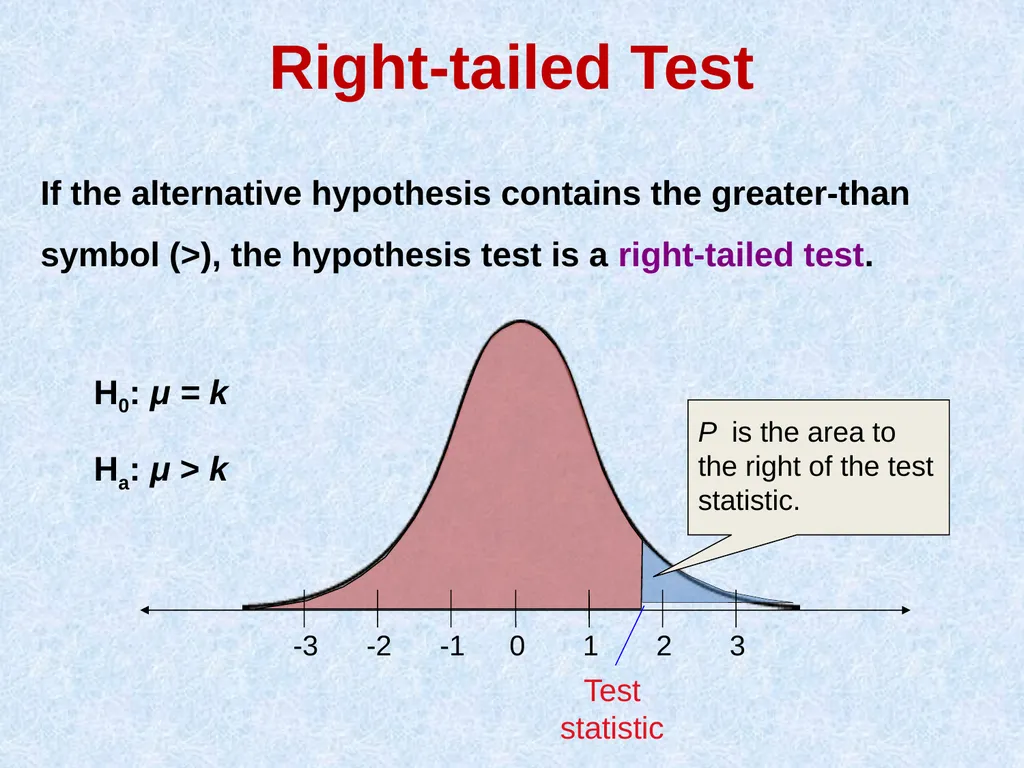
Right-tailed Test H0: =
H1: ><br>
19
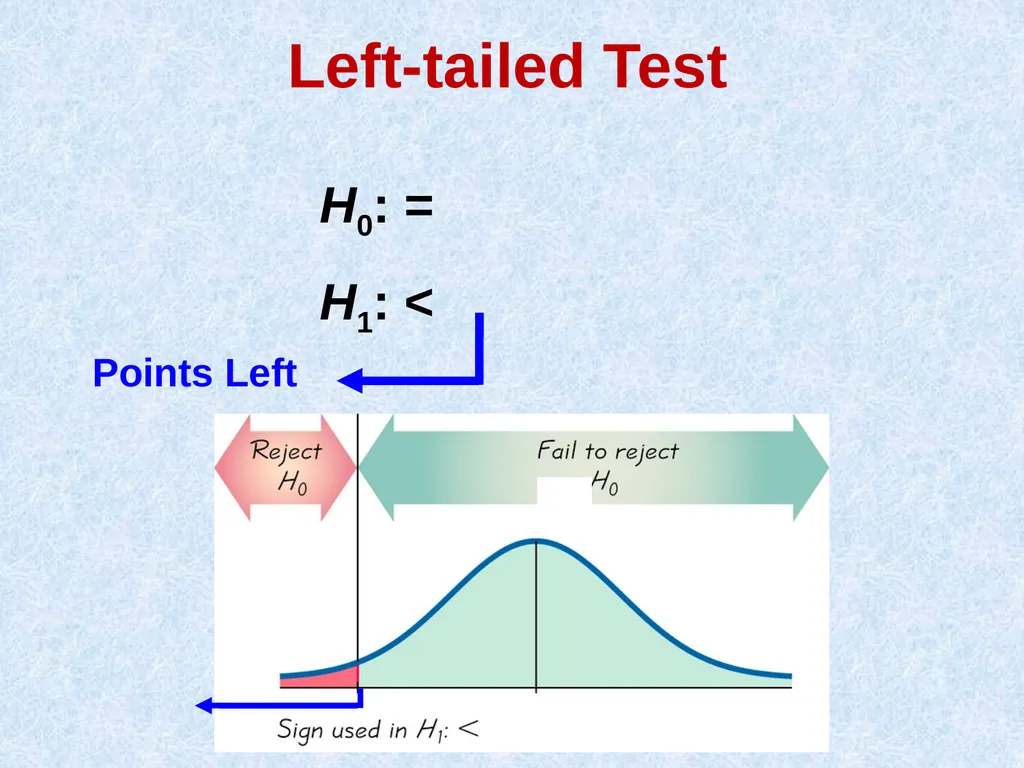
Left-tailed Test H0: =
H1: <<br>
20
P-Value The P-value (or p-value or probability value) is the probability of getting a value of the test statistic that is at least as extreme as the one representing the sample data, assuming that the null hypothesis is true. The null hypothesis is rejected if the P-value is very small, such as 0.05 or less.<br>
21
Two-tailed Test If the alternative hypothesis contains the not-equal-to symbol (), the hypothesis test is a two-tailed test. In a two-tailed test, each tail has an area of P. H0: μ = k
Ha: μ k<br>
22
Right-tailed Test If the alternative hypothesis contains the greater-than symbol (>), the hypothesis test is a right-tailed test. H0: μ = k
Ha: μ > k<br>
23
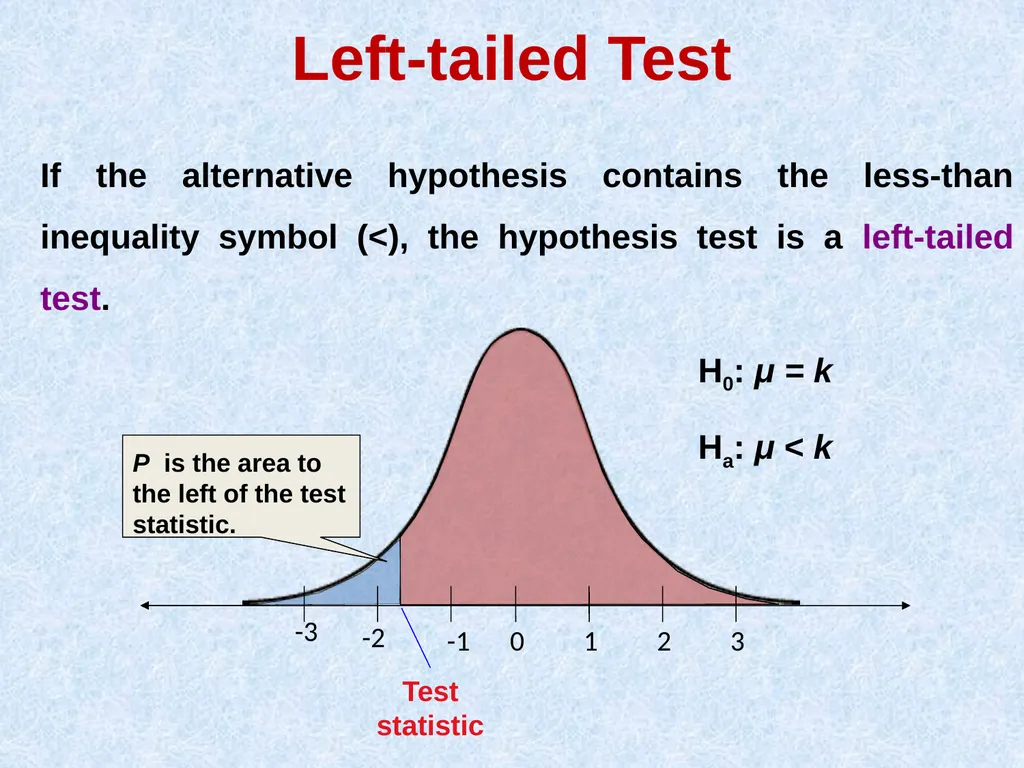
Left-tailed Test If the alternative hypothesis contains the less-than inequality symbol (<), the hypothesis test is a left-tailed test. H0: μ = k
Ha: μ < k<br>
24
We always test the null hypothesis. The initial conclusion will always be one of the following:
1. Reject the null hypothesis.
2. Fail to reject the null hypothesis. Making a Decision<br>
25
Traditional method
Reject H0 if the test statistic falls within the critical region.
Fail to reject H0 if the test statistic does not fall within the critical region. Decision Criterion<br>
26
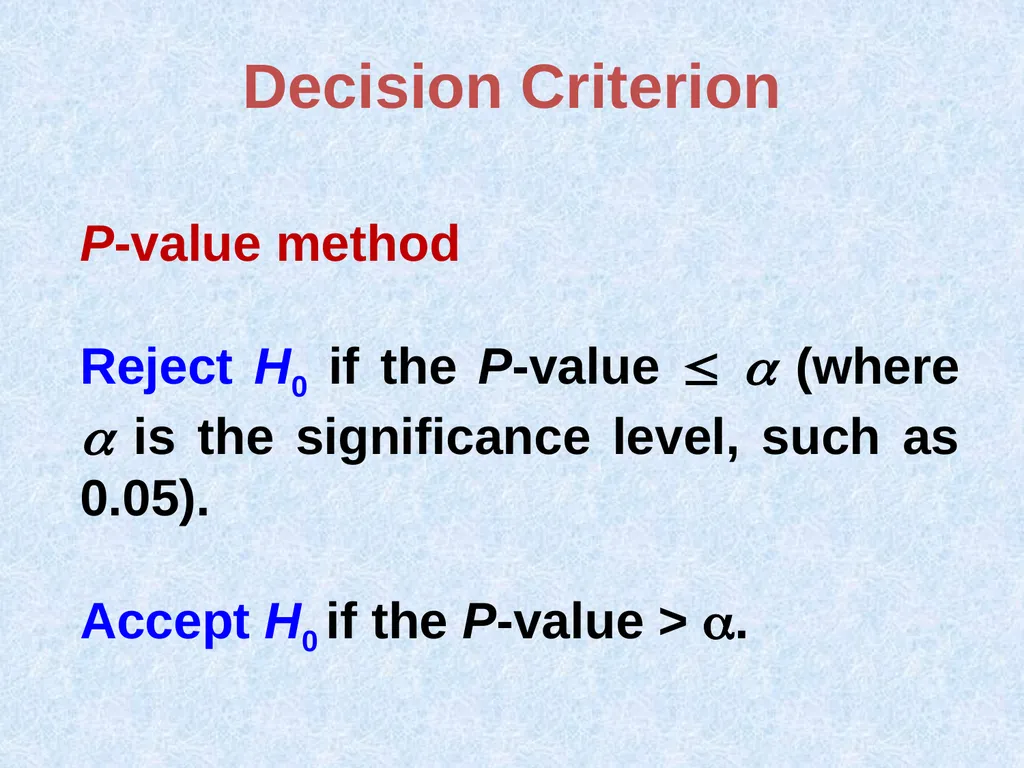
P-value method
Reject H0 if the P-value (where is the significance level, such as 0.05).
Accept H0 if the P-value > . Decision Criterion<br>
27
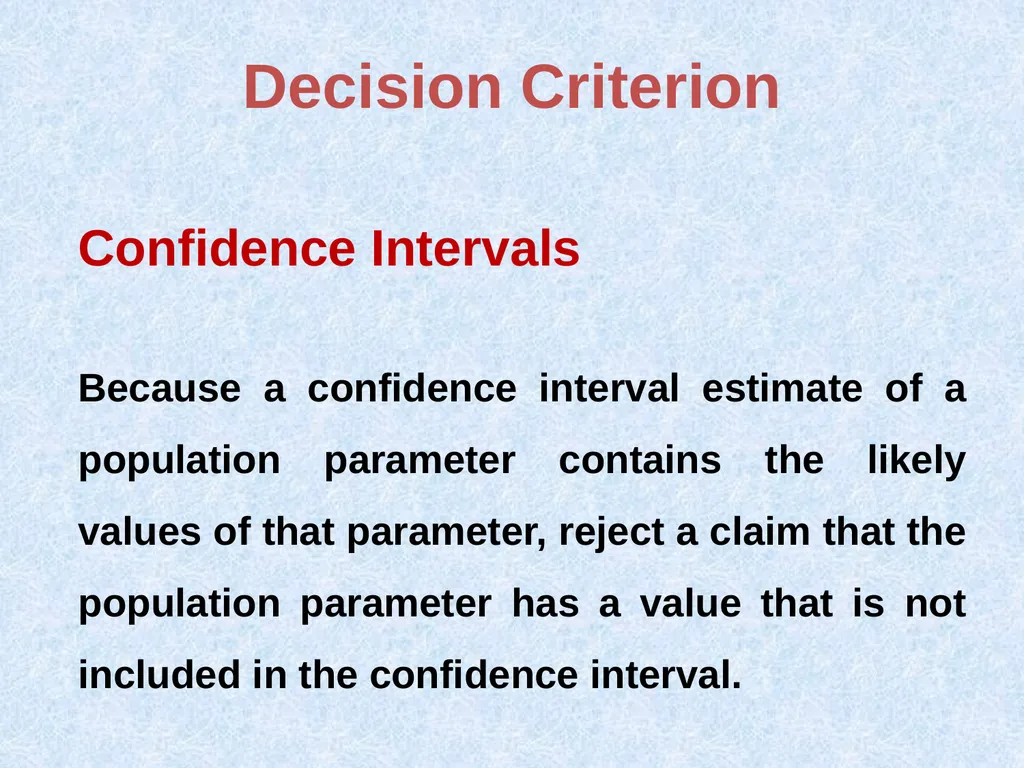
Decision Criterion Confidence Intervals
Because a confidence interval estimate of a population parameter contains the likely values of that parameter, reject a claim that the population parameter has a value that is not included in the confidence interval.<br>
28
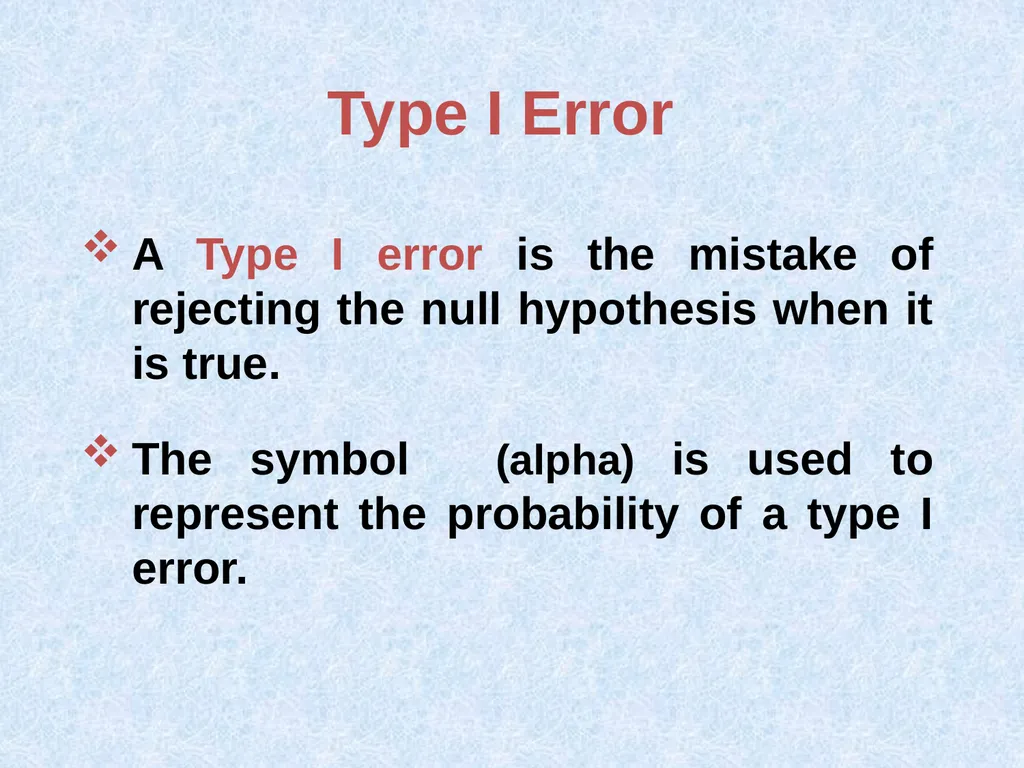
Type I Error A Type I error is the mistake of rejecting the null hypothesis when it is true.
The symbol (alpha) is used to represent the probability of a type I error.<br>
29
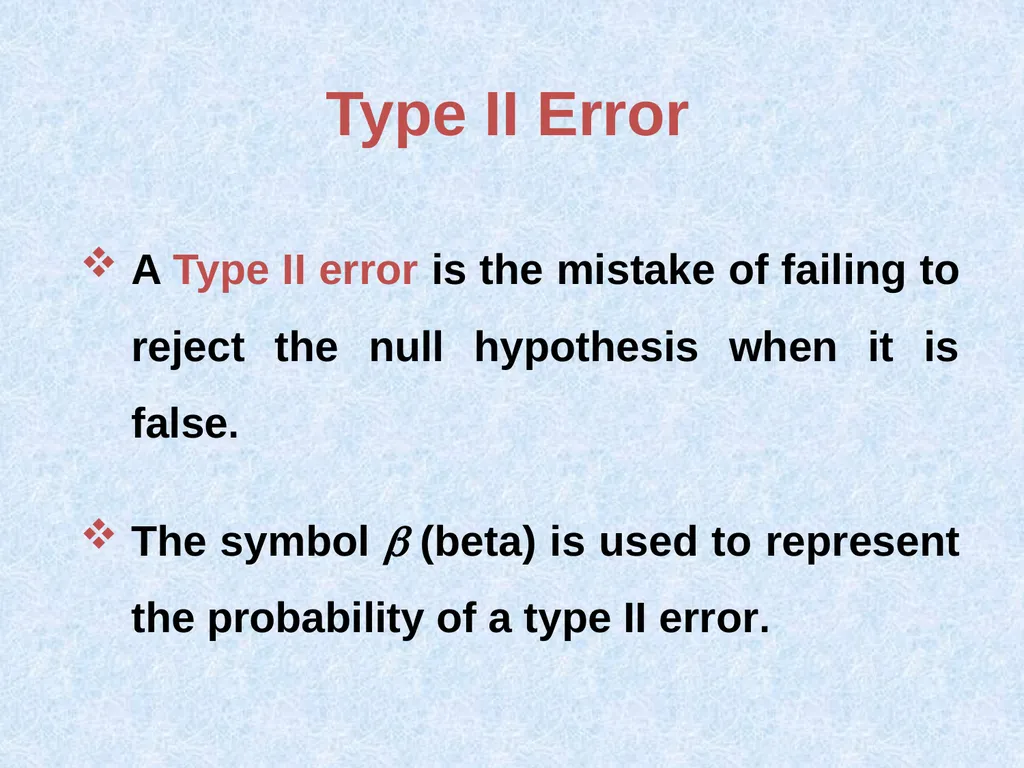
Type II Error A Type II error is the mistake of failing to reject the null hypothesis when it is false.
The symbol (beta) is used to represent the probability of a type II error.<br>
30
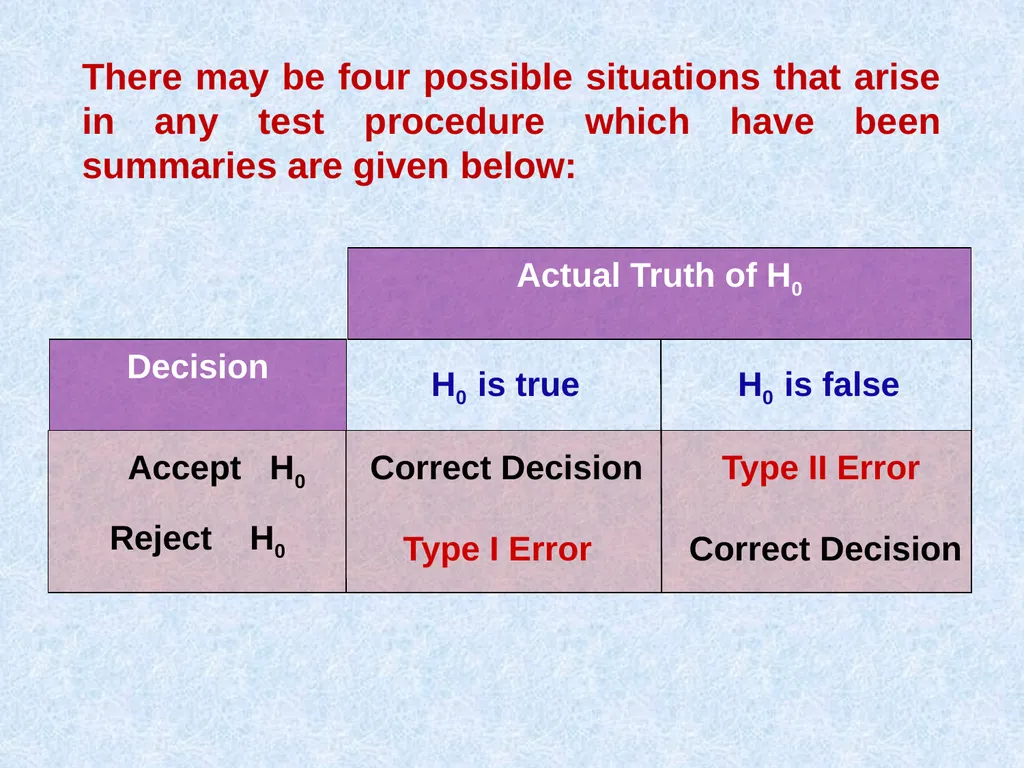
There may be four possible situations that arise in any test procedure which have been summaries are given below:<br>
31
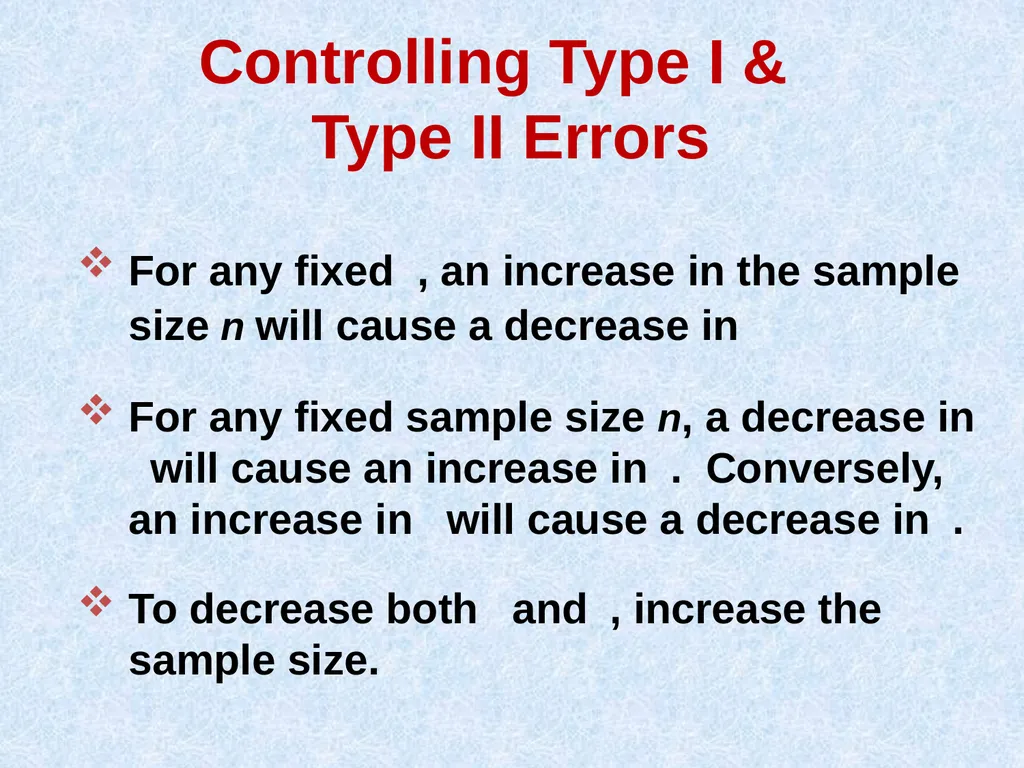
Controlling Type I & �Type II Errors For any fixed , an increase in the sample size n will cause a decrease in
For any fixed sample size n, a decrease in will cause an increase in . Conversely, an increase in will cause a decrease in .
To decrease both and , increase the sample size.<br>
32
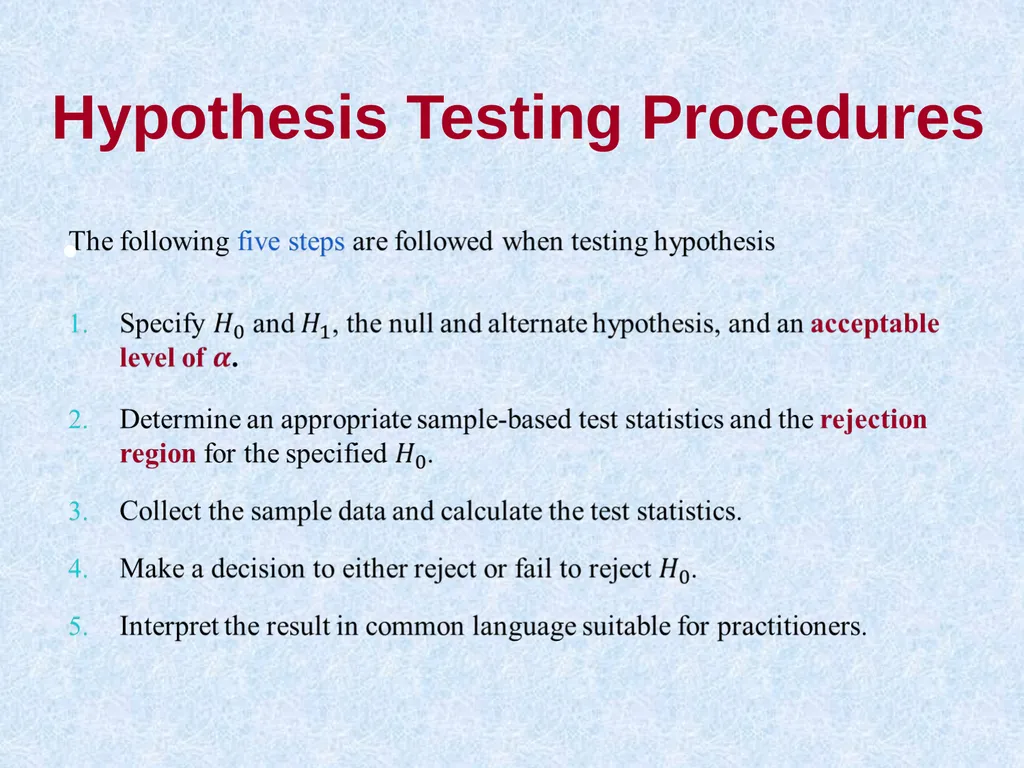
Hypothesis Testing Procedures<br>
33
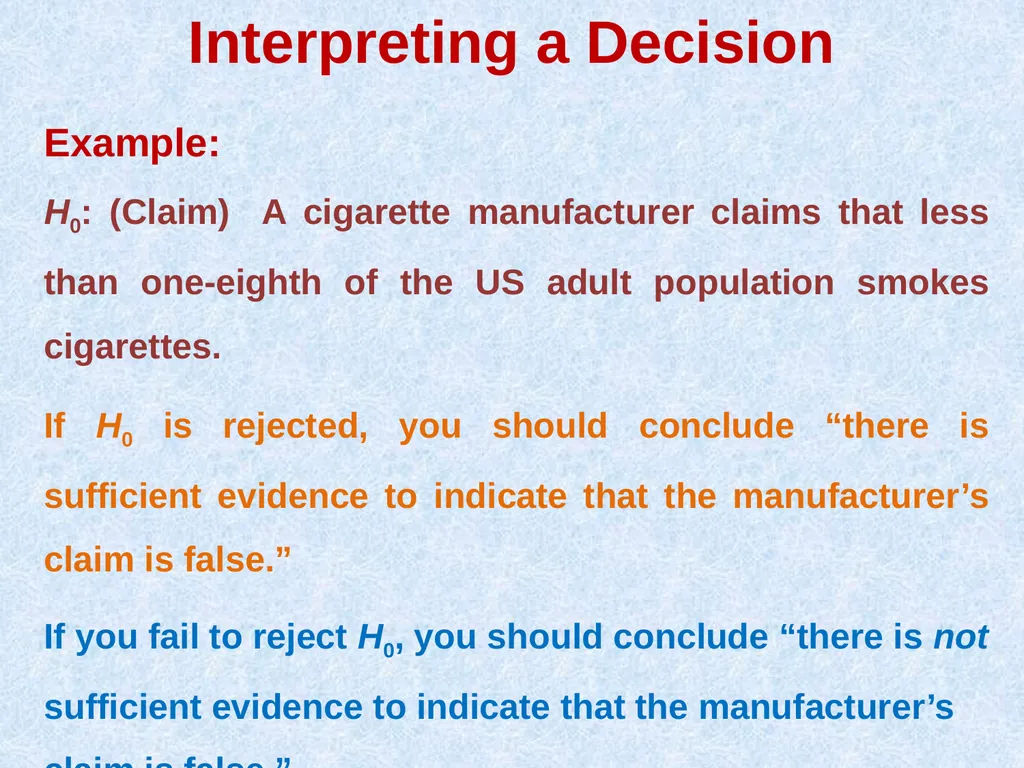
Interpreting a Decision Example:
H0: (Claim) A cigarette manufacturer claims that less than one-eighth of the US adult population smokes cigarettes.
If H0 is rejected, you should conclude “there is sufficient evidence to indicate that the manufacturer’s claim is false.”
If you fail to reject H0, you should conclude “there is not sufficient evidence to indicate that the manufacturer’s claim is false.”<br>