THE CASE AGAINST LOWERING THE ACTION LEVEL FOR
Description: THE CASE AGAINST LOWERING THE ACTION LEVEL FOR CHILDHOOD BLOOD LEAD LEVELS George G. Rhoads MD, MPH Rutgers School of Public Health October 2015 The Issue The level of concern of 10 µgdL stood for nearly 20 years from 1992. There were no
Related Topics
Download Presentation
"THE CASE AGAINST LOWERING THE ACTION LEVEL FOR" is the property of its rightful owner. Permission is granted to download and print the materials on this website for personal, non-commercial use only, and to display it on your personal computer provided you do not modify the materials and that you retain all copyright notices contained in the materials. By downloading content from our website, you accept the terms of this agreement.
Presentation Transcript
slide1. THE CASE AGAINST LOWERING THE ACTION LEVEL FOR CHILDHOOD BLOOD LEAD LEVELS
George G. Rhoads MD, MPH
Rutgers School of Public Health
October 2015<br>
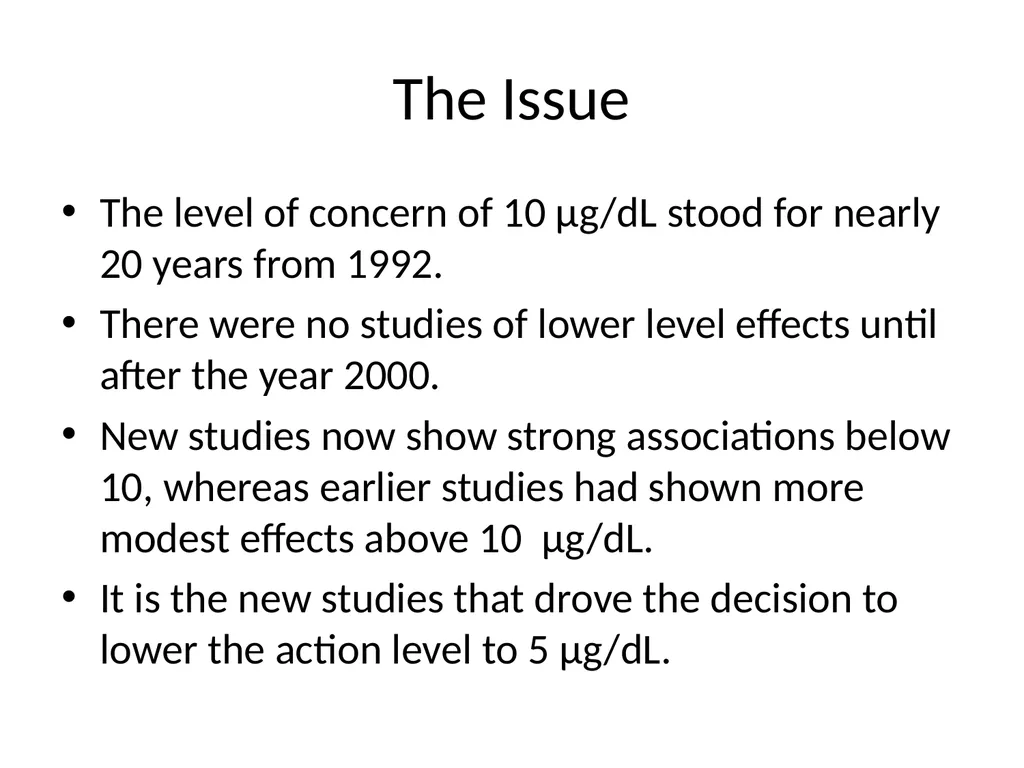
slide2. The Issue The level of concern of 10 µg/dL stood for nearly 20 years from 1992.
There were no studies of lower level effects until after the year 2000.
New studies now show strong associations below 10, whereas earlier studies had shown more modest effects above 10 µg/dL.
It is the new studies that drove the decision to lower the action level to 5 µg/dL.<br>
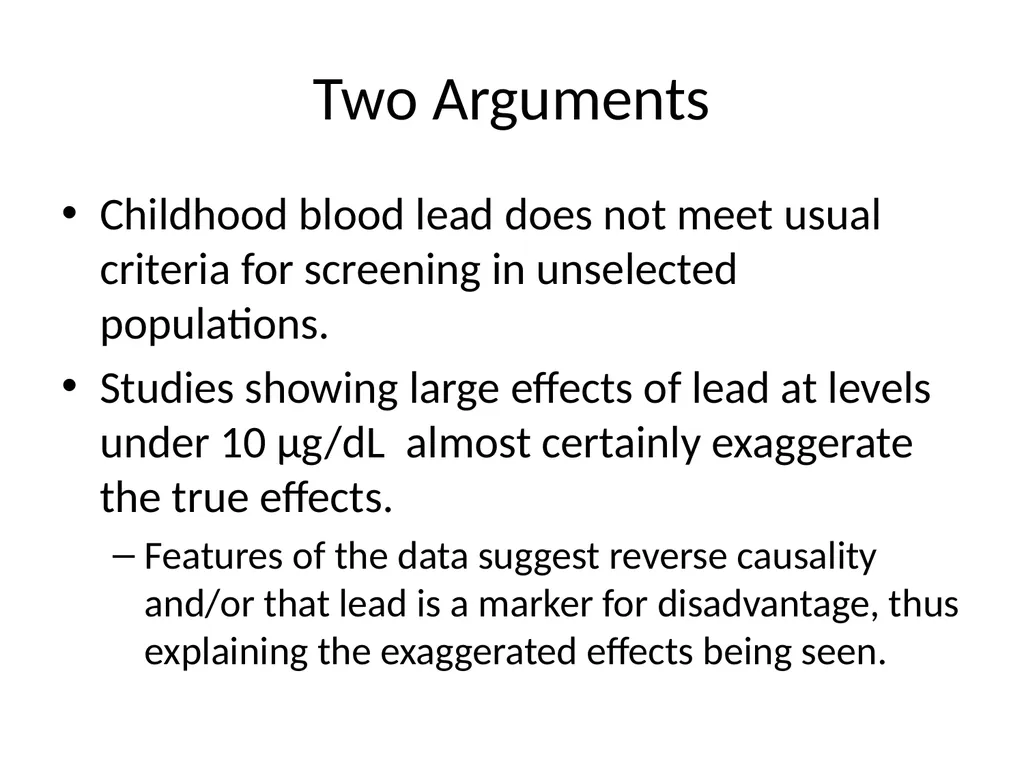
slide3. Two Arguments Childhood blood lead does not meet usual criteria for screening in unselected populations.
Studies showing large effects of lead at levels under 10 µg/dL almost certainly exaggerate the true effects.
Features of the data suggest reverse causality and/or that lead is a marker for disadvantage, thus explaining the exaggerated effects being seen.<br>
slide4. Let’s Not Go Backwards Toxic in very small amounts
Was a common cause of anemia, neuropathy, encephalopathy and death in US children
Evidence for adverse effects on children’s behavioral and cognitive development above 10 µg/dL
No one wants to see levels go back up
BUT, how low is low enough?<br>
slide5. Screening Programs Create Hassle For the parents
In clinics and doctors’ offices
For children who don’t want to be stuck
In arranging follow-up of high levels
AND THEY
Cost substantial money
Can cause harms such as unnecessary worry or poorly done abatements<br>
slide6. Screening Needs to be Justified Good screening test
Intervention/treatment must be available and effective
Should be a demonstrable overall health benefit – preferably proven in a randomized trial<br>
slide7. Screening Test Capillary tests may need confirmation
Venous blood reliability depends on lab. Generally good, but more misclassification at low levels.
Very low levels may require ICP-MS with increase in cost<br>
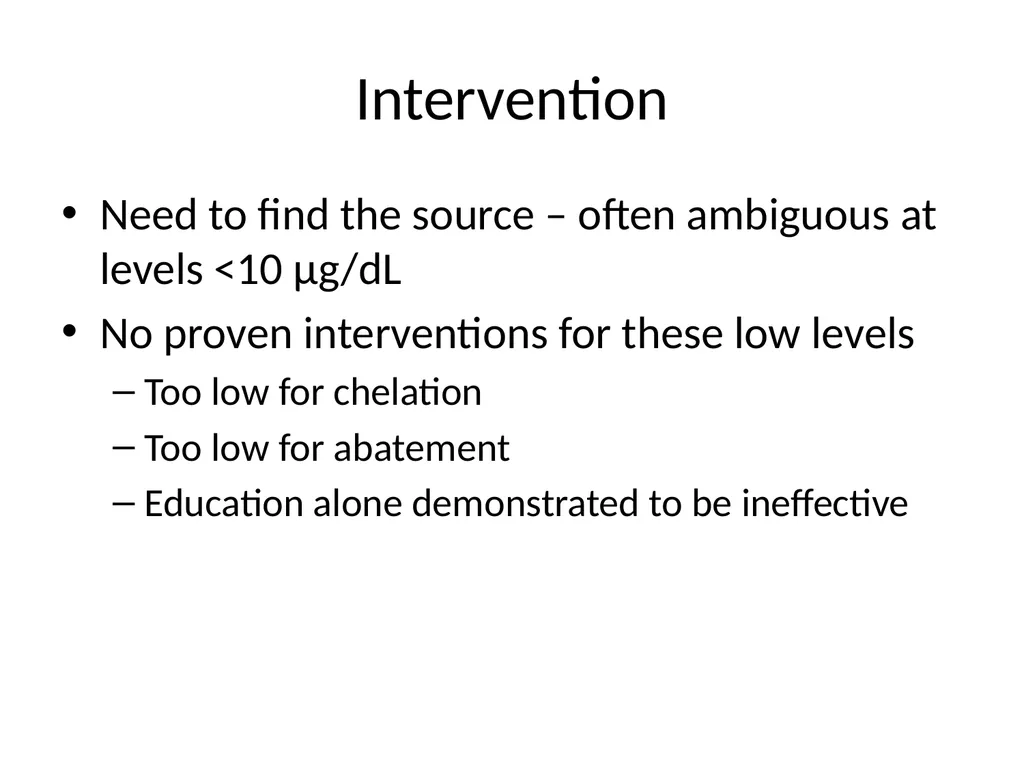
slide8. Intervention Need to find the source – often ambiguous at levels <10 µg/dL
No proven interventions for these low levels
Too low for chelation
Too low for abatement
Education alone demonstrated to be ineffective<br>
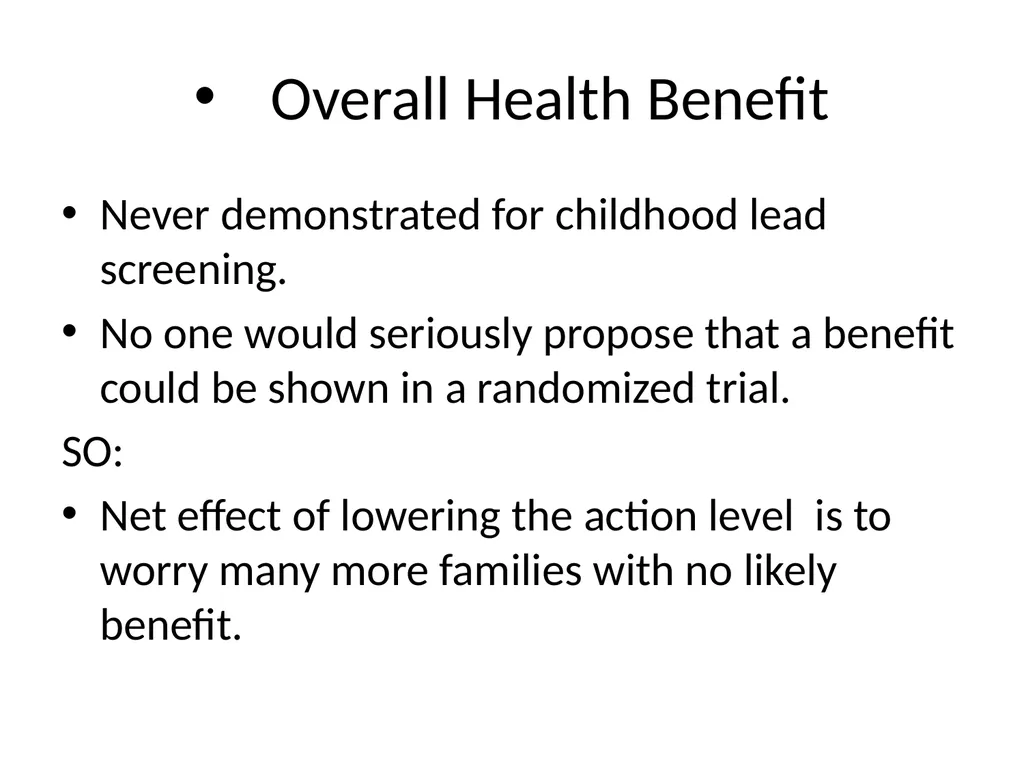
slide9. Overall Health Benefit Never demonstrated for childhood lead screening.
No one would seriously propose that a benefit could be shown in a randomized trial.
SO:
Net effect of lowering the action level is to worry many more families with no likely benefit.<br>
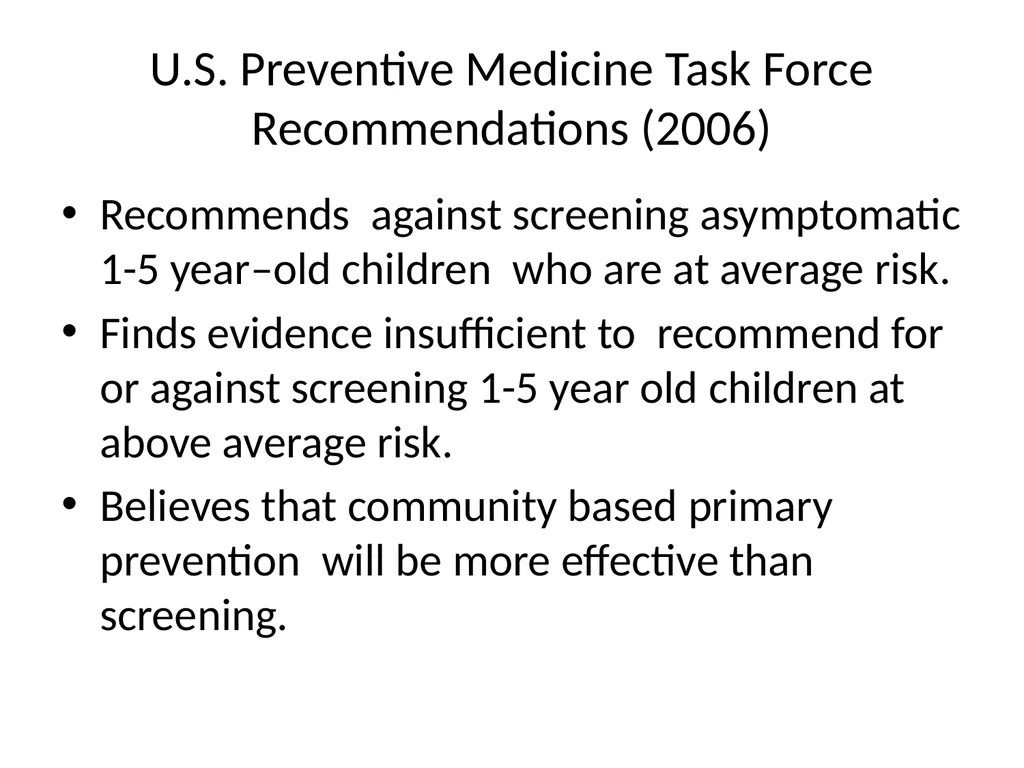
slide10. U.S. Preventive Medicine Task Force Recommendations (2006) Recommends against screening asymptomatic 1-5 year–old children who are at average risk.
Finds evidence insufficient to recommend for or against screening 1-5 year old children at above average risk.
Believes that community based primary prevention will be more effective than screening.<br>
slide11. Why Should We Conclude That The New Studies at Blood Lead Levels < 10 Exaggerate Lead Effects?<br>
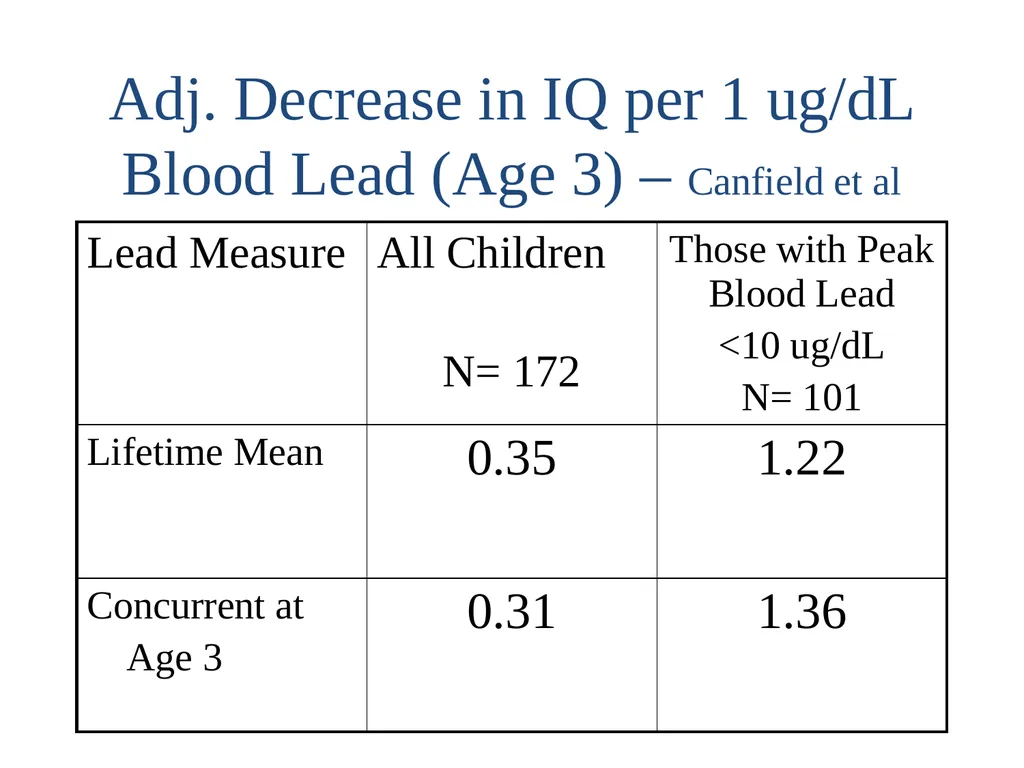
slide13. Adj. Decrease in IQ per 1 ug/dL Blood Lead (Age 3) – Canfield et al<br>
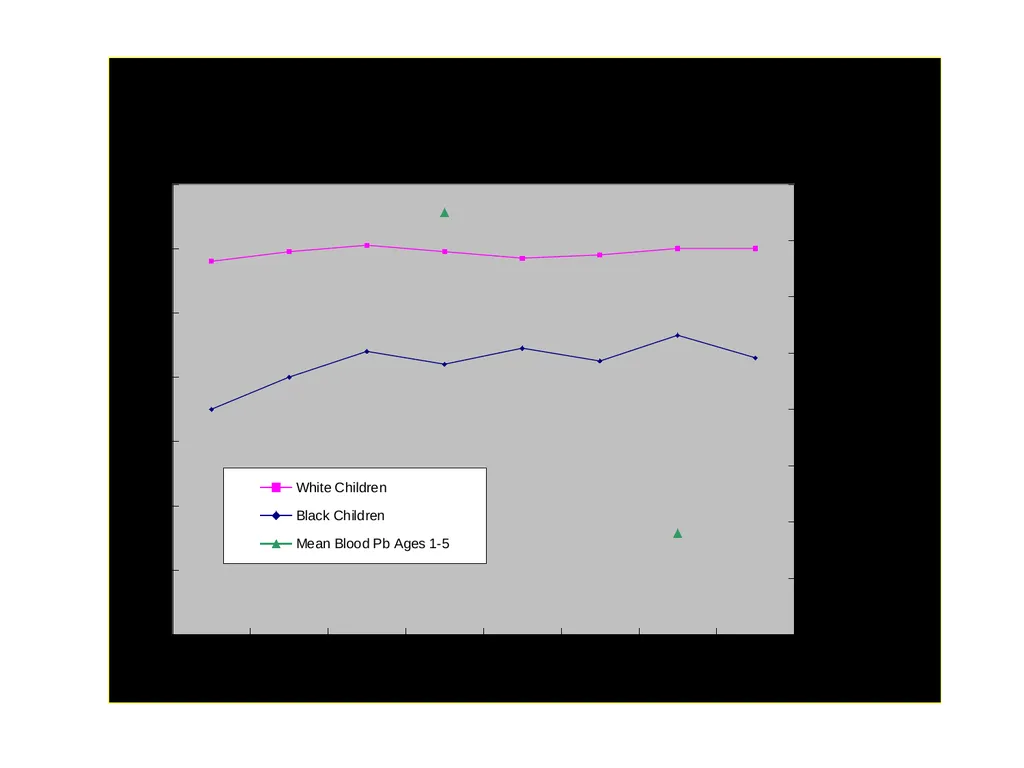
slide14. Change in Mean Blood Lead in U.S. 1-5 Year Old ChildrenNHANES Data<br>
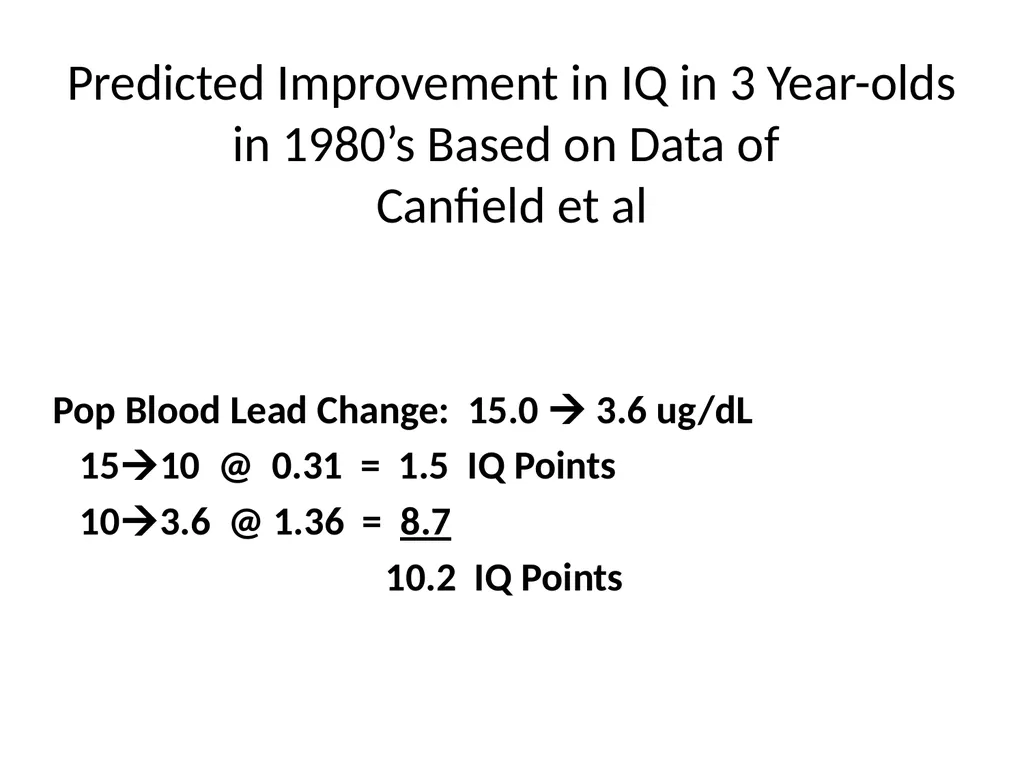
slide15. Predicted Improvement in IQ in 3 Year-olds in 1980’s Based on Data of Canfield et al Pop Blood Lead Change: 15.0 ïƒ 3.6 ug/dL
15ïƒ 10 @ 0.31 = 1.5 IQ Points
10ïƒ 3.6 @ 1.36 = 8.7
10.2 IQ Points<br>
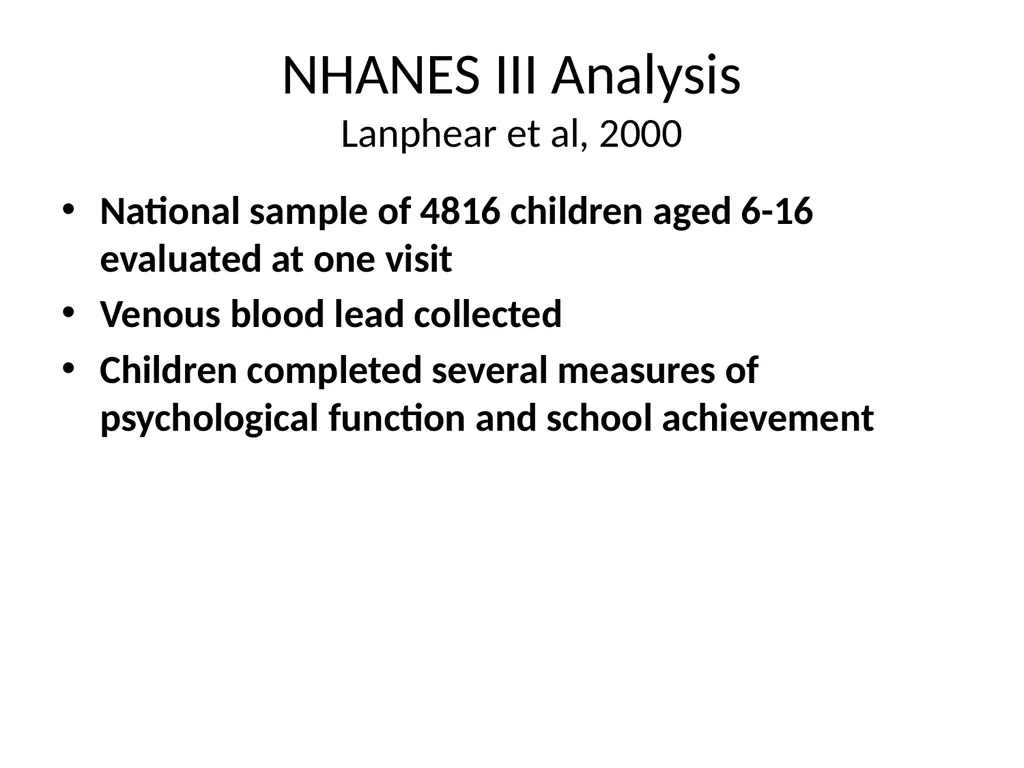
slide16. NHANES III AnalysisLanphear et al, 2000 National sample of 4816 children aged 6-16 evaluated at one visit
Venous blood lead collected
Children completed several measures of psychological function and school achievement<br>
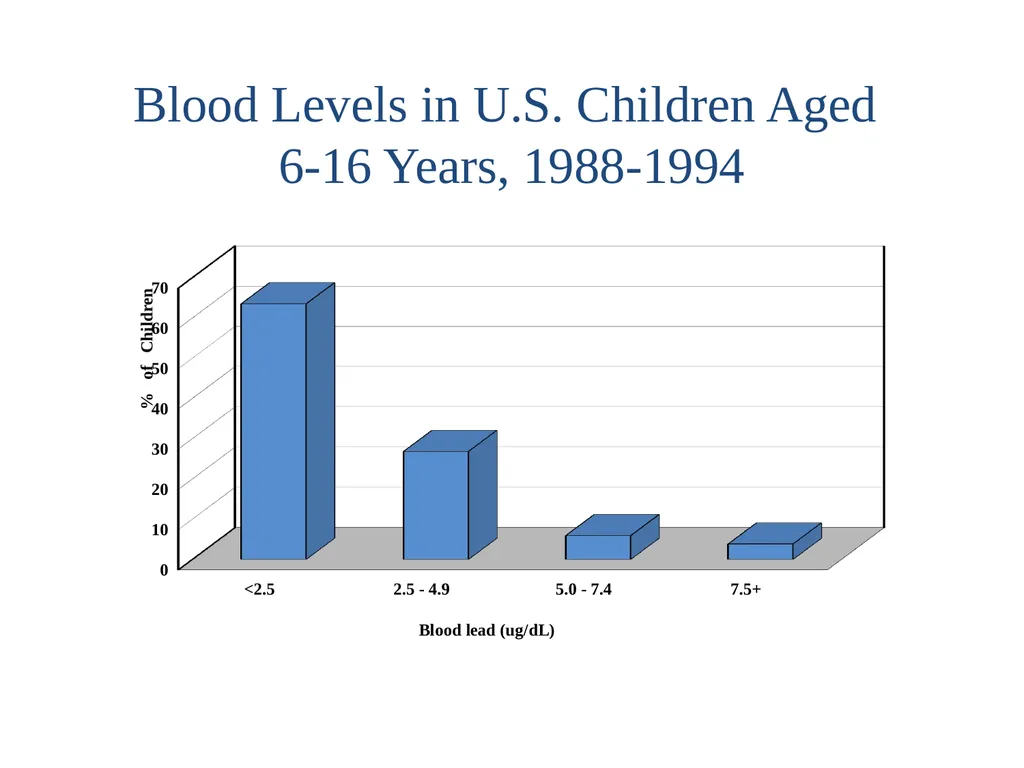
slide17. Blood Levels in U.S. Children Aged 6-16 Years, 1988-1994<br>
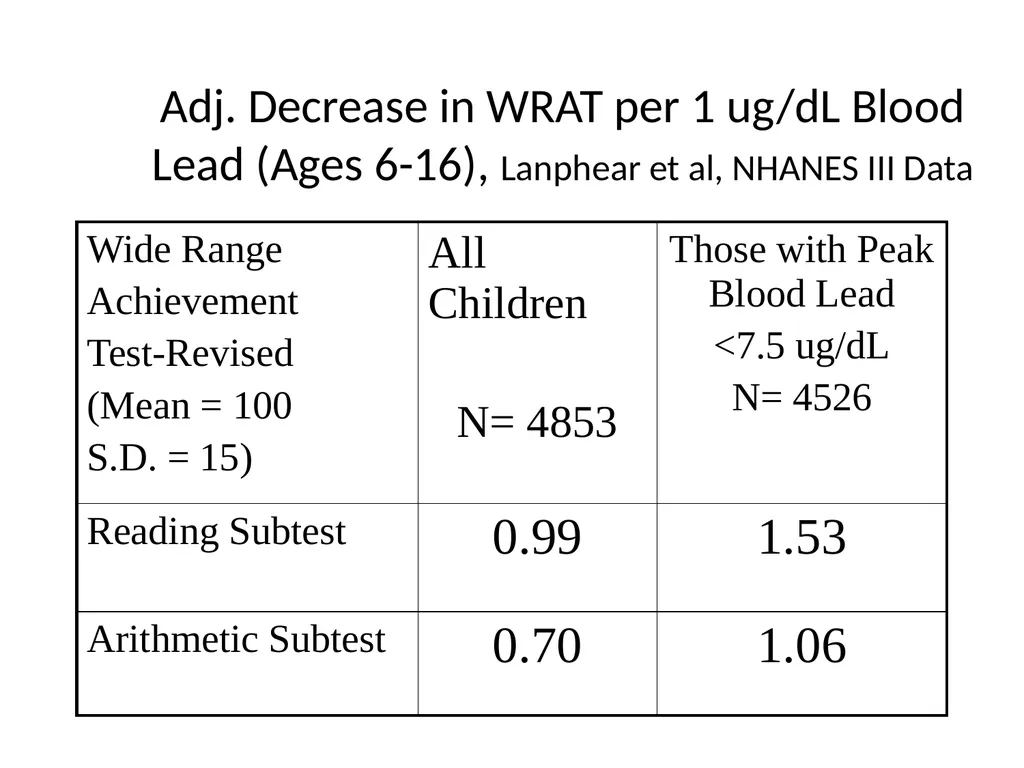
slide18. Adj. Decrease in WRAT per 1 ug/dL Blood Lead (Ages 6-16), Lanphear et al, NHANES III Data<br>
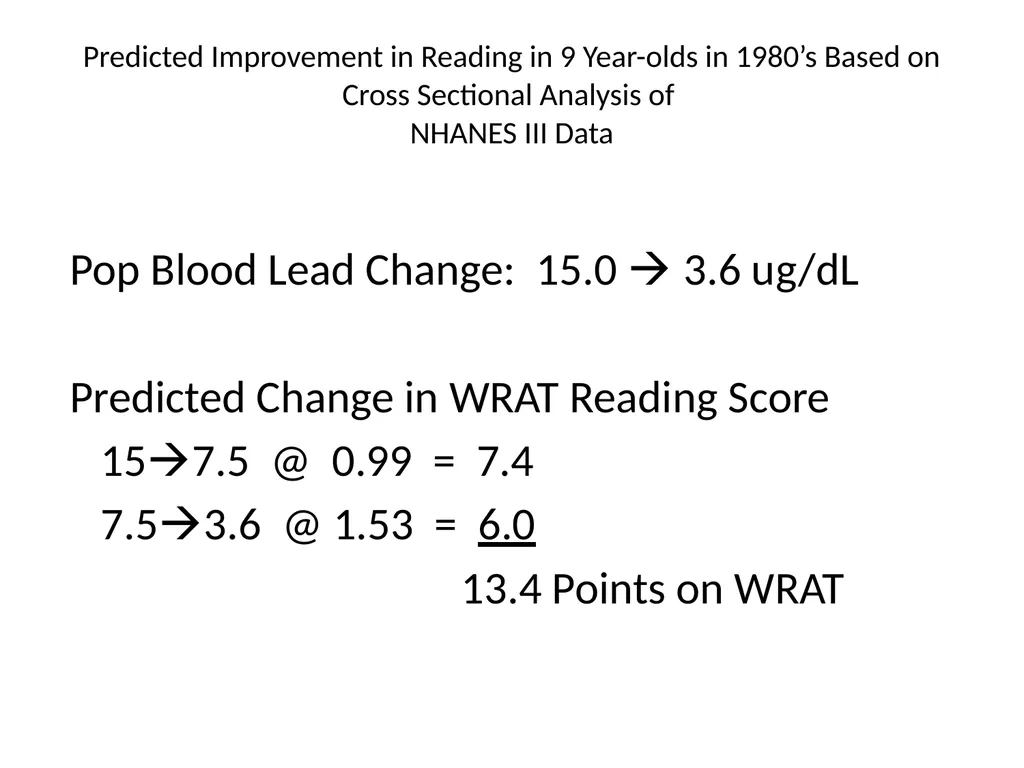
slide19. Predicted Improvement in Reading in 9 Year-olds in 1980’s Based on Cross Sectional Analysis of NHANES III Data Pop Blood Lead Change: 15.0 ïƒ 3.6 ug/dL
Predicted Change in WRAT Reading Score
15ïƒ 7.5 @ 0.99 = 7.4
7.5ïƒ 3.6 @ 1.53 = 6.0
13.4 Points on WRAT<br>
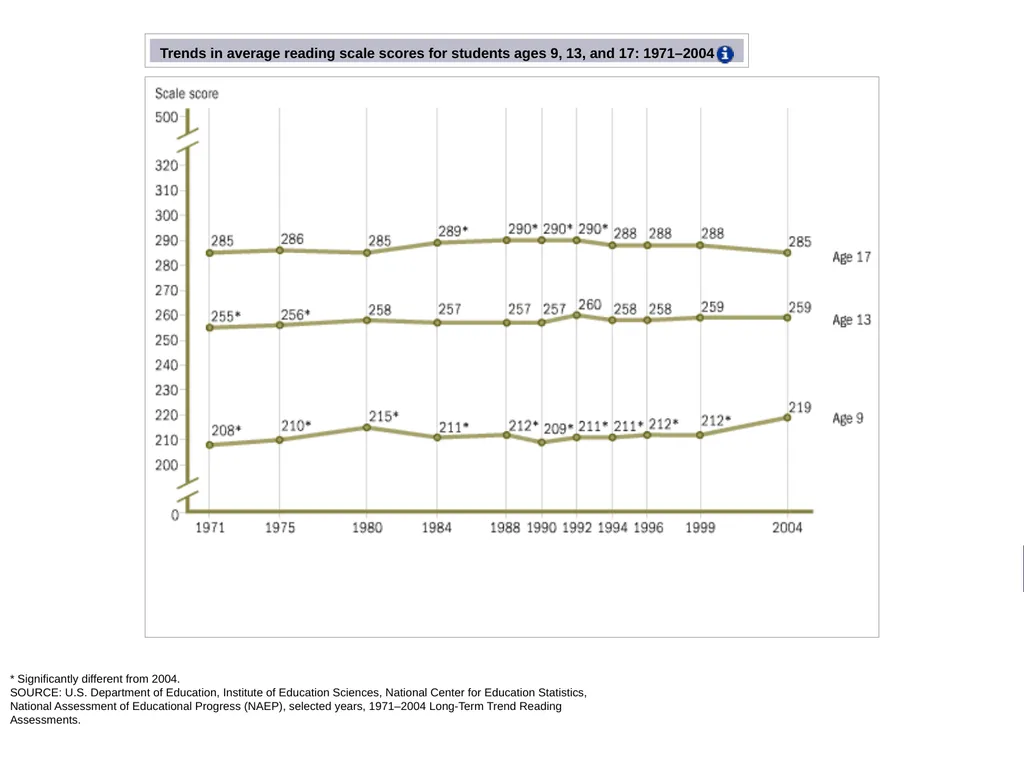
slide21. * Significantly different from 2004.SOURCE: U.S. Department of Education, Institute of Education Sciences, National Center for Education Statistics, National Assessment of Educational Progress (NAEP), selected years, 1971–2004 Long-Term Trend Reading Assessments.<br>
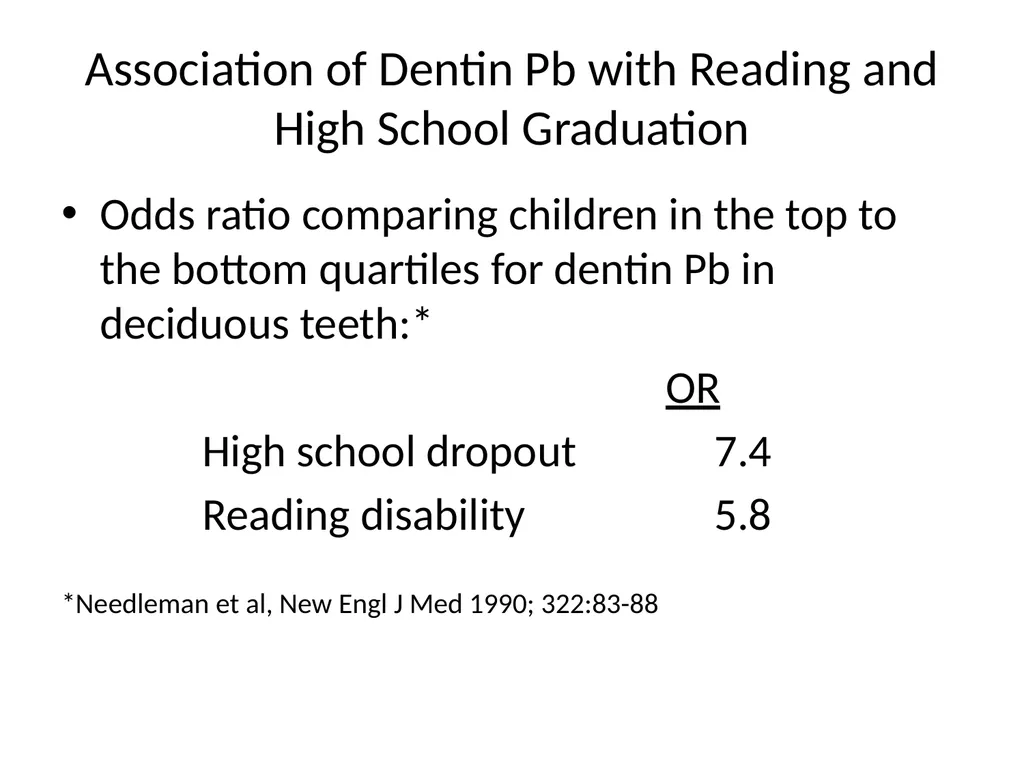
slide22. Association of Dentin Pb with Reading and High School Graduation Odds ratio comparing children in the top to the bottom quartiles for dentin Pb in deciduous teeth:*
OR
High school dropout 7.4
Reading disability 5.8
*Needleman et al, New Engl J Med 1990; 322:83-88<br>
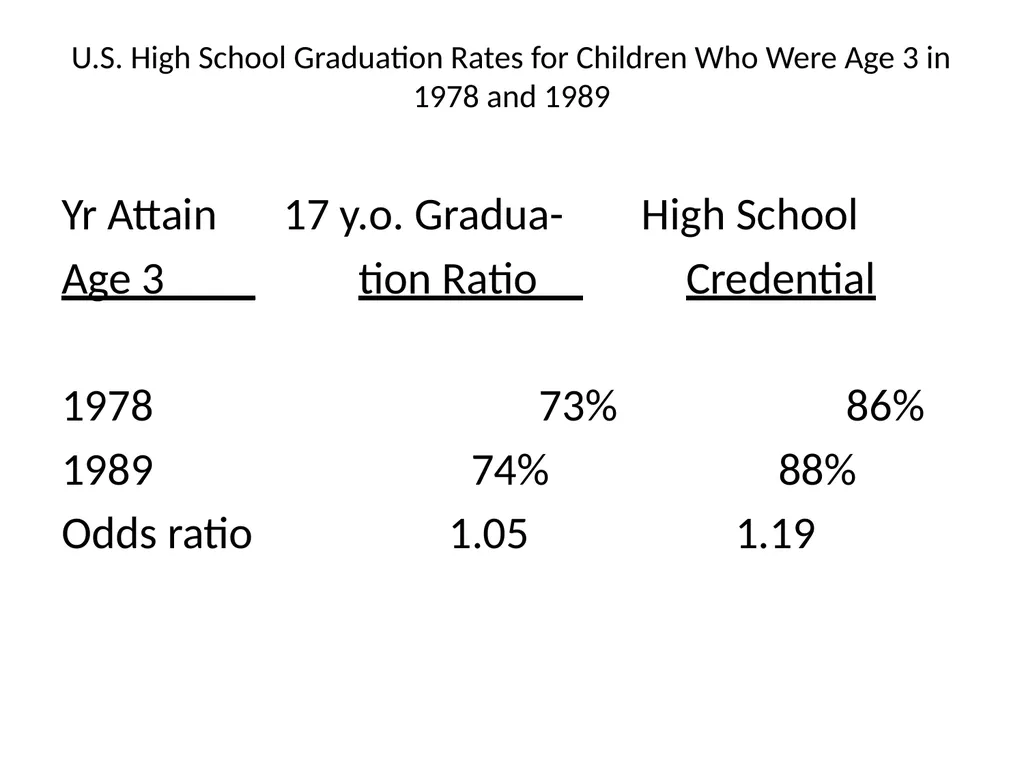
slide23. U.S. High School Graduation Rates for Children Who Were Age 3 in 1978 and 1989 Yr Attain 17 y.o. Gradua- High School
Age 3____ tion Ratio__ Credential
1978 73% 86%
1989 74% 88%
Odds ratio 1.05 1.19<br>
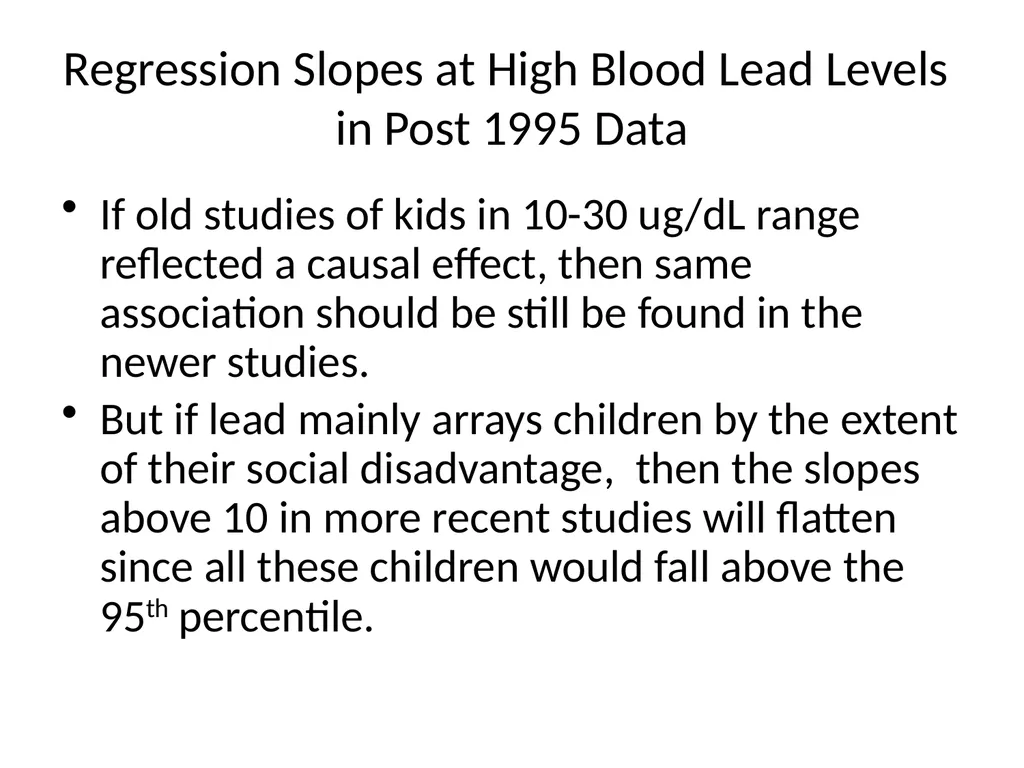
slide24. Regression Slopes at High Blood Lead Levels in Post 1995 Data If old studies of kids in 10-30 ug/dL range reflected a causal effect, then same association should be still be found in the newer studies.
But if lead mainly arrays children by the extent of their social disadvantage, then the slopes above 10 in more recent studies will flatten since all these children would fall above the 95th percentile.<br>
slide26. NHANES III Reading Scores My graduate student, Ben Wang, examined the NHANES III data referred to above and found that lead levels above 7.5 µg/dL were no longer associated with reading scores.
this contrasts sharply with Needleman’s earlier report which analyzed a population where the bulk of children had presumptive levels above
7.5 µg/dL.<br>
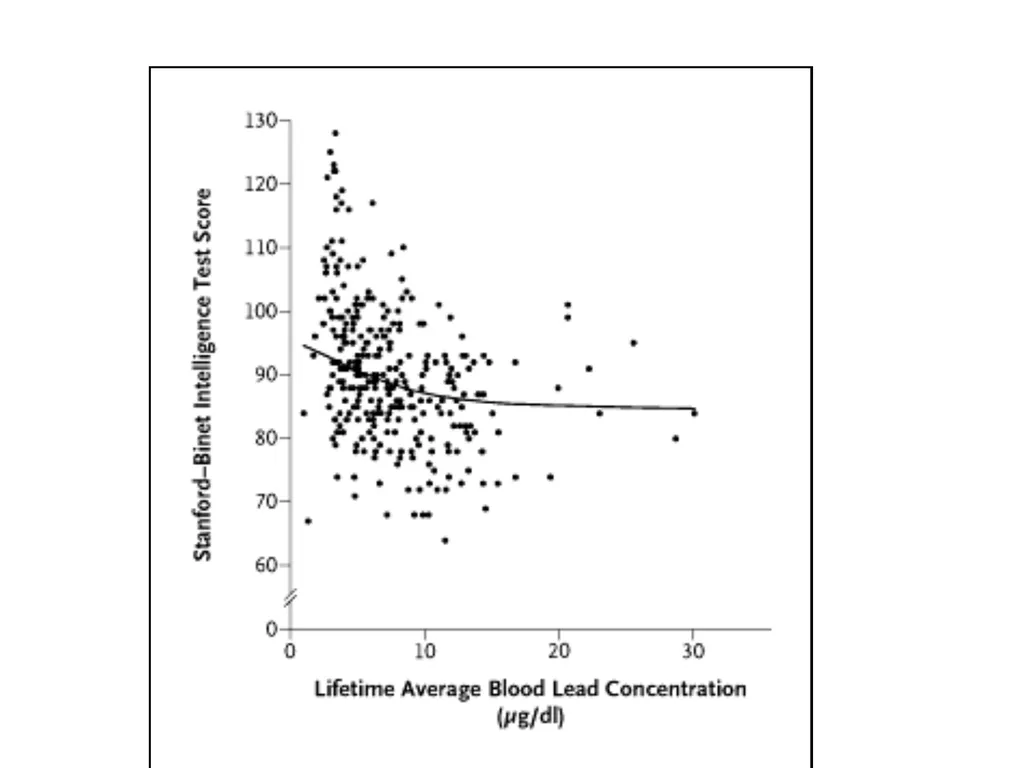
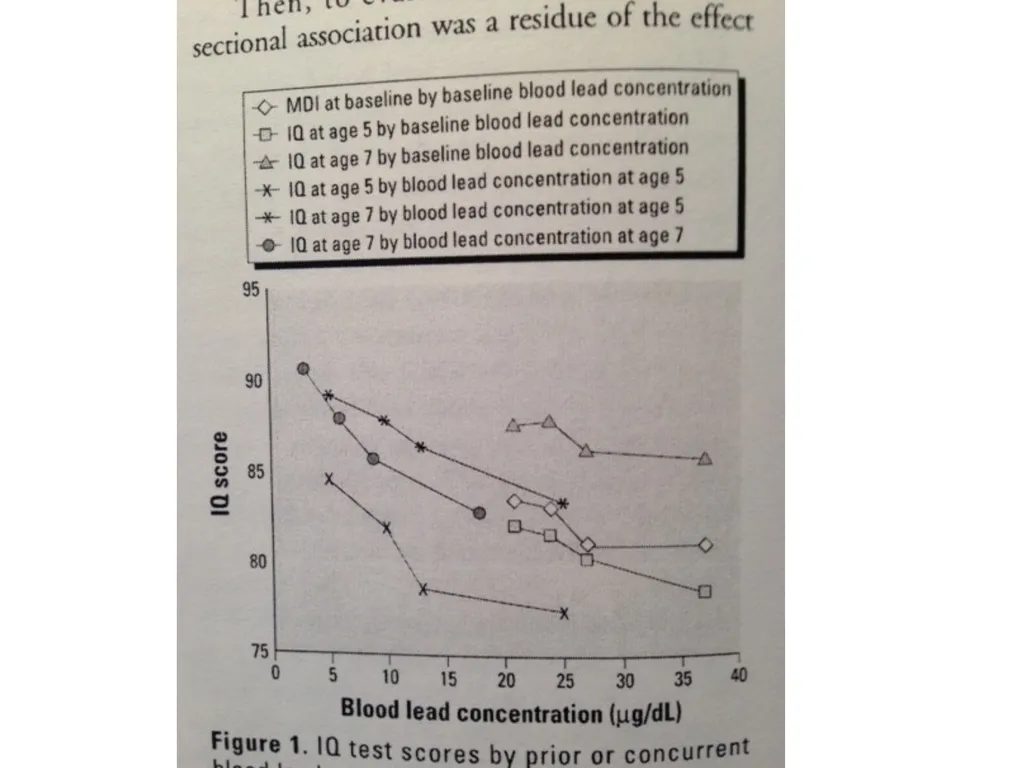
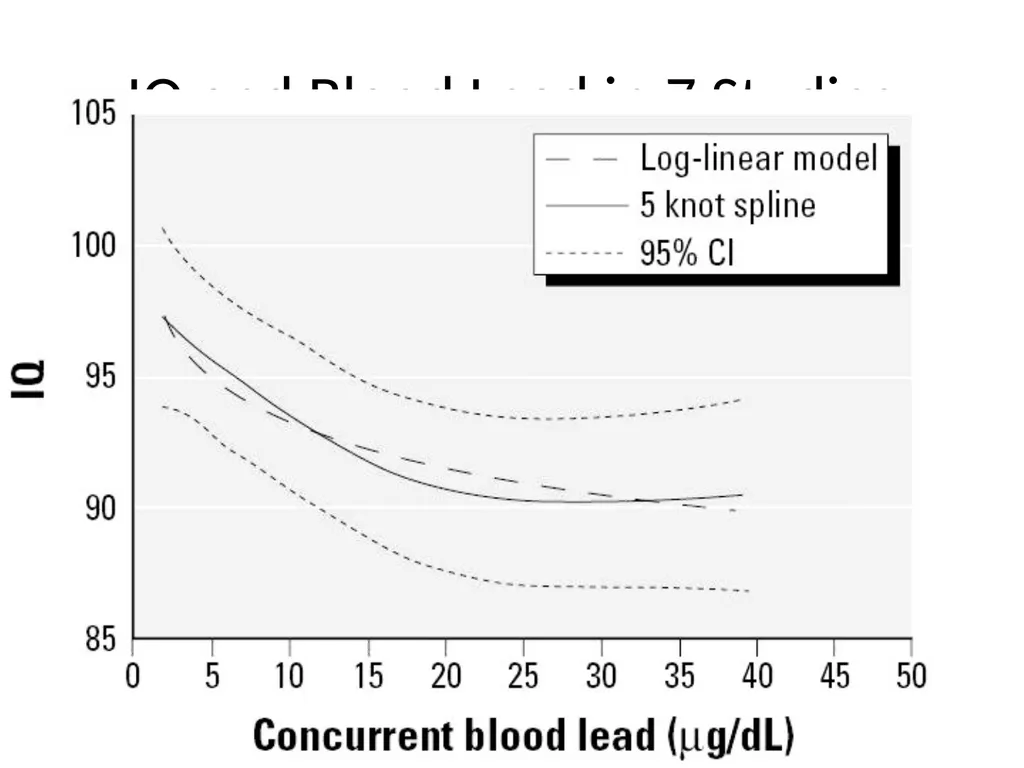
slide28. Stronger Blood Pb – IQ Relationship at <10ug/dL Suggests Reverse Causality Surprising finding obviously not widely predicted when level of concern was set at 10 ug/dL
Exactly what one would predict under a scenario where children with less IQ potential had
more hand-to-mouth activity, or
more opportunity to ingest non-foods<br>
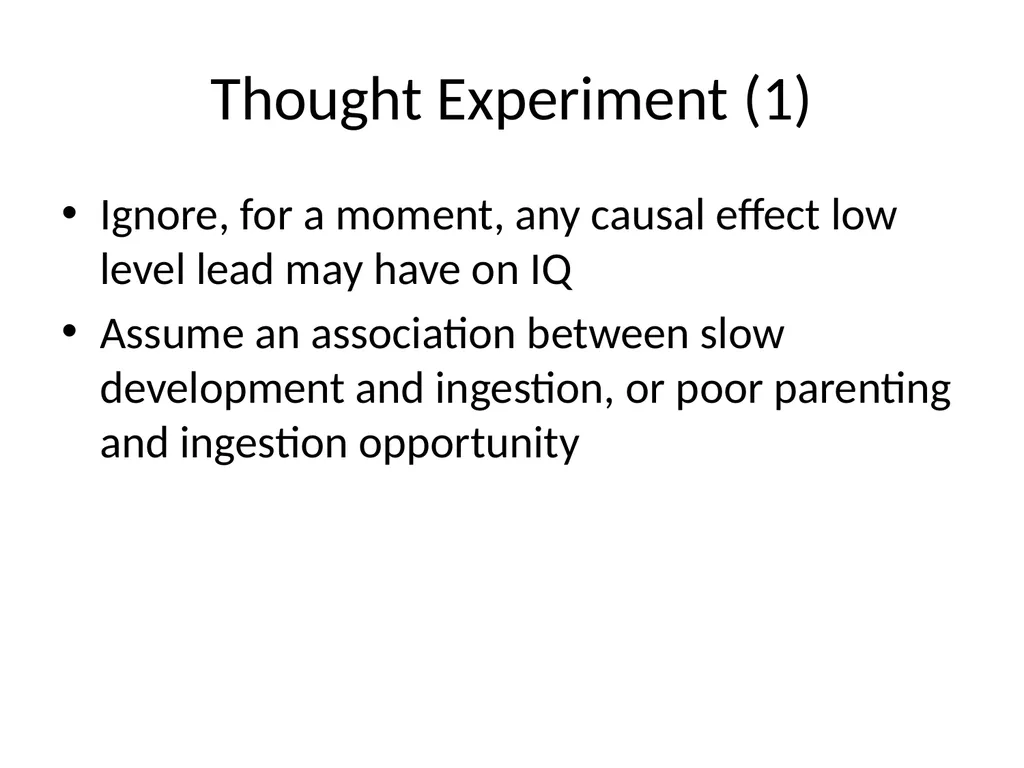
slide29. Thought Experiment (1) Ignore, for a moment, any causal effect low level lead may have on IQ
Assume an association between slow development and ingestion, or poor parenting and ingestion opportunity<br>
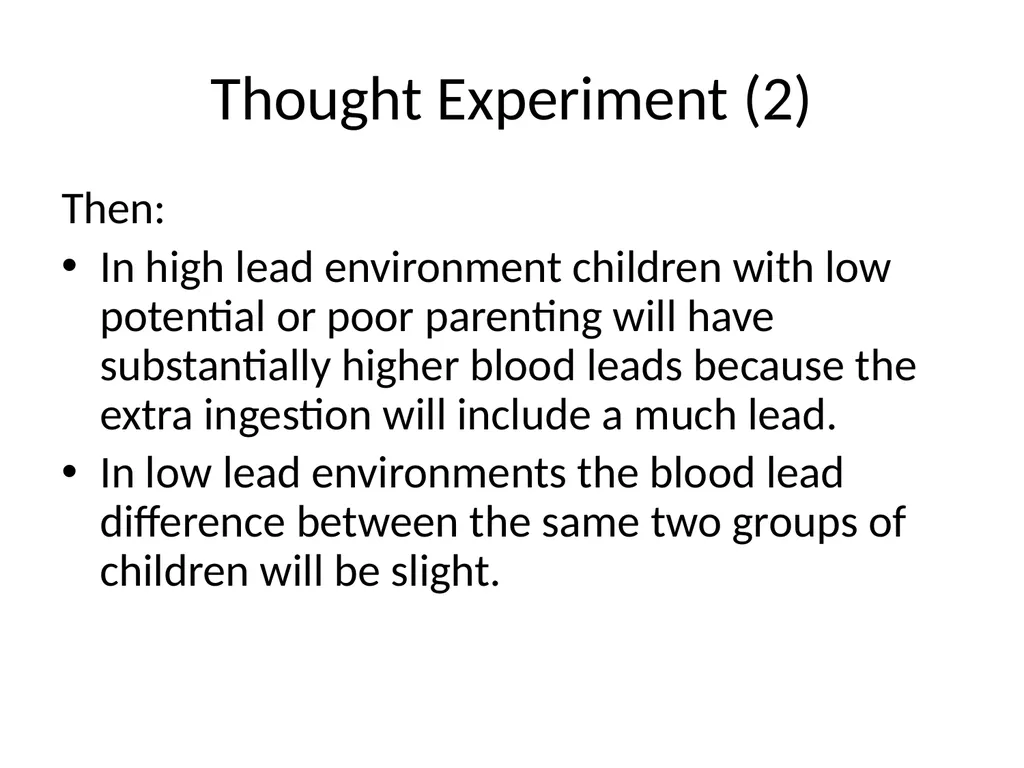
slide30. Thought Experiment (2) Then:
In high lead environment children with low potential or poor parenting will have substantially higher blood leads because the extra ingestion will include a much lead.
In low lead environments the blood lead difference between the same two groups of children will be slight.<br>
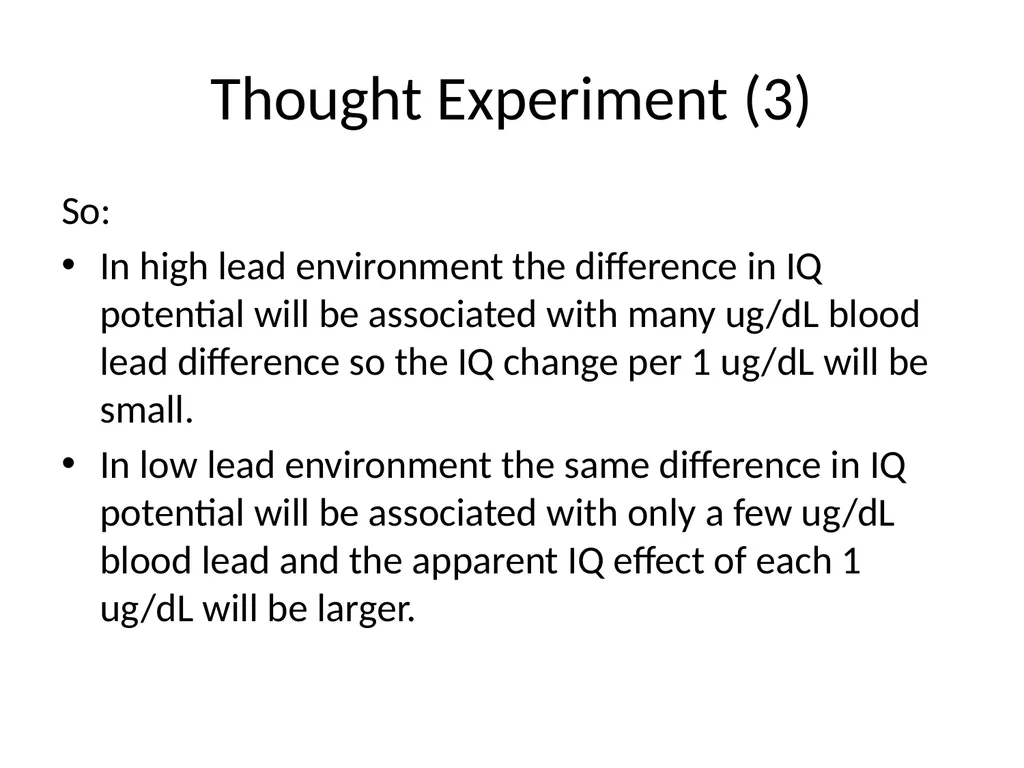
slide31. Thought Experiment (3) So:
In high lead environment the difference in IQ potential will be associated with many ug/dL blood lead difference so the IQ change per 1 ug/dL will be small.
In low lead environment the same difference in IQ potential will be associated with only a few ug/dL blood lead and the apparent IQ effect of each 1 ug/dL will be larger.<br>
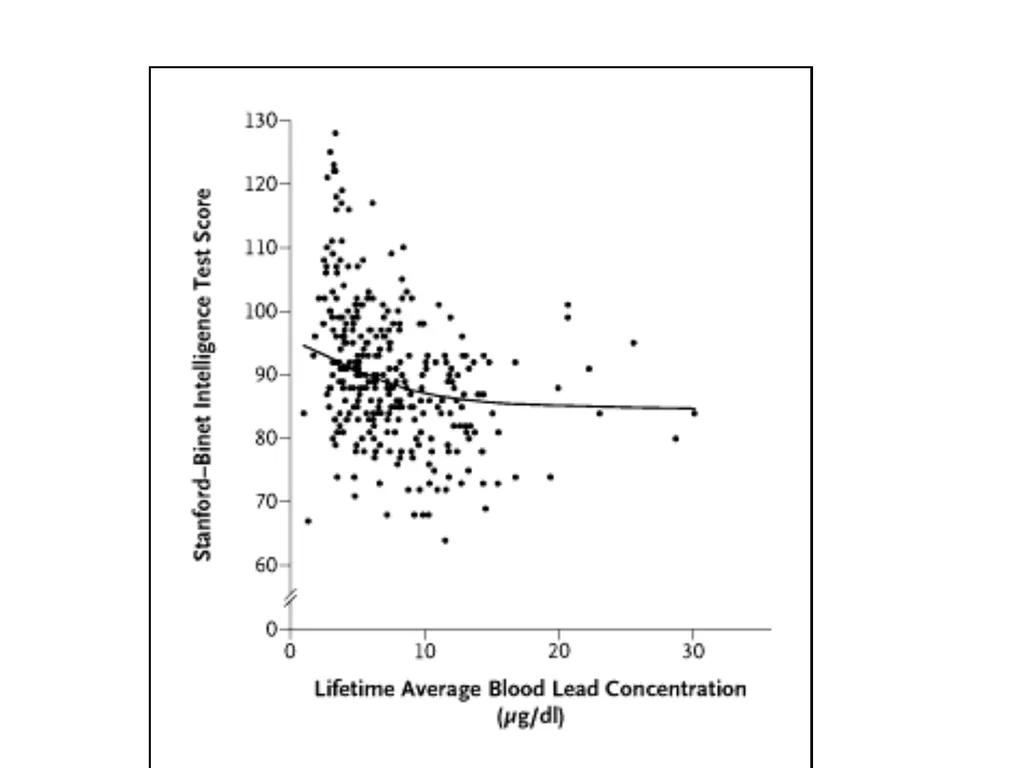
slide32. IQ and Blood Lead in 7 Studies Lanphear et al, 2005<br>
slide33. Summary The steep IQ-blood lead slopes reported in the recent low level studies do not appear credible.
There are indications of confounding and likely reverse causality.
Importantly, these considerations do not rule out a low level effect, although it is unlikely to be as strong as has been reported.<br>
slide34. Summary (con’t) Any low level effects need to be considered in the context of the 90% reduction in average blood lead that has been achieved in the U.S. since the 1970’s.
Since that huge reduction has not been associated with any agreed improvement in IQ, reading, ADHD, or other endpoints, it is very unlikely that any small reduction in blood lead that can be achieved by labeling children at 5-9 µg/dL will be of clinical/educational import.<br>

George G. Rhoads MD, MPH
Rutgers School of Public Health
October 2015<br>
slide2. The Issue The level of concern of 10 µg/dL stood for nearly 20 years from 1992.
There were no studies of lower level effects until after the year 2000.
New studies now show strong associations below 10, whereas earlier studies had shown more modest effects above 10 µg/dL.
It is the new studies that drove the decision to lower the action level to 5 µg/dL.<br>
slide3. Two Arguments Childhood blood lead does not meet usual criteria for screening in unselected populations.
Studies showing large effects of lead at levels under 10 µg/dL almost certainly exaggerate the true effects.
Features of the data suggest reverse causality and/or that lead is a marker for disadvantage, thus explaining the exaggerated effects being seen.<br>
slide4. Let’s Not Go Backwards Toxic in very small amounts
Was a common cause of anemia, neuropathy, encephalopathy and death in US children
Evidence for adverse effects on children’s behavioral and cognitive development above 10 µg/dL
No one wants to see levels go back up
BUT, how low is low enough?<br>
slide5. Screening Programs Create Hassle For the parents
In clinics and doctors’ offices
For children who don’t want to be stuck
In arranging follow-up of high levels
AND THEY
Cost substantial money
Can cause harms such as unnecessary worry or poorly done abatements<br>
slide6. Screening Needs to be Justified Good screening test
Intervention/treatment must be available and effective
Should be a demonstrable overall health benefit – preferably proven in a randomized trial<br>
slide7. Screening Test Capillary tests may need confirmation
Venous blood reliability depends on lab. Generally good, but more misclassification at low levels.
Very low levels may require ICP-MS with increase in cost<br>
slide8. Intervention Need to find the source – often ambiguous at levels <10 µg/dL
No proven interventions for these low levels
Too low for chelation
Too low for abatement
Education alone demonstrated to be ineffective<br>
slide9. Overall Health Benefit Never demonstrated for childhood lead screening.
No one would seriously propose that a benefit could be shown in a randomized trial.
SO:
Net effect of lowering the action level is to worry many more families with no likely benefit.<br>
slide10. U.S. Preventive Medicine Task Force Recommendations (2006) Recommends against screening asymptomatic 1-5 year–old children who are at average risk.
Finds evidence insufficient to recommend for or against screening 1-5 year old children at above average risk.
Believes that community based primary prevention will be more effective than screening.<br>
slide11. Why Should We Conclude That The New Studies at Blood Lead Levels < 10 Exaggerate Lead Effects?<br>
slide13. Adj. Decrease in IQ per 1 ug/dL Blood Lead (Age 3) – Canfield et al<br>
slide14. Change in Mean Blood Lead in U.S. 1-5 Year Old ChildrenNHANES Data<br>
slide15. Predicted Improvement in IQ in 3 Year-olds in 1980’s Based on Data of Canfield et al Pop Blood Lead Change: 15.0 ïƒ 3.6 ug/dL
15ïƒ 10 @ 0.31 = 1.5 IQ Points
10ïƒ 3.6 @ 1.36 = 8.7
10.2 IQ Points<br>
slide16. NHANES III AnalysisLanphear et al, 2000 National sample of 4816 children aged 6-16 evaluated at one visit
Venous blood lead collected
Children completed several measures of psychological function and school achievement<br>
slide17. Blood Levels in U.S. Children Aged 6-16 Years, 1988-1994<br>
slide18. Adj. Decrease in WRAT per 1 ug/dL Blood Lead (Ages 6-16), Lanphear et al, NHANES III Data<br>
slide19. Predicted Improvement in Reading in 9 Year-olds in 1980’s Based on Cross Sectional Analysis of NHANES III Data Pop Blood Lead Change: 15.0 ïƒ 3.6 ug/dL
Predicted Change in WRAT Reading Score
15ïƒ 7.5 @ 0.99 = 7.4
7.5ïƒ 3.6 @ 1.53 = 6.0
13.4 Points on WRAT<br>
slide21. * Significantly different from 2004.SOURCE: U.S. Department of Education, Institute of Education Sciences, National Center for Education Statistics, National Assessment of Educational Progress (NAEP), selected years, 1971–2004 Long-Term Trend Reading Assessments.<br>
slide22. Association of Dentin Pb with Reading and High School Graduation Odds ratio comparing children in the top to the bottom quartiles for dentin Pb in deciduous teeth:*
OR
High school dropout 7.4
Reading disability 5.8
*Needleman et al, New Engl J Med 1990; 322:83-88<br>
slide23. U.S. High School Graduation Rates for Children Who Were Age 3 in 1978 and 1989 Yr Attain 17 y.o. Gradua- High School
Age 3____ tion Ratio__ Credential
1978 73% 86%
1989 74% 88%
Odds ratio 1.05 1.19<br>
slide24. Regression Slopes at High Blood Lead Levels in Post 1995 Data If old studies of kids in 10-30 ug/dL range reflected a causal effect, then same association should be still be found in the newer studies.
But if lead mainly arrays children by the extent of their social disadvantage, then the slopes above 10 in more recent studies will flatten since all these children would fall above the 95th percentile.<br>
slide26. NHANES III Reading Scores My graduate student, Ben Wang, examined the NHANES III data referred to above and found that lead levels above 7.5 µg/dL were no longer associated with reading scores.
this contrasts sharply with Needleman’s earlier report which analyzed a population where the bulk of children had presumptive levels above
7.5 µg/dL.<br>
slide28. Stronger Blood Pb – IQ Relationship at <10ug/dL Suggests Reverse Causality Surprising finding obviously not widely predicted when level of concern was set at 10 ug/dL
Exactly what one would predict under a scenario where children with less IQ potential had
more hand-to-mouth activity, or
more opportunity to ingest non-foods<br>
slide29. Thought Experiment (1) Ignore, for a moment, any causal effect low level lead may have on IQ
Assume an association between slow development and ingestion, or poor parenting and ingestion opportunity<br>
slide30. Thought Experiment (2) Then:
In high lead environment children with low potential or poor parenting will have substantially higher blood leads because the extra ingestion will include a much lead.
In low lead environments the blood lead difference between the same two groups of children will be slight.<br>
slide31. Thought Experiment (3) So:
In high lead environment the difference in IQ potential will be associated with many ug/dL blood lead difference so the IQ change per 1 ug/dL will be small.
In low lead environment the same difference in IQ potential will be associated with only a few ug/dL blood lead and the apparent IQ effect of each 1 ug/dL will be larger.<br>
slide32. IQ and Blood Lead in 7 Studies Lanphear et al, 2005<br>
slide33. Summary The steep IQ-blood lead slopes reported in the recent low level studies do not appear credible.
There are indications of confounding and likely reverse causality.
Importantly, these considerations do not rule out a low level effect, although it is unlikely to be as strong as has been reported.<br>
slide34. Summary (con’t) Any low level effects need to be considered in the context of the 90% reduction in average blood lead that has been achieved in the U.S. since the 1970’s.
Since that huge reduction has not been associated with any agreed improvement in IQ, reading, ADHD, or other endpoints, it is very unlikely that any small reduction in blood lead that can be achieved by labeling children at 5-9 µg/dL will be of clinical/educational import.<br>