
The Dupont Model: Introduction P.V. Viswanath
CS
Published · 44 slides · 0 views

1 / 1


Description
The Dupont Model: Introduction P.V. Viswanath Financial Strategy and Business Decisions What is the Dupont Model? The Dupont Model is an approach to separating out the different sources of a firms profitability. According to Flesher and
Related Topics
Share
Embed code
Download this presentation From Below
"The Dupont Model: Introduction P.V. Viswanath" is the property of its rightful owner. Permission is granted to download and print the materials on this website for personal, non-commercial use only, and to display it on your personal computer provided you do not modify the materials and that you retain all copyright notices contained in the materials. By downloading content from our website, you accept the terms of this agreement.
Presentation Transcript
01
The Dupont Model: Introduction P.V. Viswanath Financial Strategy
and
Business Decisions<br>
and
Business Decisions<br>
02
What is the Dupont Model? The Dupont Model is an approach to separating out the different sources of a firm’s profitability.
According to Flesher and Previts (2013), the name comes from the DuPont company that began using this formula in the 1920s. DuPont explosives salesman Donaldson Brown invented the formula in an internal efficiency report in 1912.
The model’s utility is primarily for improving operating profitability, though it can be extended to include financial decisions, as well.
It starts with the Return on Assets and shows that this can be decomposed into the product of the profit margin and inventory turnover.
We will use the Dupont Model to show the interrelationships between marketing, production and financing decisions.<br>
According to Flesher and Previts (2013), the name comes from the DuPont company that began using this formula in the 1920s. DuPont explosives salesman Donaldson Brown invented the formula in an internal efficiency report in 1912.
The model’s utility is primarily for improving operating profitability, though it can be extended to include financial decisions, as well.
It starts with the Return on Assets and shows that this can be decomposed into the product of the profit margin and inventory turnover.
We will use the Dupont Model to show the interrelationships between marketing, production and financing decisions.<br>
03
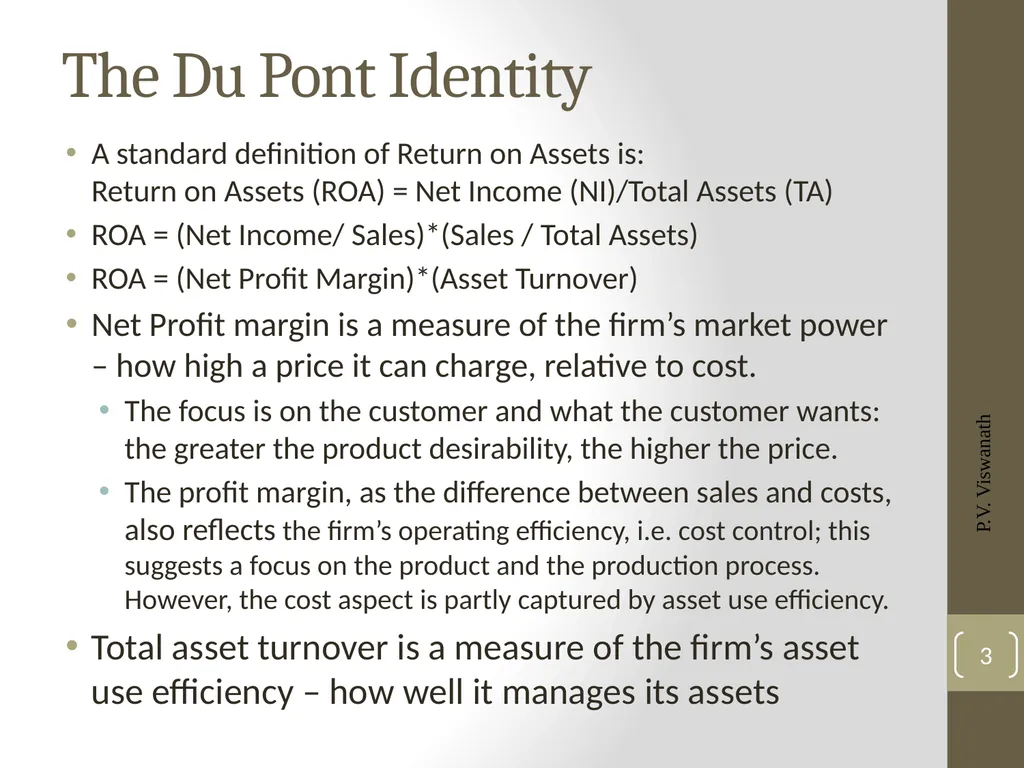
P.V. Viswanath 3 The Du Pont Identity A standard definition of Return on Assets is:
Return on Assets (ROA) = Net Income (NI)/Total Assets (TA)
ROA = (Net Income/ Sales)*(Sales / Total Assets)
ROA = (Net Profit Margin)*(Asset Turnover)
Net Profit margin is a measure of the firm’s market power – how high a price it can charge, relative to cost.
The focus is on the customer and what the customer wants: the greater the product desirability, the higher the price.
The profit margin, as the difference between sales and costs, also reflects the firm’s operating efficiency, i.e. cost control; this suggests a focus on the product and the production process. However, the cost aspect is partly captured by asset use efficiency.
Total asset turnover is a measure of the firm’s asset use efficiency – how well it manages its assets<br>
ROA = (Net Income/ Sales)*(Sales / Total Assets)
ROA = (Net Profit Margin)*(Asset Turnover)
Net Profit margin is a measure of the firm’s market power – how high a price it can charge, relative to cost.
The focus is on the customer and what the customer wants: the greater the product desirability, the higher the price.
The profit margin, as the difference between sales and costs, also reflects the firm’s operating efficiency, i.e. cost control; this suggests a focus on the product and the production process. However, the cost aspect is partly captured by asset use efficiency.
Total asset turnover is a measure of the firm’s asset use efficiency – how well it manages its assets<br>
04
Sources of Profit Margin From a customer focus perspective, Profit Margin derives from pricing power, and is influenced by factors such as:
product innovation,
product positioning,
brand name recognition,
first mover advantage
market niches
established marketing channels,
customer loyalty,
unique supply sources,
favorable contracts with customers or suppliers,
patents and copyrights.<br>
product innovation,
product positioning,
brand name recognition,
first mover advantage
market niches
established marketing channels,
customer loyalty,
unique supply sources,
favorable contracts with customers or suppliers,
patents and copyrights.<br>
05
Sources of Asset Utilization Efficiency Asset Turnover measures asset utilization and efficiency, on the other hand, generally comes from the
efficient use of property, plant, and equipment;
efficient inventory processes
Efficiency in the use of working capital.<br>
efficient use of property, plant, and equipment;
efficient inventory processes
Efficiency in the use of working capital.<br>
06
The Du Pont Identity & Strategy The decomposition is a mathematical tautology and is, in itself, worthless.
However, its value lies in the implication that the two components of ROA represent two alternative strategies for the maximization of a firm’s profits.
In other words, a firm could have a high volume/low margin strategy, which would be reflected in high asset turnover but low profit margins or the reverse.<br>
However, its value lies in the implication that the two components of ROA represent two alternative strategies for the maximization of a firm’s profits.
In other words, a firm could have a high volume/low margin strategy, which would be reflected in high asset turnover but low profit margins or the reverse.<br>
07
Low
Margin High
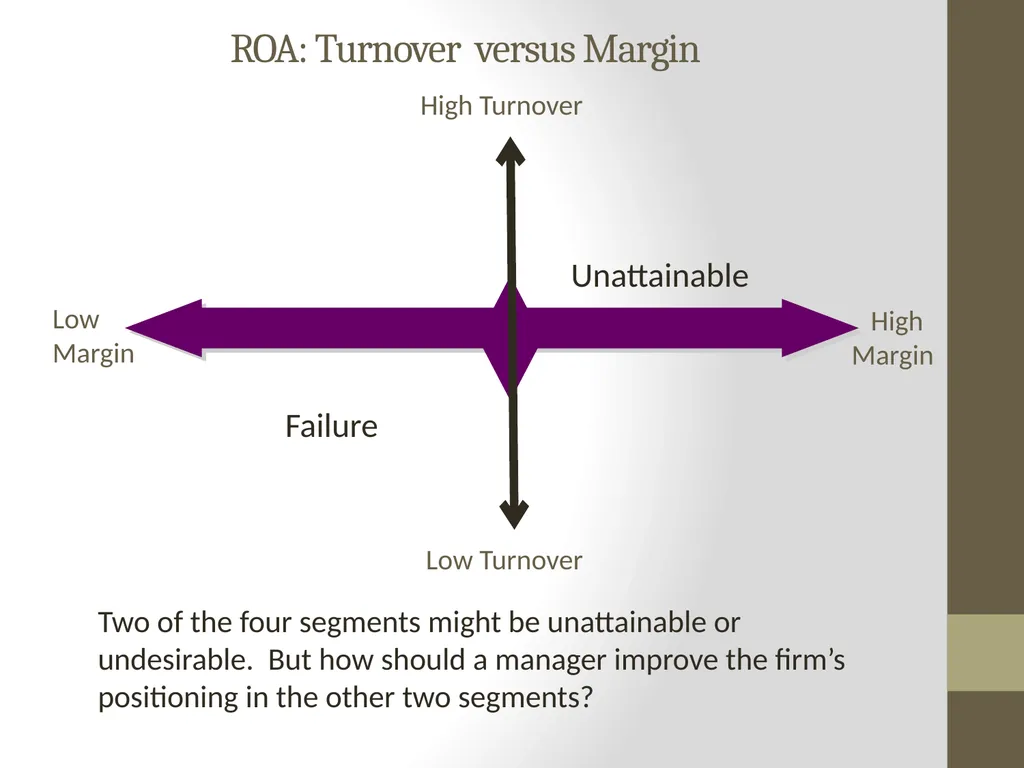
Margin Low Turnover High Turnover Failure ROA: Turnover versus Margin Unattainable Two of the four segments might be unattainable or undesirable. But how should a manager improve the firm’s positioning in the other two segments?<br>
Margin High
Margin Low Turnover High Turnover Failure ROA: Turnover versus Margin Unattainable Two of the four segments might be unattainable or undesirable. But how should a manager improve the firm’s positioning in the other two segments?<br>
08
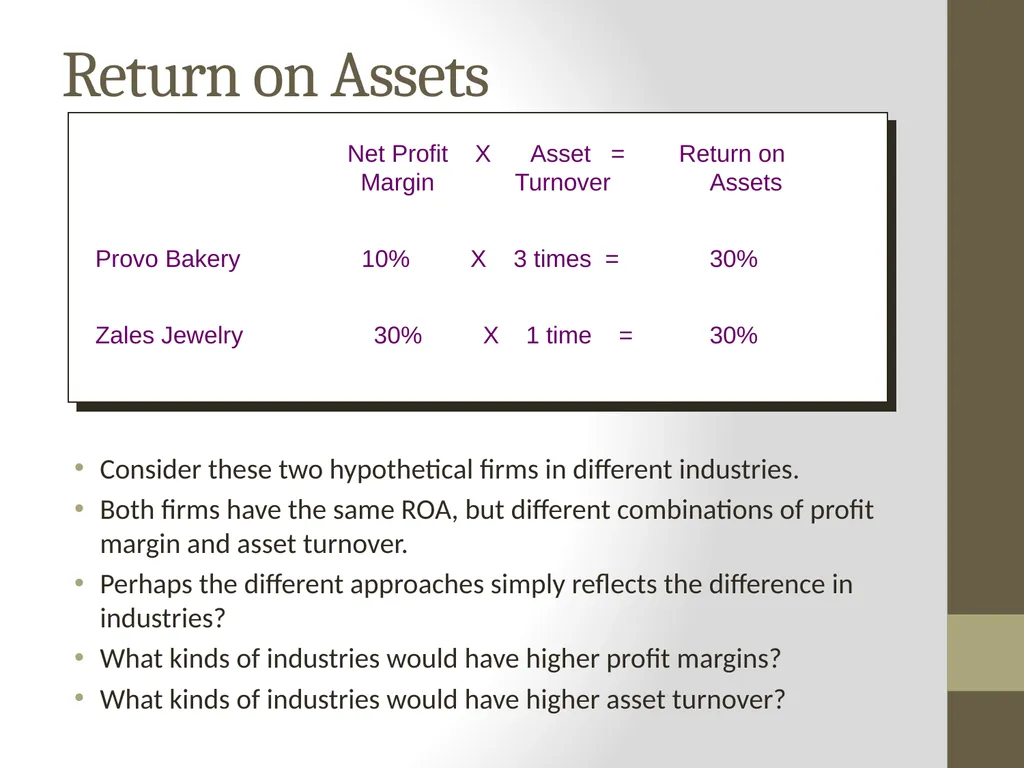
Return on Assets Consider these two hypothetical firms in different industries.
Both firms have the same ROA, but different combinations of profit margin and asset turnover.
Perhaps the different approaches simply reflects the difference in industries?
What kinds of industries would have higher profit margins?
What kinds of industries would have higher asset turnover? Net Profit X Asset = Return on Margin Turnover Assets
Provo Bakery 10% X 3 times = 30%
Zales Jewelry 30% X 1 time = 30%<br>
Both firms have the same ROA, but different combinations of profit margin and asset turnover.
Perhaps the different approaches simply reflects the difference in industries?
What kinds of industries would have higher profit margins?
What kinds of industries would have higher asset turnover? Net Profit X Asset = Return on Margin Turnover Assets
Provo Bakery 10% X 3 times = 30%
Zales Jewelry 30% X 1 time = 30%<br>
09
Du Pont ratios and Industries According to a 2021 study (https://csimarket.com/screening/index.php), the retail sector had the highest asset-turnover ratio (1.92), followed by consumer non-cyclicals (0.96), capital goods (0.83), energy (0.81) and consumer discretionary (0.77).
Within the retail sector, grocery stores (3.26) ranked highest, followed by wholesale stores, retail drugstores, retail technology stores and departmental stores.
According to Aswath Damodaran, using data for 2022, the non-financial industries with the highest net profit margin were Entertainment Software, Railroads, and Semiconductor.
It would seem that there is greater variation in these ratios across industries than within industries.
Thus, it would seem that these ratios characterize industries.<br>
Within the retail sector, grocery stores (3.26) ranked highest, followed by wholesale stores, retail drugstores, retail technology stores and departmental stores.
According to Aswath Damodaran, using data for 2022, the non-financial industries with the highest net profit margin were Entertainment Software, Railroads, and Semiconductor.
It would seem that there is greater variation in these ratios across industries than within industries.
Thus, it would seem that these ratios characterize industries.<br>
10
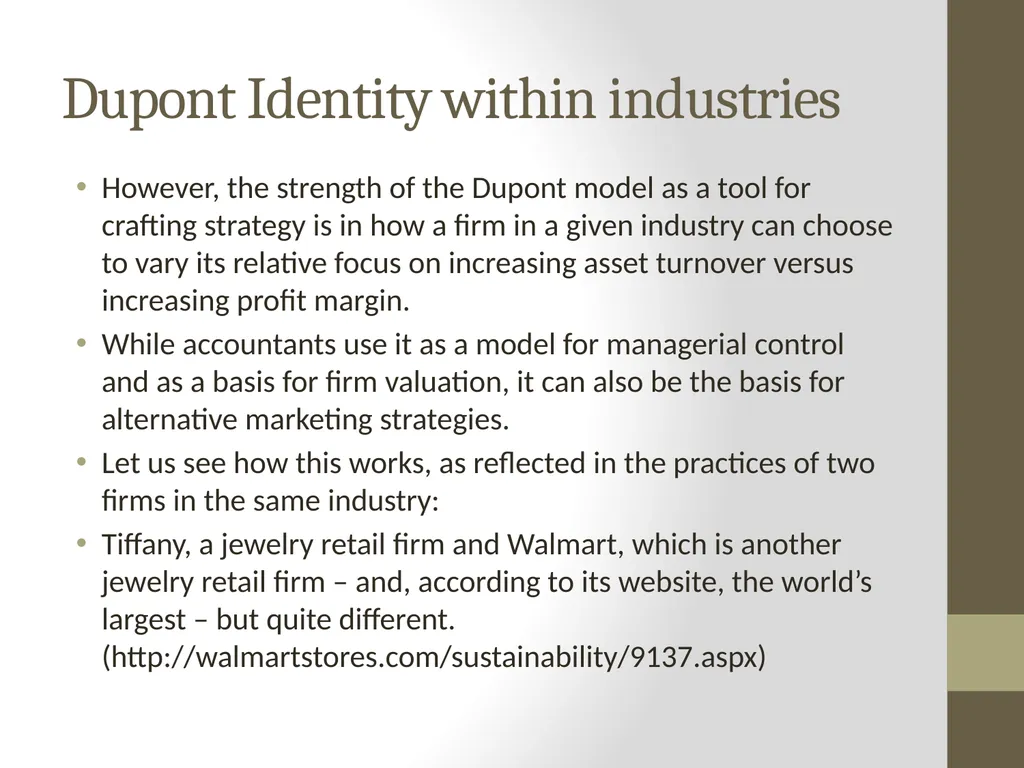
Dupont Identity within industries However, the strength of the Dupont model as a tool for crafting strategy is in how a firm in a given industry can choose to vary its relative focus on increasing asset turnover versus increasing profit margin.
While accountants use it as a model for managerial control and as a basis for firm valuation, it can also be the basis for alternative marketing strategies.
Let us see how this works, as reflected in the practices of two firms in the same industry:
Tiffany, a jewelry retail firm and Walmart, which is another jewelry retail firm – and, according to its website, the world’s largest – but quite different. (http://walmartstores.com/sustainability/9137.aspx)<br>
While accountants use it as a model for managerial control and as a basis for firm valuation, it can also be the basis for alternative marketing strategies.
Let us see how this works, as reflected in the practices of two firms in the same industry:
Tiffany, a jewelry retail firm and Walmart, which is another jewelry retail firm – and, according to its website, the world’s largest – but quite different. (http://walmartstores.com/sustainability/9137.aspx)<br>
11
* Effective tax rates often differ among corporations due to different tax breaks and advantages. Source: Wal-Mart Stores Inc (WMT) Annual Report (10K) 2013
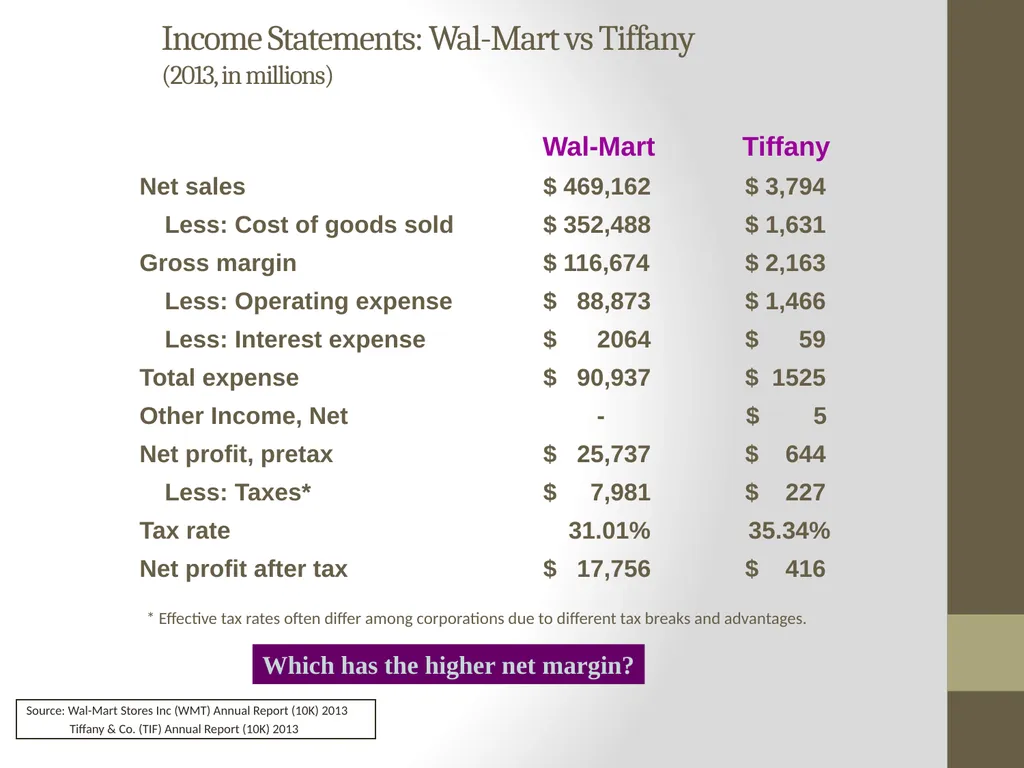
Tiffany & Co. (TIF) Annual Report (10K) 2013 Income Statements: Wal-Mart vs Tiffany (2013, in millions) Which has the higher net margin? Wal-Mart Tiffany
Net sales $ 469,162 $ 3,794
Less: Cost of goods sold $ 352,488 $ 1,631
Gross margin $ 116,674 $ 2,163
Less: Operating expense $ 88,873 $ 1,466
Less: Interest expense $ 2064 $ 59
Total expense $ 90,937 $ 1525
Other Income, Net - $ 5
Net profit, pretax $ 25,737 $ 644
Less: Taxes* $ 7,981 $ 227
Tax rate 31.01% 35.34%
Net profit after tax $ 17,756 $ 416<br>
Tiffany & Co. (TIF) Annual Report (10K) 2013 Income Statements: Wal-Mart vs Tiffany (2013, in millions) Which has the higher net margin? Wal-Mart Tiffany
Net sales $ 469,162 $ 3,794
Less: Cost of goods sold $ 352,488 $ 1,631
Gross margin $ 116,674 $ 2,163
Less: Operating expense $ 88,873 $ 1,466
Less: Interest expense $ 2064 $ 59
Total expense $ 90,937 $ 1525
Other Income, Net - $ 5
Net profit, pretax $ 25,737 $ 644
Less: Taxes* $ 7,981 $ 227
Tax rate 31.01% 35.34%
Net profit after tax $ 17,756 $ 416<br>
12
Net Sales
$469,162
$3,794 Cost of goods sold
$352,488
$1,631 Operating
expenses
$88,873
$1,466 Interest expenses
$2,064
$59 Gross
margin
$116,674 (24.9%)
$2,163 (57%) Total expenses
$90,937
$1,525 Net profit
before tax
$25,737
$638+5 Taxes
$7,981
$227 Net profit
after taxes
$17,756
$417 Net sales
$469,162
$3,794 Net profit margin
3.78%
10.96% - - - + Top Number = Wal-Mart
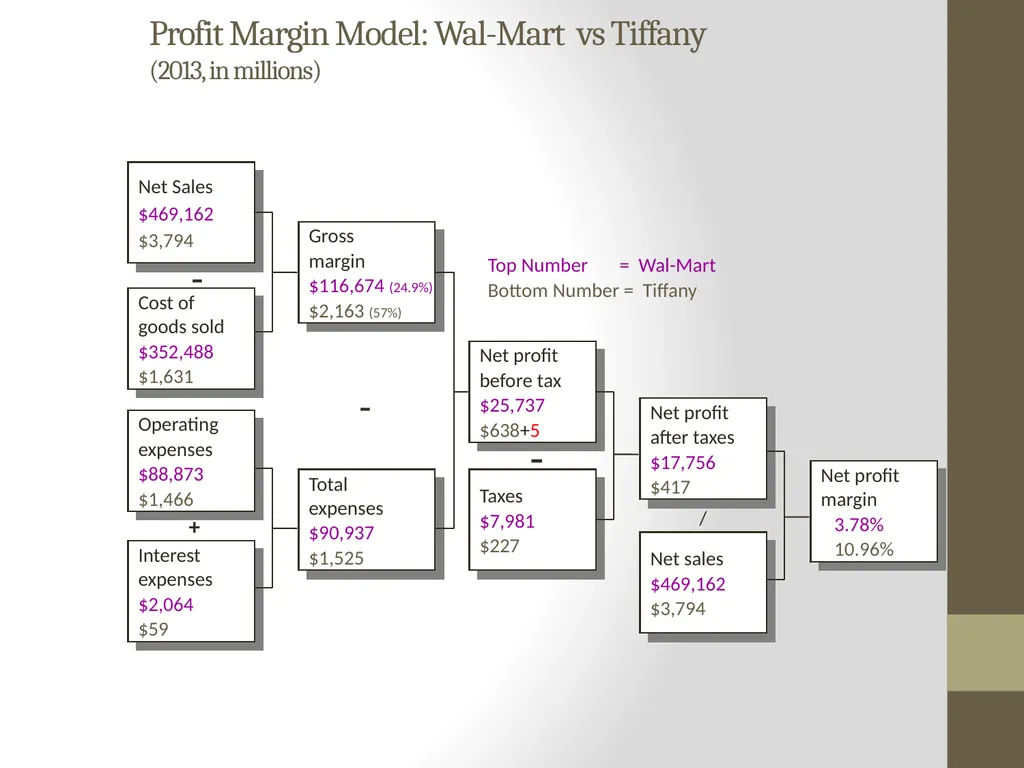
Bottom Number = Tiffany Profit Margin Model: Wal-Mart vs Tiffany (2013, in millions) /<br>
$469,162
$3,794 Cost of goods sold
$352,488
$1,631 Operating
expenses
$88,873
$1,466 Interest expenses
$2,064
$59 Gross
margin
$116,674 (24.9%)
$2,163 (57%) Total expenses
$90,937
$1,525 Net profit
before tax
$25,737
$638+5 Taxes
$7,981
$227 Net profit
after taxes
$17,756
$417 Net sales
$469,162
$3,794 Net profit margin
3.78%
10.96% - - - + Top Number = Wal-Mart
Bottom Number = Tiffany Profit Margin Model: Wal-Mart vs Tiffany (2013, in millions) /<br>
13
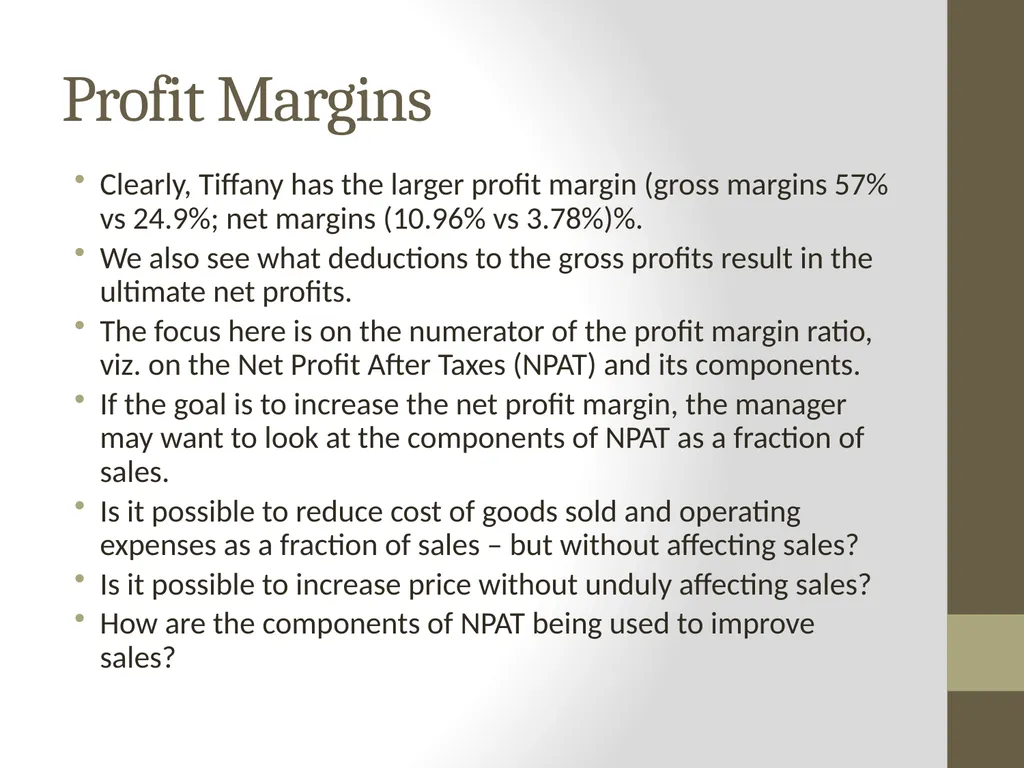
Profit Margins Clearly, Tiffany has the larger profit margin (gross margins 57% vs 24.9%; net margins (10.96% vs 3.78%)%.
We also see what deductions to the gross profits result in the ultimate net profits.
The focus here is on the numerator of the profit margin ratio, viz. on the Net Profit After Taxes (NPAT) and its components.
If the goal is to increase the net profit margin, the manager may want to look at the components of NPAT as a fraction of sales.
Is it possible to reduce cost of goods sold and operating expenses as a fraction of sales – but without affecting sales?
Is it possible to increase price without unduly affecting sales?
How are the components of NPAT being used to improve sales?<br>
We also see what deductions to the gross profits result in the ultimate net profits.
The focus here is on the numerator of the profit margin ratio, viz. on the Net Profit After Taxes (NPAT) and its components.
If the goal is to increase the net profit margin, the manager may want to look at the components of NPAT as a fraction of sales.
Is it possible to reduce cost of goods sold and operating expenses as a fraction of sales – but without affecting sales?
Is it possible to increase price without unduly affecting sales?
How are the components of NPAT being used to improve sales?<br>
14
Accounts
receivable
$6,768
$174 Merchandise inventory
$43,803
$2,234 Cash
$7,781
$504 Other current assets
$1,588
$238 Total current assets
$59,940
$3,152 Fixed assets
$143,165
$1,479 Net sales
$466,114
$3,794 Total assets
$203,105
$4,631 Asset turnover
2.29
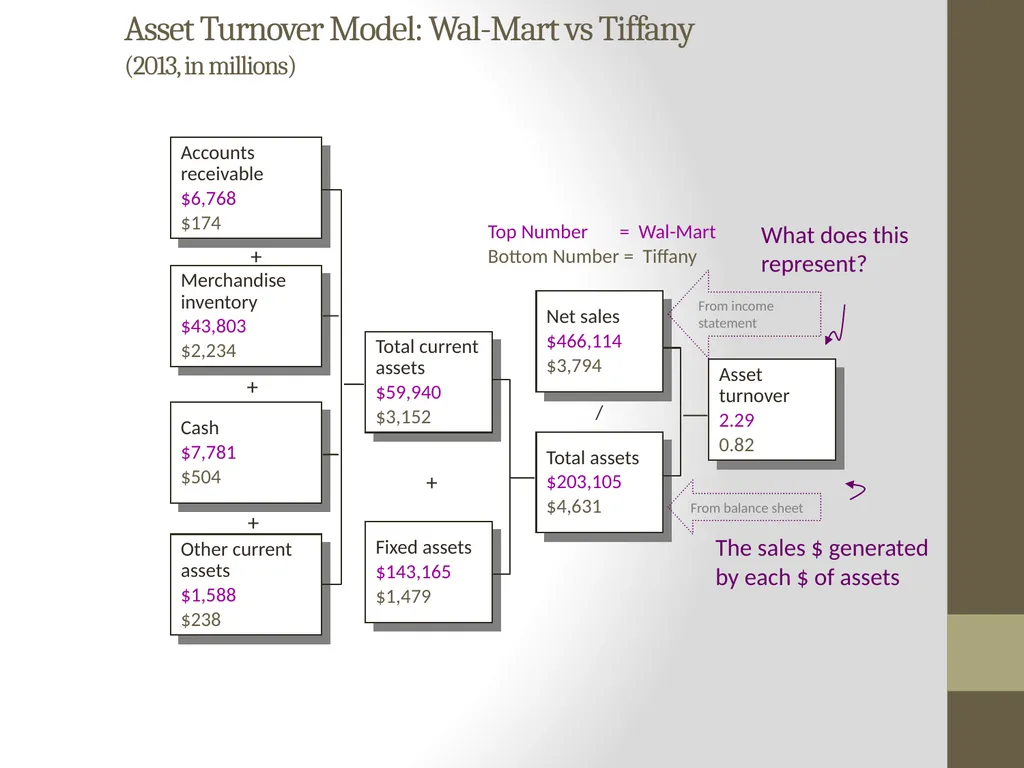
0.82 + + + + Asset Turnover Model: Wal-Mart vs Tiffany (2013, in millions) Top Number = Wal-Mart
Bottom Number = Tiffany From income statement From balance sheet / What does this represent?<br>
$6,768
$174 Merchandise inventory
$43,803
$2,234 Cash
$7,781
$504 Other current assets
$1,588
$238 Total current assets
$59,940
$3,152 Fixed assets
$143,165
$1,479 Net sales
$466,114
$3,794 Total assets
$203,105
$4,631 Asset turnover
2.29
0.82 + + + + Asset Turnover Model: Wal-Mart vs Tiffany (2013, in millions) Top Number = Wal-Mart
Bottom Number = Tiffany From income statement From balance sheet / What does this represent?<br>
15
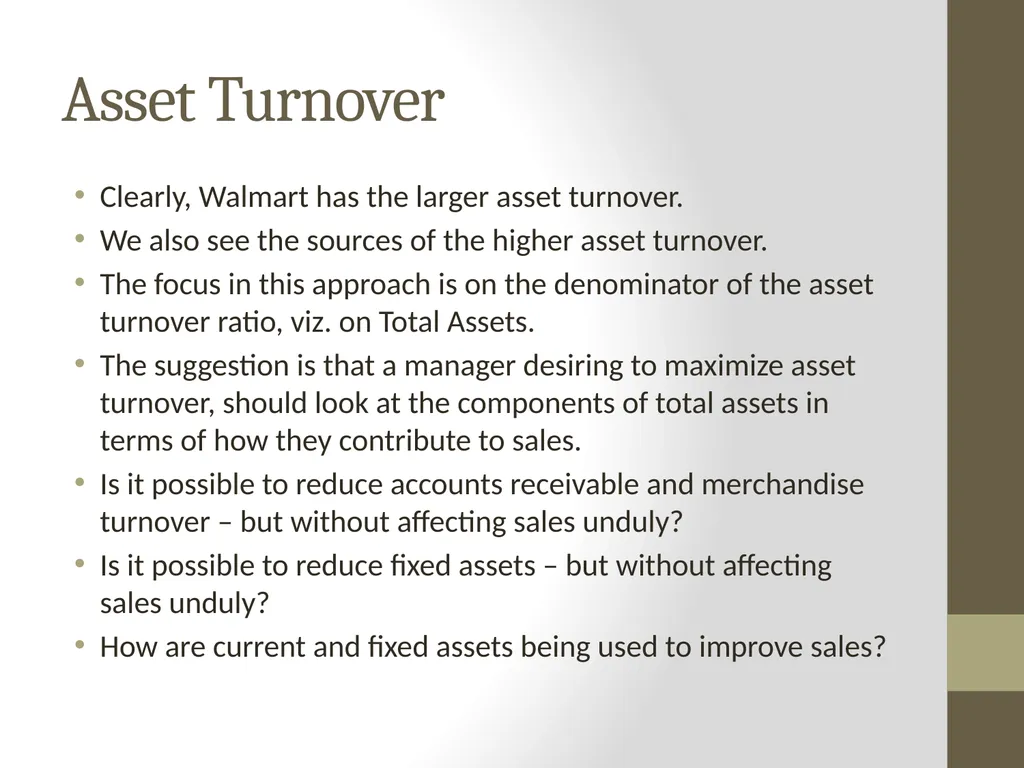
Asset Turnover Clearly, Walmart has the larger asset turnover.
We also see the sources of the higher asset turnover.
The focus in this approach is on the denominator of the asset turnover ratio, viz. on Total Assets.
The suggestion is that a manager desiring to maximize asset turnover, should look at the components of total assets in terms of how they contribute to sales.
Is it possible to reduce accounts receivable and merchandise turnover – but without affecting sales unduly?
Is it possible to reduce fixed assets – but without affecting sales unduly?
How are current and fixed assets being used to improve sales?<br>
We also see the sources of the higher asset turnover.
The focus in this approach is on the denominator of the asset turnover ratio, viz. on Total Assets.
The suggestion is that a manager desiring to maximize asset turnover, should look at the components of total assets in terms of how they contribute to sales.
Is it possible to reduce accounts receivable and merchandise turnover – but without affecting sales unduly?
Is it possible to reduce fixed assets – but without affecting sales unduly?
How are current and fixed assets being used to improve sales?<br>
16
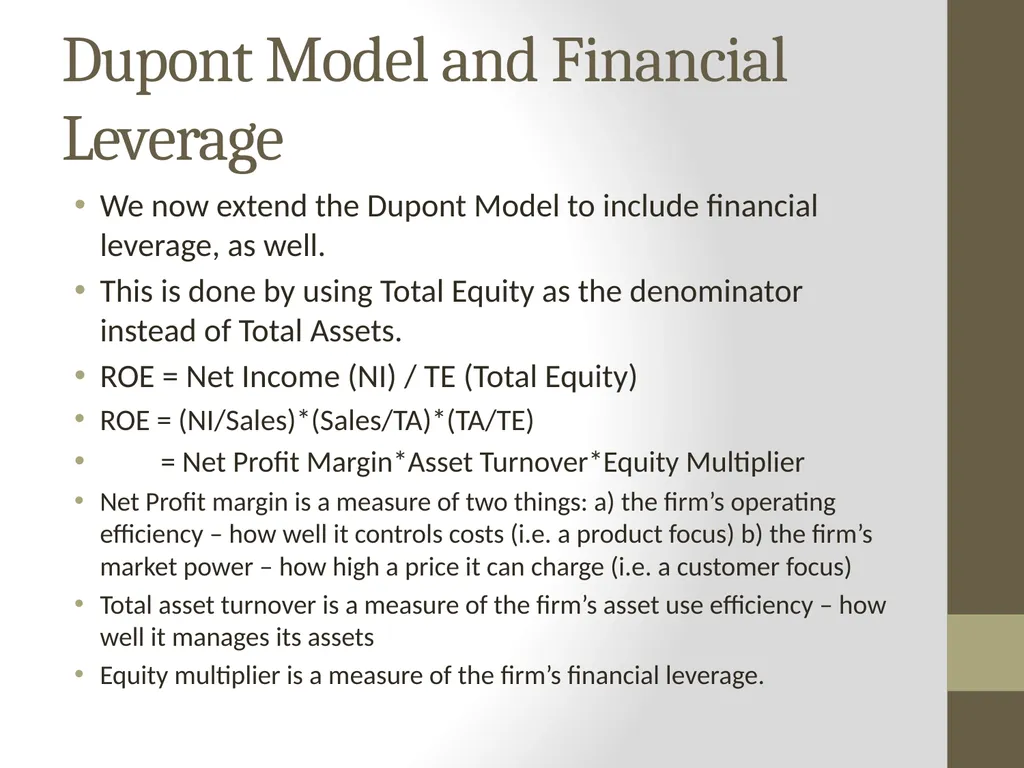
Dupont Model and Financial Leverage We now extend the Dupont Model to include financial leverage, as well.
This is done by using Total Equity as the denominator instead of Total Assets.
ROE = Net Income (NI) / TE (Total Equity)
ROE = (NI/Sales)*(Sales/TA)*(TA/TE)
= Net Profit Margin*Asset Turnover*Equity Multiplier
Net Profit margin is a measure of two things: a) the firm’s operating efficiency – how well it controls costs (i.e. a product focus) b) the firm’s market power – how high a price it can charge (i.e. a customer focus)
Total asset turnover is a measure of the firm’s asset use efficiency – how well it manages its assets
Equity multiplier is a measure of the firm’s financial leverage.<br>
This is done by using Total Equity as the denominator instead of Total Assets.
ROE = Net Income (NI) / TE (Total Equity)
ROE = (NI/Sales)*(Sales/TA)*(TA/TE)
= Net Profit Margin*Asset Turnover*Equity Multiplier
Net Profit margin is a measure of two things: a) the firm’s operating efficiency – how well it controls costs (i.e. a product focus) b) the firm’s market power – how high a price it can charge (i.e. a customer focus)
Total asset turnover is a measure of the firm’s asset use efficiency – how well it manages its assets
Equity multiplier is a measure of the firm’s financial leverage.<br>
17
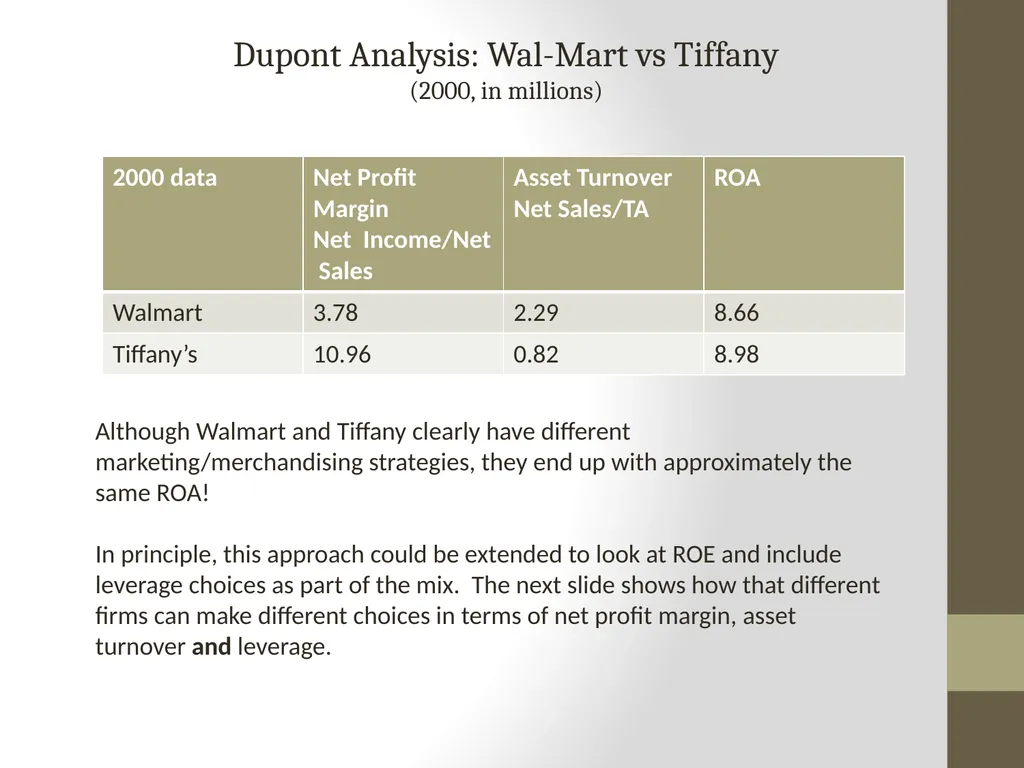
Dupont Analysis: Wal-Mart vs Tiffany
(2000, in millions) Although Walmart and Tiffany clearly have different marketing/merchandising strategies, they end up with approximately the same ROA!
In principle, this approach could be extended to look at ROE and include leverage choices as part of the mix. The next slide shows how that different firms can make different choices in terms of net profit margin, asset turnover and leverage.<br>
In principle, this approach could be extended to look at ROE and include leverage choices as part of the mix. The next slide shows how that different firms can make different choices in terms of net profit margin, asset turnover and leverage.<br>
18
Financial Objectives:
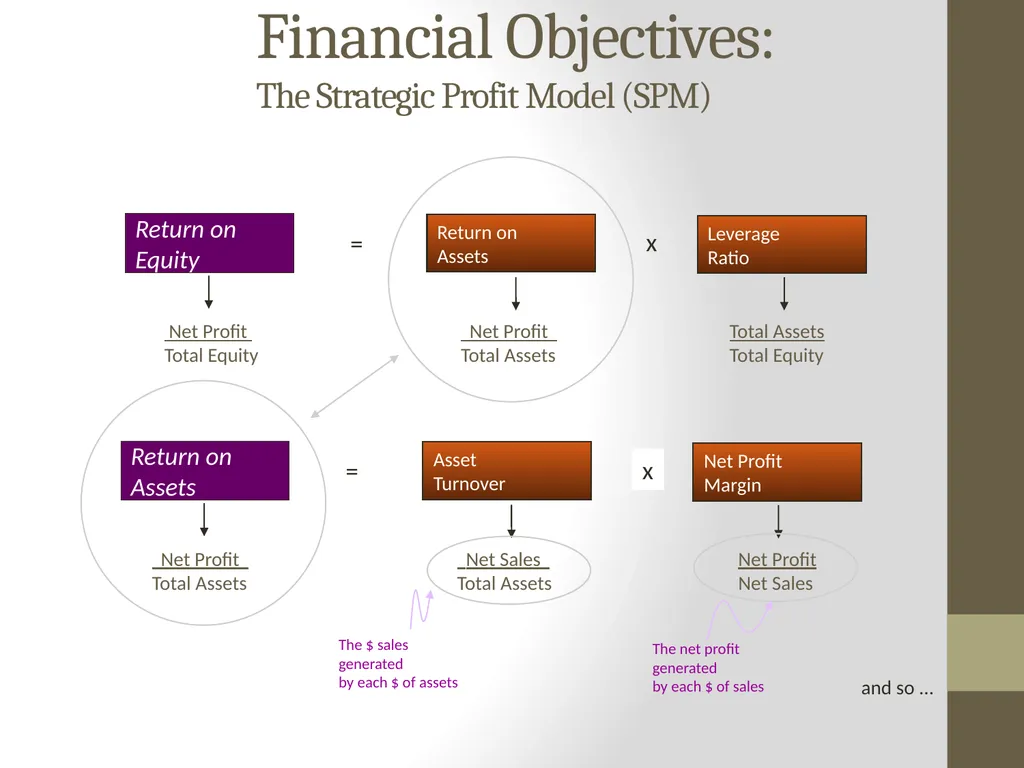
The Strategic Profit Model (SPM) Return on
Equity Leverage
Ratio Return on
Assets = x Net Profit
Total Equity Net Profit
Total Assets Total Assets
Total Equity Return on
Assets = Net Profit
Total Assets and so ...<br>
Equity Leverage
Ratio Return on
Assets = x Net Profit
Total Equity Net Profit
Total Assets Total Assets
Total Equity Return on
Assets = Net Profit
Total Assets and so ...<br>
19
Big Lots:
24.6% 13.1 1.5 1.2
Albertson’s: 18.9% 2.1 4.2 2.1
The Dress Barn: 32.4% 7.4 2.9 1.5
Land’s End: 40.2% 6.8 3.1 1.9
The Limited: 32.3% 6.7 2.2 2.2
The Gap: 25.5% 6.6 2.4 1.6 Strategic Profit Model Examples Return on Equity
Investment = x Asset
Turnover Leverage
Ratio Net Profit
Margin % x 1998 data From the Garment Industry<br>
Albertson’s: 18.9% 2.1 4.2 2.1
The Dress Barn: 32.4% 7.4 2.9 1.5
Land’s End: 40.2% 6.8 3.1 1.9
The Limited: 32.3% 6.7 2.2 2.2
The Gap: 25.5% 6.6 2.4 1.6 Strategic Profit Model Examples Return on Equity
Investment = x Asset
Turnover Leverage
Ratio Net Profit
Margin % x 1998 data From the Garment Industry<br>
20
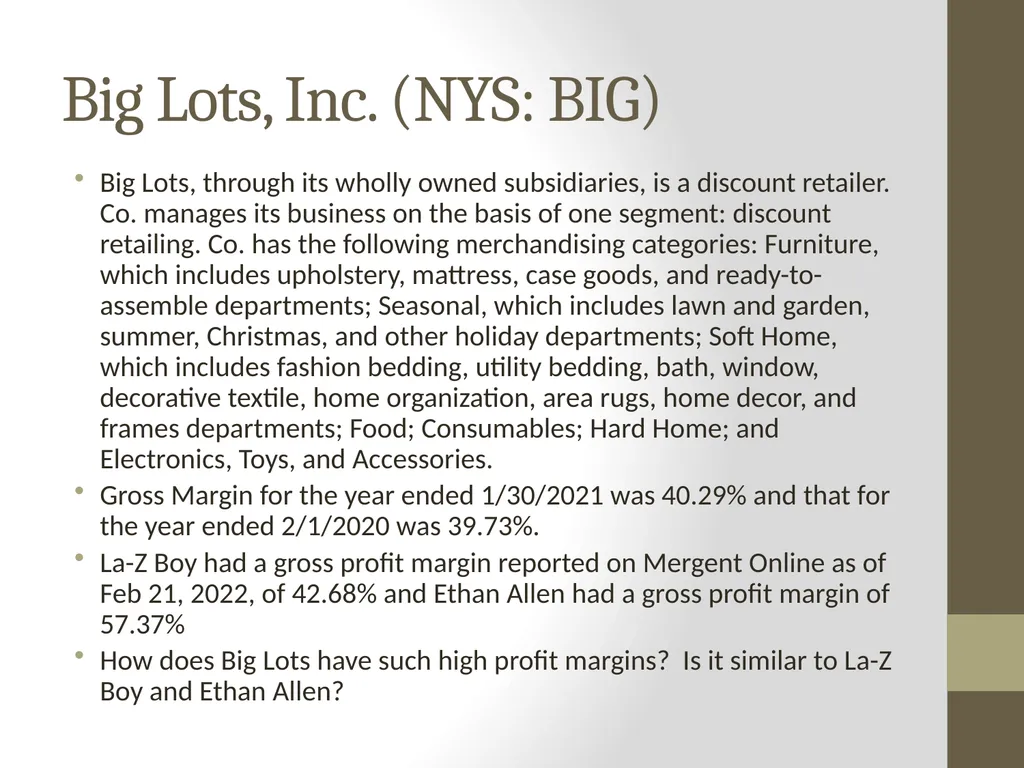
Big Lots, Inc. (NYS: BIG) Big Lots, through its wholly owned subsidiaries, is a discount retailer. Co. manages its business on the basis of one segment: discount retailing. Co. has the following merchandising categories: Furniture, which includes upholstery, mattress, case goods, and ready-to-assemble departments; Seasonal, which includes lawn and garden, summer, Christmas, and other holiday departments; Soft Home, which includes fashion bedding, utility bedding, bath, window, decorative textile, home organization, area rugs, home decor, and frames departments; Food; Consumables; Hard Home; and Electronics, Toys, and Accessories.
Gross Margin for the year ended 1/30/2021 was 40.29% and that for the year ended 2/1/2020 was 39.73%.
La-Z Boy had a gross profit margin reported on Mergent Online as of Feb 21, 2022, of 42.68% and Ethan Allen had a gross profit margin of 57.37%
How does Big Lots have such high profit margins? Is it similar to La-Z Boy and Ethan Allen?<br>
Gross Margin for the year ended 1/30/2021 was 40.29% and that for the year ended 2/1/2020 was 39.73%.
La-Z Boy had a gross profit margin reported on Mergent Online as of Feb 21, 2022, of 42.68% and Ethan Allen had a gross profit margin of 57.37%
How does Big Lots have such high profit margins? Is it similar to La-Z Boy and Ethan Allen?<br>
21
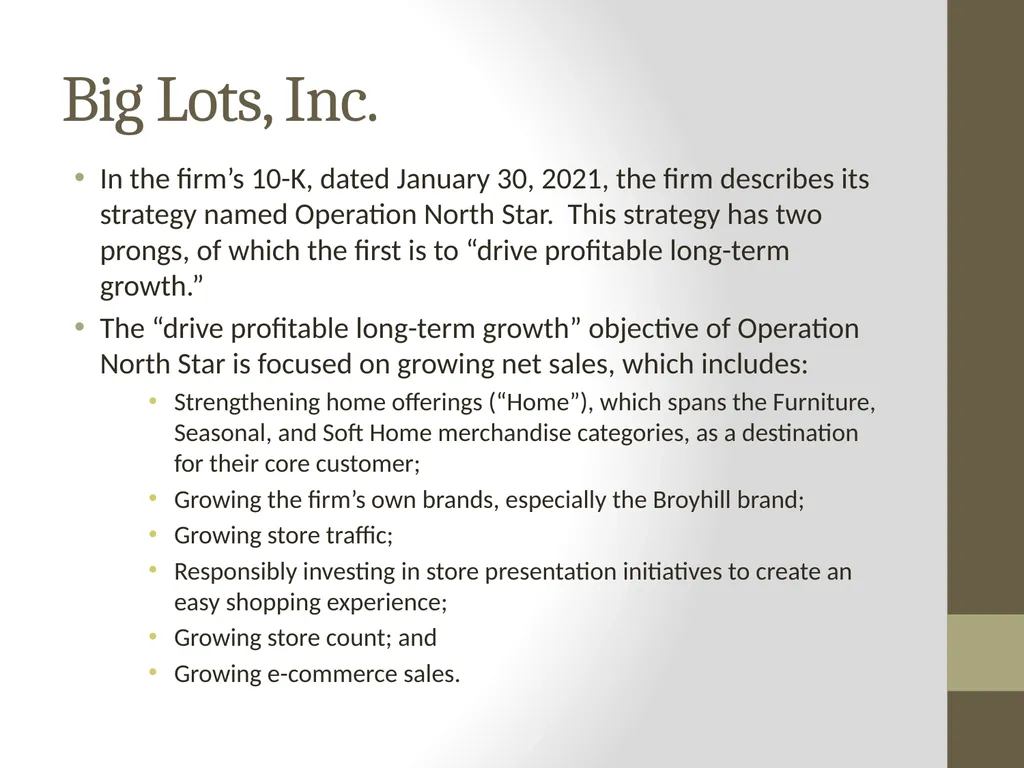
Big Lots, Inc. In the firm’s 10-K, dated January 30, 2021, the firm describes its strategy named Operation North Star. This strategy has two prongs, of which the first is to “drive profitable long-term growth.”
The “drive profitable long-term growth” objective of Operation North Star is focused on growing net sales, which includes:
Strengthening home offerings (“Home”), which spans the Furniture, Seasonal, and Soft Home merchandise categories, as a destination for their core customer;
Growing the firm’s own brands, especially the Broyhill brand;
Growing store traffic;
Responsibly investing in store presentation initiatives to create an easy shopping experience;
Growing store count; and
Growing e-commerce sales.<br>
The “drive profitable long-term growth” objective of Operation North Star is focused on growing net sales, which includes:
Strengthening home offerings (“Home”), which spans the Furniture, Seasonal, and Soft Home merchandise categories, as a destination for their core customer;
Growing the firm’s own brands, especially the Broyhill brand;
Growing store traffic;
Responsibly investing in store presentation initiatives to create an easy shopping experience;
Growing store count; and
Growing e-commerce sales.<br>
22
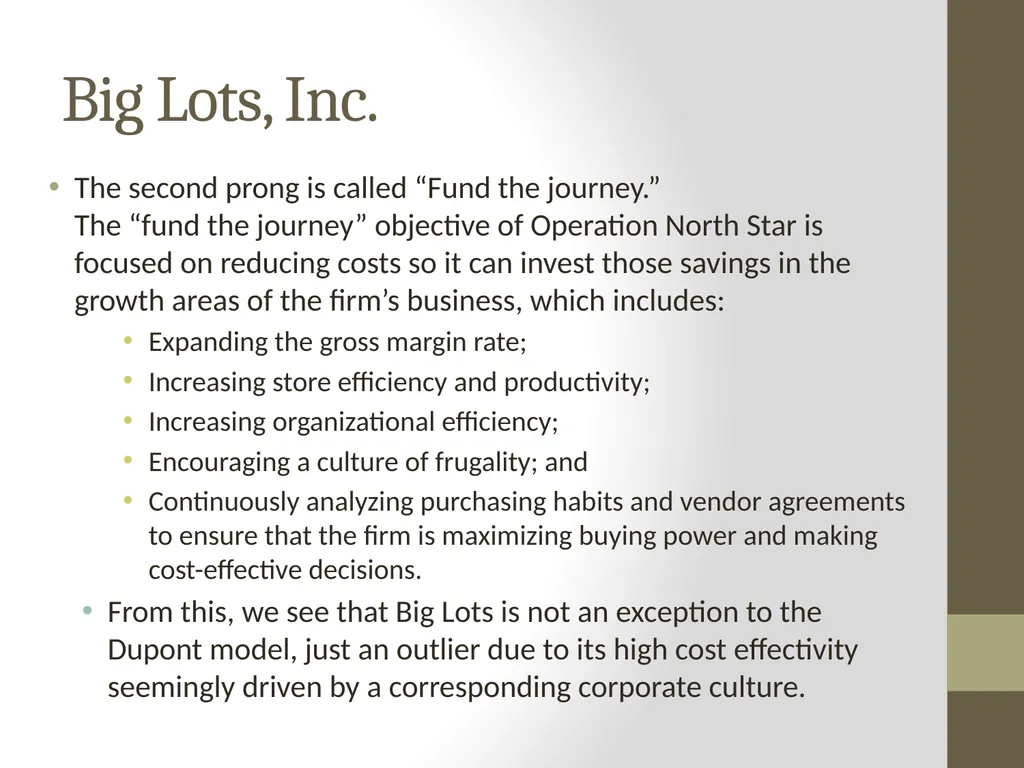
Big Lots, Inc. The second prong is called “Fund the journey.”
The “fund the journey” objective of Operation North Star is focused on reducing costs so it can invest those savings in the growth areas of the firm’s business, which includes:
Expanding the gross margin rate;
Increasing store efficiency and productivity;
Increasing organizational efficiency;
Encouraging a culture of frugality; and
Continuously analyzing purchasing habits and vendor agreements to ensure that the firm is maximizing buying power and making cost-effective decisions.
From this, we see that Big Lots is not an exception to the Dupont model, just an outlier due to its high cost effectivity seemingly driven by a corresponding corporate culture.<br>
Expanding the gross margin rate;
Increasing store efficiency and productivity;
Increasing organizational efficiency;
Encouraging a culture of frugality; and
Continuously analyzing purchasing habits and vendor agreements to ensure that the firm is maximizing buying power and making cost-effective decisions.
From this, we see that Big Lots is not an exception to the Dupont model, just an outlier due to its high cost effectivity seemingly driven by a corresponding corporate culture.<br>
23
Target:
25.5% 3.9 1.8 3.65
Nike: 19.5% 5.3 1.6 2.3
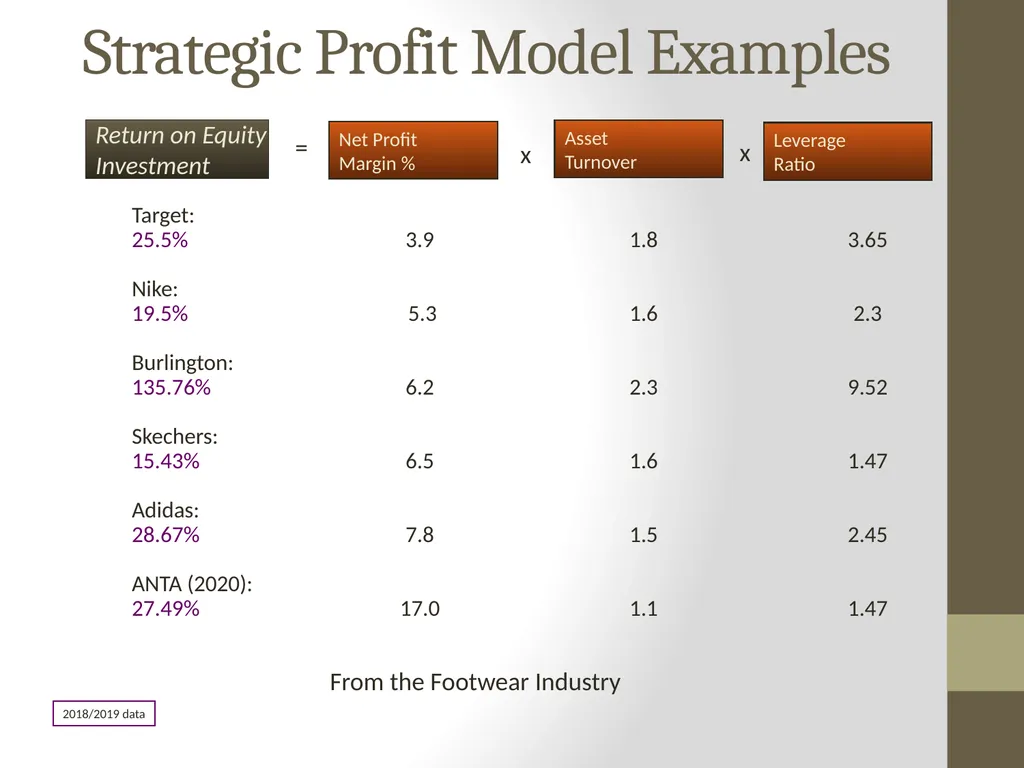
Burlington: 135.76% 6.2 2.3 9.52
Skechers: 15.43% 6.5 1.6 1.47
Adidas: 28.67% 7.8 1.5 2.45
ANTA (2020): 27.49% 17.0 1.1 1.47 Strategic Profit Model Examples Return on Equity
Investment = x Asset
Turnover Leverage
Ratio Net Profit
Margin % x 2018/2019 data From the Footwear Industry<br>
Nike: 19.5% 5.3 1.6 2.3
Burlington: 135.76% 6.2 2.3 9.52
Skechers: 15.43% 6.5 1.6 1.47
Adidas: 28.67% 7.8 1.5 2.45
ANTA (2020): 27.49% 17.0 1.1 1.47 Strategic Profit Model Examples Return on Equity
Investment = x Asset
Turnover Leverage
Ratio Net Profit
Margin % x 2018/2019 data From the Footwear Industry<br>
24
ROI Model, Including
The Strategic Profit Model Net Sales Cost of
goods sold Variable
expenses Fixed
expenses Gross
margin Total
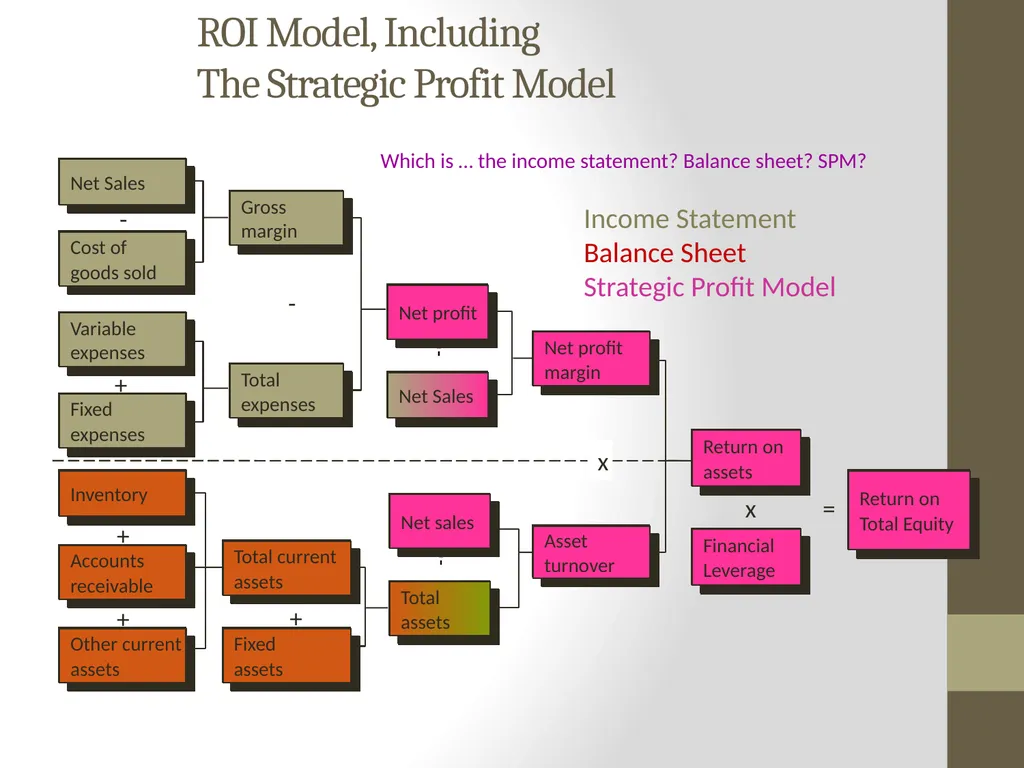
expenses Net profit Net Sales Net profit
margin Asset
turnover Return on
assets - - + Inventory Accounts
receivable Other current
assets Total current
assets Fixed
assets Net sales Total
assets + + + x Financial
Leverage x Return on
Net Worth = Which is … the income statement? Balance sheet? SPM?<br>
goods sold Variable
expenses Fixed
expenses Gross
margin Total
expenses Net profit Net Sales Net profit
margin Asset
turnover Return on
assets - - + Inventory Accounts
receivable Other current
assets Total current
assets Fixed
assets Net sales Total
assets + + + x Financial
Leverage x Return on
Net Worth = Which is … the income statement? Balance sheet? SPM?<br>
25
Retail Strategies As we just saw, the two arms of the Dupont ROA identity could be thought of as reflecting alternatives focusing on the income statement (profit margin) versus on the balance sheet (volume).
However, both approaches really reflect different uses of a company’s assets/capabilities.
The next two slides show how Walmart has worked on one aspect of its balance sheet, while the remaining slides look at how Tiffany’s marketing focus on profit margin is reflected in its asset choices.<br>
However, both approaches really reflect different uses of a company’s assets/capabilities.
The next two slides show how Walmart has worked on one aspect of its balance sheet, while the remaining slides look at how Tiffany’s marketing focus on profit margin is reflected in its asset choices.<br>
26
Walmart’s focus on efficient asset use Wal-Mart's strategy for catching up was a point-of-sale system, a computerized system that identifies each item sold, finds its price in a computerized database, creates an accurate sales receipt for the customer, and stores this item-by-item sales information for use in analyzing sales and reordering inventory. Aside from handling information efficiently, effective use of this information helps Wal-Mart avoid overstocking by learning what merchandise is selling slowly. (WIT, 2013)
Wal-Mart use telecommunications to link directly from its stores to its central computer system and from that system to its supplier's computers. Knowing exactly what is selling well and coordinating closely with suppliers permits Wal-Mart to tie up less money in inventory than many of their competitors. (WIT, 2013)
Aside from computers and telecommunications equipment, the technical basis of the point-of-sale system is the bar code scanner. Bar code scanners make it possible to record the sale of each item and make that information available immediately for both reordering and sales analysis. (WIT, 2013)<br>
Wal-Mart use telecommunications to link directly from its stores to its central computer system and from that system to its supplier's computers. Knowing exactly what is selling well and coordinating closely with suppliers permits Wal-Mart to tie up less money in inventory than many of their competitors. (WIT, 2013)
Aside from computers and telecommunications equipment, the technical basis of the point-of-sale system is the bar code scanner. Bar code scanners make it possible to record the sale of each item and make that information available immediately for both reordering and sales analysis. (WIT, 2013)<br>
27
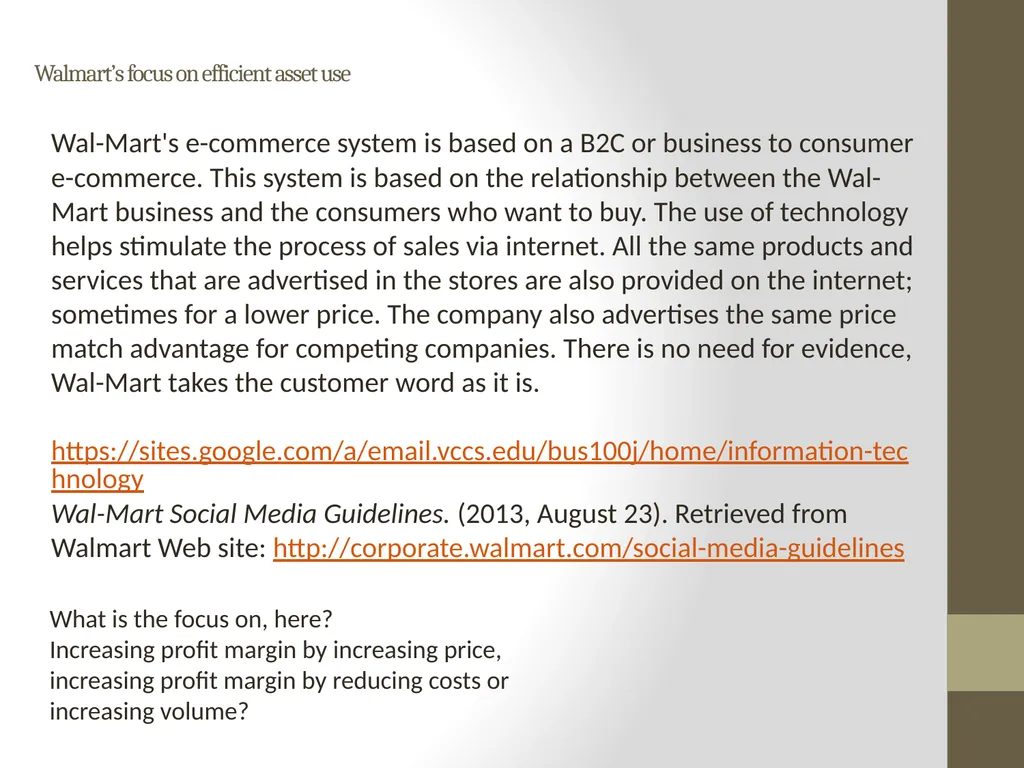
Walmart’s focus on efficient asset use Wal-Mart's e-commerce system is based on a B2C or business to consumer e-commerce. This system is based on the relationship between the Wal-Mart business and the consumers who want to buy. The use of technology helps stimulate the process of sales via internet. All the same products and services that are advertised in the stores are also provided on the internet; sometimes for a lower price. The company also advertises the same price match advantage for competing companies. There is no need for evidence, Wal-Mart takes the customer word as it is.
https://sites.google.com/a/email.vccs.edu/bus100j/home/information-technology
Wal-Mart Social Media Guidelines. (2013, August 23). Retrieved from Walmart Web site: http://corporate.walmart.com/social-media-guidelines What is the focus on, here?
Increasing profit margin by increasing price, increasing profit margin by reducing costs or increasing volume?<br>
https://sites.google.com/a/email.vccs.edu/bus100j/home/information-technology
Wal-Mart Social Media Guidelines. (2013, August 23). Retrieved from Walmart Web site: http://corporate.walmart.com/social-media-guidelines What is the focus on, here?
Increasing profit margin by increasing price, increasing profit margin by reducing costs or increasing volume?<br>
28
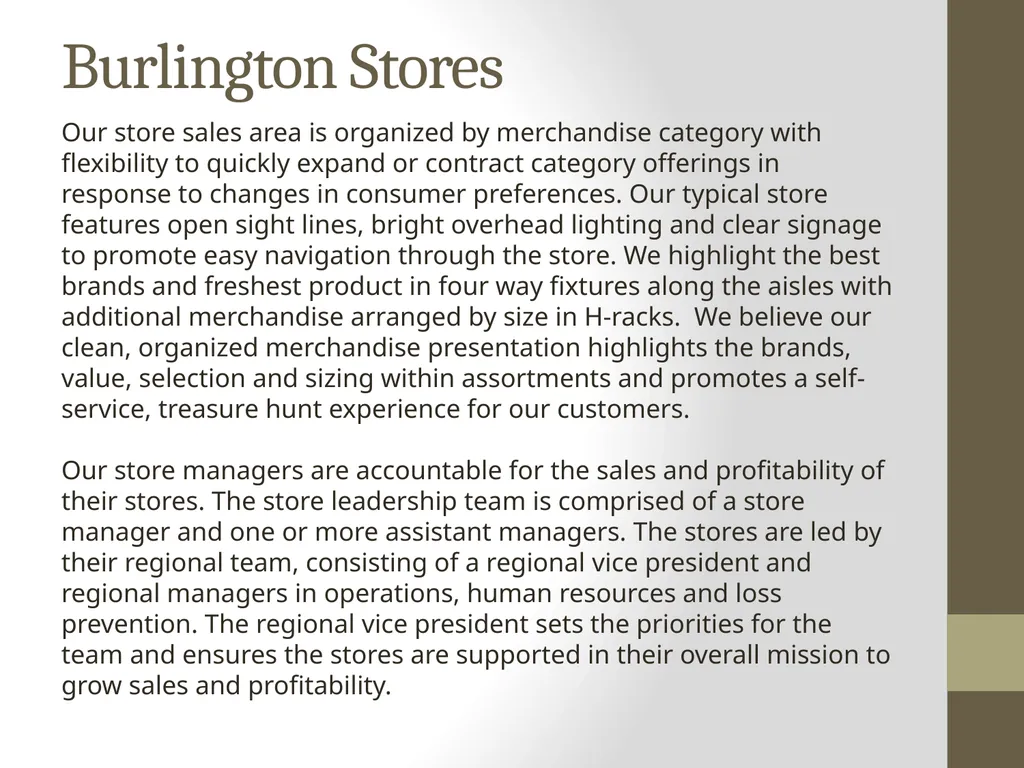
Burlington Stores Our store sales area is organized by merchandise category with flexibility to quickly expand or contract category offerings in response to changes in consumer preferences. Our typical store features open sight lines, bright overhead lighting and clear signage to promote easy navigation through the store. We highlight the best brands and freshest product in four way fixtures along the aisles with additional merchandise arranged by size in H-racks. We believe our clean, organized merchandise presentation highlights the brands, value, selection and sizing within assortments and promotes a self- service, treasure hunt experience for our customers.
Our store managers are accountable for the sales and profitability of their stores. The store leadership team is comprised of a store manager and one or more assistant managers. The stores are led by their regional team, consisting of a regional vice president and regional managers in operations, human resources and loss prevention. The regional vice president sets the priorities for the team and ensures the stores are supported in their overall mission to grow sales and profitability.<br>
Our store managers are accountable for the sales and profitability of their stores. The store leadership team is comprised of a store manager and one or more assistant managers. The stores are led by their regional team, consisting of a regional vice president and regional managers in operations, human resources and loss prevention. The regional vice president sets the priorities for the team and ensures the stores are supported in their overall mission to grow sales and profitability.<br>
29
Burlington Stores Store Expansion and Real Estate Strategy
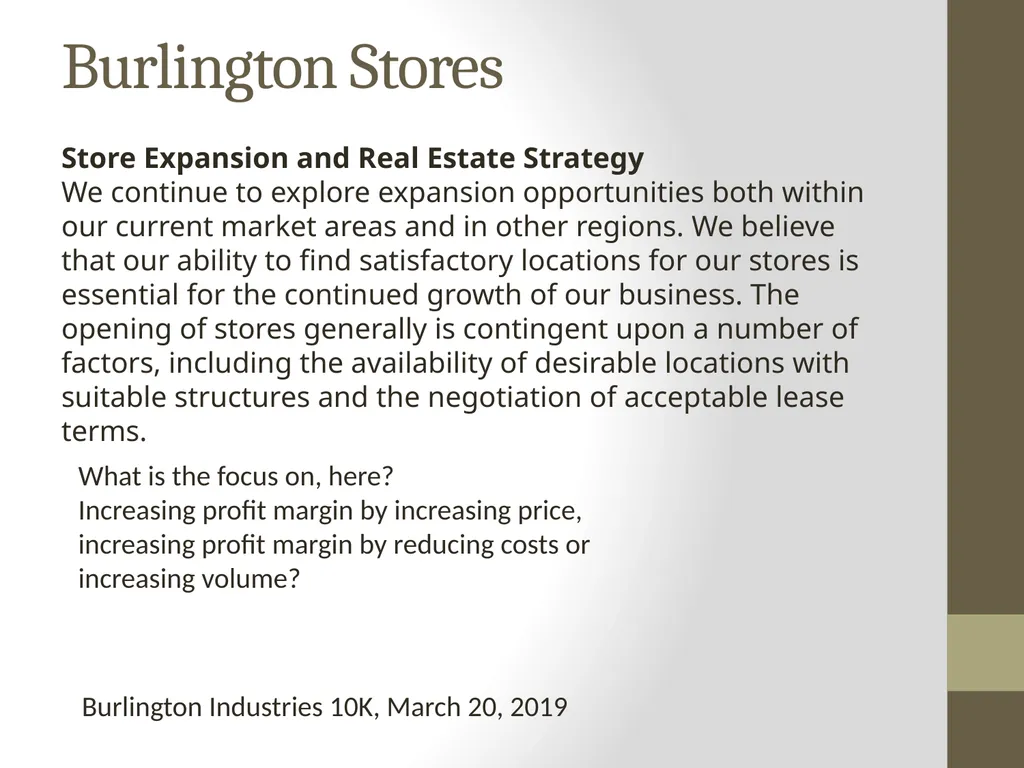
We continue to explore expansion opportunities both within our current market areas and in other regions. We believe that our ability to find satisfactory locations for our stores is essential for the continued growth of our business. The opening of stores generally is contingent upon a number of factors, including the availability of desirable locations with suitable structures and the negotiation of acceptable lease terms. Burlington Industries 10K, March 20, 2019 What is the focus on, here? Increasing profit margin by increasing price, increasing profit margin by reducing costs or increasing volume?<br>
We continue to explore expansion opportunities both within our current market areas and in other regions. We believe that our ability to find satisfactory locations for our stores is essential for the continued growth of our business. The opening of stores generally is contingent upon a number of factors, including the availability of desirable locations with suitable structures and the negotiation of acceptable lease terms. Burlington Industries 10K, March 20, 2019 What is the focus on, here? Increasing profit margin by increasing price, increasing profit margin by reducing costs or increasing volume?<br>
30
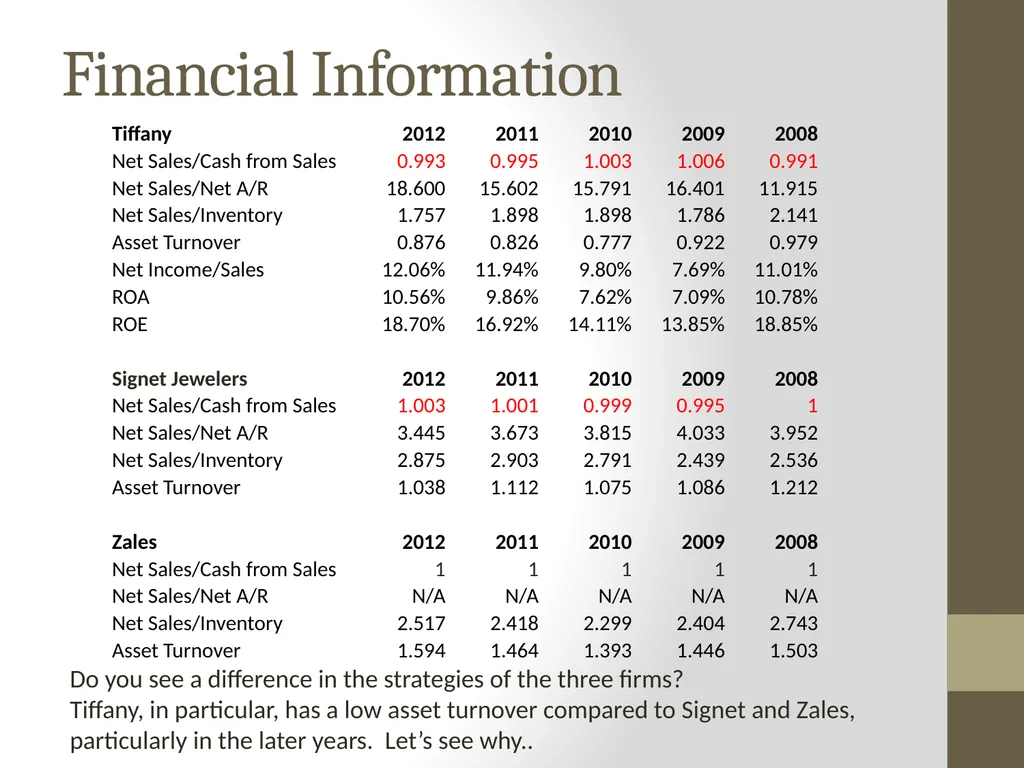
Financial Information Do you see a difference in the strategies of the three firms?
Tiffany, in particular, has a low asset turnover compared to Signet and Zales, particularly in the later years. Let’s see why..<br>
Tiffany, in particular, has a low asset turnover compared to Signet and Zales, particularly in the later years. Let’s see why..<br>
31
Bergdorf Goodman Stores https://www.youtube.com/watch?v=OOKEzERIyvE Look at this video of a Bergdorf Goodman store and a Saks Fifth Avenue store.
Note the focus on the customer, either explicit or implicit.<br>
Note the focus on the customer, either explicit or implicit.<br>
32
The Tiffany Approach In the following video, consider Tiffany’s use of its assets in the light of our previous discussion.
https://www.youtube.com/watch?v=VXsG8CGabWI
Let’s now look at how Tiffany’s management considers the issue in its 10K report.<br>
https://www.youtube.com/watch?v=VXsG8CGabWI
Let’s now look at how Tiffany’s management considers the issue in its 10K report.<br>
33
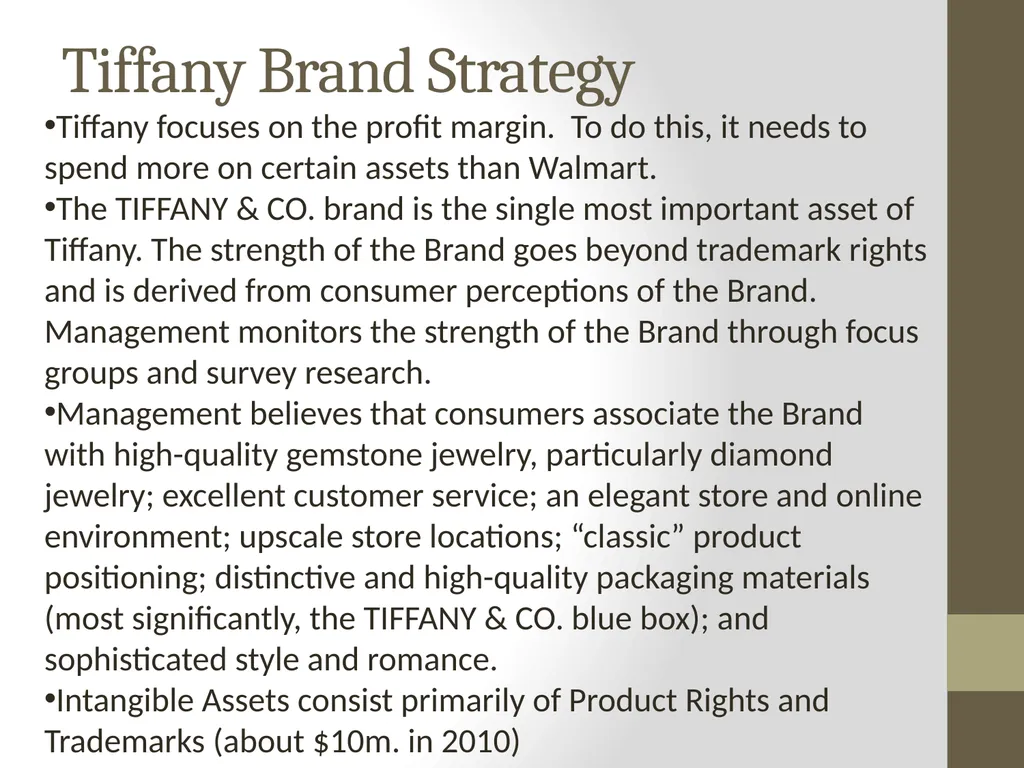
Tiffany Brand Strategy Tiffany focuses on the profit margin. To do this, it needs to spend more on certain assets than Walmart.
The TIFFANY & CO. brand is the single most important asset of Tiffany. The strength of the Brand goes beyond trademark rights and is derived from consumer perceptions of the Brand. Management monitors the strength of the Brand through focus groups and survey research.
Management believes that consumers associate the Brand with high-quality gemstone jewelry, particularly diamond jewelry; excellent customer service; an elegant store and online environment; upscale store locations; “classic” product positioning; distinctive and high-quality packaging materials (most significantly, the TIFFANY & CO. blue box); and sophisticated style and romance.
Intangible Assets consist primarily of Product Rights and Trademarks (about $10m. in 2010)<br>
The TIFFANY & CO. brand is the single most important asset of Tiffany. The strength of the Brand goes beyond trademark rights and is derived from consumer perceptions of the Brand. Management monitors the strength of the Brand through focus groups and survey research.
Management believes that consumers associate the Brand with high-quality gemstone jewelry, particularly diamond jewelry; excellent customer service; an elegant store and online environment; upscale store locations; “classic” product positioning; distinctive and high-quality packaging materials (most significantly, the TIFFANY & CO. blue box); and sophisticated style and romance.
Intangible Assets consist primarily of Product Rights and Trademarks (about $10m. in 2010)<br>
34
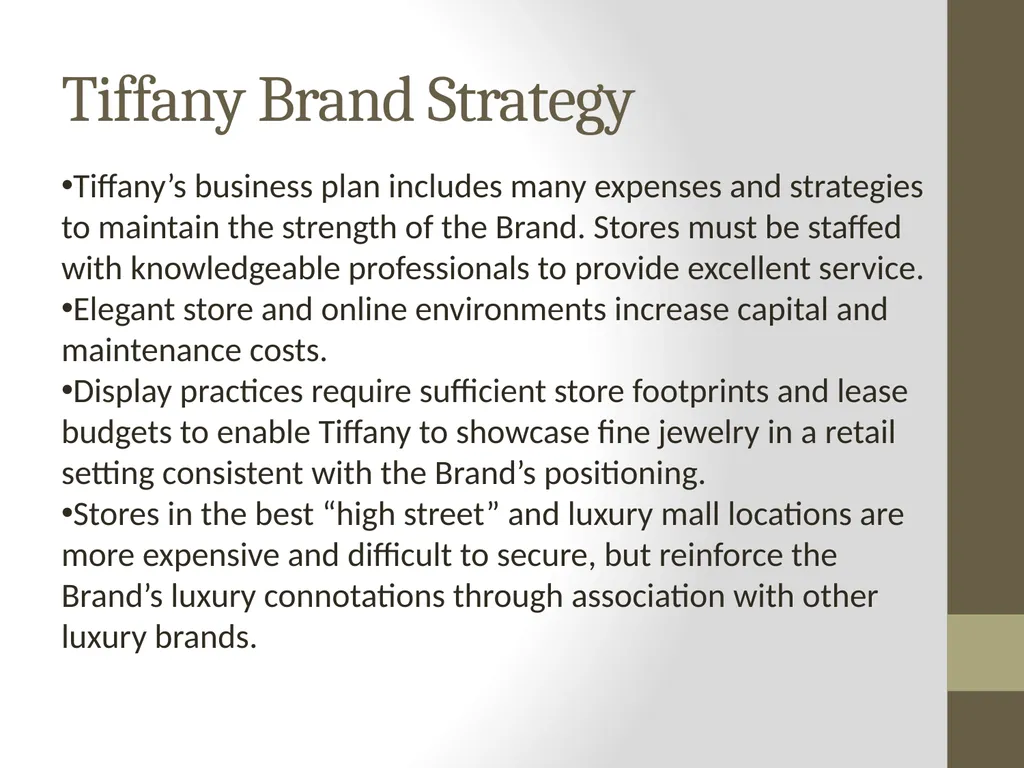
Tiffany Brand Strategy Tiffany’s business plan includes many expenses and strategies to maintain the strength of the Brand. Stores must be staffed with knowledgeable professionals to provide excellent service.
Elegant store and online environments increase capital and maintenance costs.
Display practices require sufficient store footprints and lease budgets to enable Tiffany to showcase fine jewelry in a retail setting consistent with the Brand’s positioning.
Stores in the best “high street” and luxury mall locations are more expensive and difficult to secure, but reinforce the Brand’s luxury connotations through association with other luxury brands.<br>
Elegant store and online environments increase capital and maintenance costs.
Display practices require sufficient store footprints and lease budgets to enable Tiffany to showcase fine jewelry in a retail setting consistent with the Brand’s positioning.
Stores in the best “high street” and luxury mall locations are more expensive and difficult to secure, but reinforce the Brand’s luxury connotations through association with other luxury brands.<br>
35
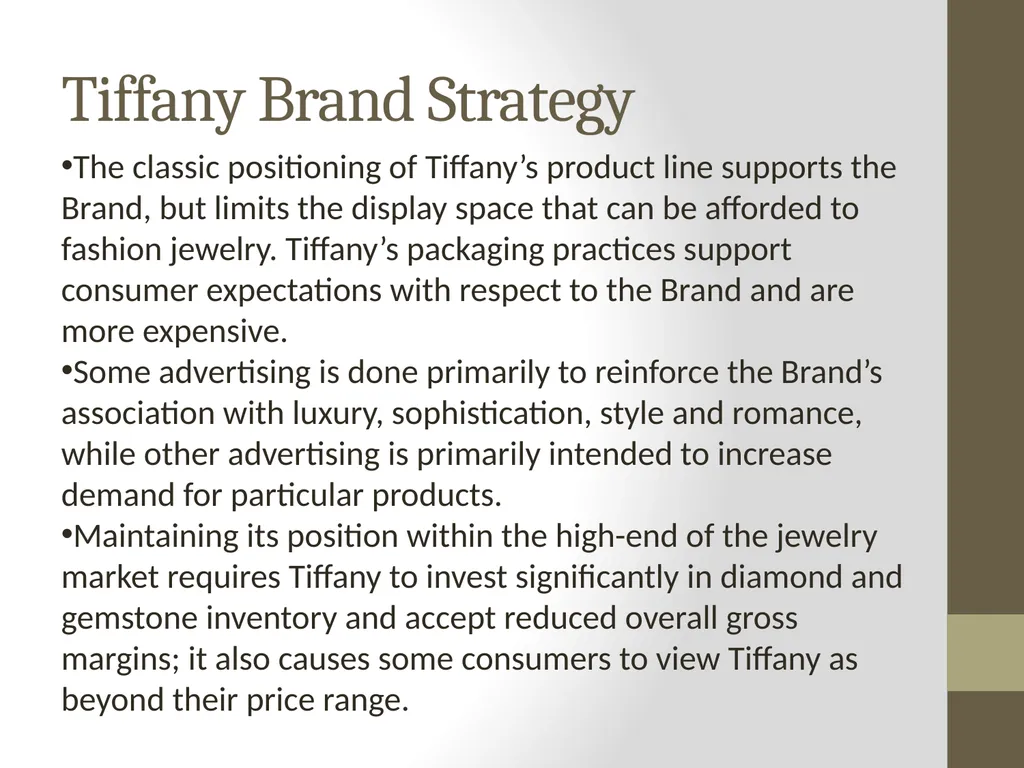
Tiffany Brand Strategy The classic positioning of Tiffany’s product line supports the Brand, but limits the display space that can be afforded to fashion jewelry. Tiffany’s packaging practices support consumer expectations with respect to the Brand and are more expensive.
Some advertising is done primarily to reinforce the Brand’s association with luxury, sophistication, style and romance, while other advertising is primarily intended to increase demand for particular products.
Maintaining its position within the high-end of the jewelry market requires Tiffany to invest significantly in diamond and gemstone inventory and accept reduced overall gross margins; it also causes some consumers to view Tiffany as beyond their price range.<br>
Some advertising is done primarily to reinforce the Brand’s association with luxury, sophistication, style and romance, while other advertising is primarily intended to increase demand for particular products.
Maintaining its position within the high-end of the jewelry market requires Tiffany to invest significantly in diamond and gemstone inventory and accept reduced overall gross margins; it also causes some consumers to view Tiffany as beyond their price range.<br>
36
The Walmart and Costco Stores In the following videos, look at Walmart and Costco’s asset use and consider our previous discussion. How does it differ from Tiffany?
Walmart Stores
http://www.youtube.com/watch?v=RJphoRD1w0I
http://projects.flowingdata.com/walmart/
Costco Store
https://www.youtube.com/watch?v=Z-j3u5xYgyc<br>
Walmart Stores
http://www.youtube.com/watch?v=RJphoRD1w0I
http://projects.flowingdata.com/walmart/
Costco Store
https://www.youtube.com/watch?v=Z-j3u5xYgyc<br>
37
Crafting strategy post Dupont Once we look at the firm’s Dupont and other ratios (such as Sales/GSA Expense ratio), we might want to suggest that the firm move in the direction of increasing profit margin or in the direction of decreasing costs by increasing volume.
This decision has to be taken, keeping in mind the capabilities and resources that the firm possesses. It is also necessary to look at the competitive environment. If there are many competing brands, then it might not be a valuable strategy to create a new brand, ab initio, in the same space. All the other Porter framework forces have to be considered.
If the decision is to move in the direction of higher profit margin, then the firm might want to think in terms of a better brand. It might want to look at the ratio of Sales to advertising expenses.
It might want to increase trade promotion efforts, as well.
If it pursues the goal of higher volume, then a lower price and all that it entails is indicated. However, this may be achieved through different strategies, e.g. coupons or other off-price methods. Better credit terms may also be an option.<br>
This decision has to be taken, keeping in mind the capabilities and resources that the firm possesses. It is also necessary to look at the competitive environment. If there are many competing brands, then it might not be a valuable strategy to create a new brand, ab initio, in the same space. All the other Porter framework forces have to be considered.
If the decision is to move in the direction of higher profit margin, then the firm might want to think in terms of a better brand. It might want to look at the ratio of Sales to advertising expenses.
It might want to increase trade promotion efforts, as well.
If it pursues the goal of higher volume, then a lower price and all that it entails is indicated. However, this may be achieved through different strategies, e.g. coupons or other off-price methods. Better credit terms may also be an option.<br>
38
A more nuanced view of Dupont Dupont Analysis is not simply an issue of volume versus branding. We can get higher profit margin, either by increasing the price that customers are willing to pay for an item or by decreasing costs, but this will generally only be possible by increasing assets correspondingly – either assets, such as inventory monitoring software/hardware that cuts costs or R&D, which can improve profits by improving product quality.
It’s also an issue of whether we want to rely on short-term or long-term financing.
If it’s short-term financing, then the emphasis is on higher inventory and higher accounts receivable and lower accounts payable.
If it’s long-term financing, then the focus is on R&D or other inventory-control.<br>
It’s also an issue of whether we want to rely on short-term or long-term financing.
If it’s short-term financing, then the emphasis is on higher inventory and higher accounts receivable and lower accounts payable.
If it’s long-term financing, then the focus is on R&D or other inventory-control.<br>
39
The Case of Zara Zara developed a highly responsive supply chain that enables delivery of new fashions as soon as a trend emerges. Zara delivers new products twice each week to its 1,763 stores around the world.
Rather than subcontracting manufacturing to Asia, it has built 14 highly automated Spanish factories, where robots work around the clock cutting and dyeing fabrics and creating unfinished “gray goods,” the foundations of their final products.
It has also created a partner network of more than 300 small shops in Portugal and Galicia to handle the finishing work where, the gray goods are transformed into dresses and suits
Riitu Jhamb, slideshare (https://www.scmglobe.com/zara-clothing-company-supply-chain/)<br>
Rather than subcontracting manufacturing to Asia, it has built 14 highly automated Spanish factories, where robots work around the clock cutting and dyeing fabrics and creating unfinished “gray goods,” the foundations of their final products.
It has also created a partner network of more than 300 small shops in Portugal and Galicia to handle the finishing work where, the gray goods are transformed into dresses and suits
Riitu Jhamb, slideshare (https://www.scmglobe.com/zara-clothing-company-supply-chain/)<br>
40
Asset Efficiency & Profit Margin Financial decisions reflected in accounts payable and accounts receivable, which affect short-term working capital, have implications for investment decisions in other short-term and long-term assets.
By making investments in these assets, we can increase the profit margin either by
increasing the price which customers are willing to pay for our products or
decreasing the cost of producing the goods.
These are accomplished by investment in different kinds of investments.
Investment in assets such as trade-marks and similar intangibles are likely to lead to reduced asset-use efficiency, while they will allow for higher prices.
Investment in assets that improve production processes are designed to increased asset use efficiency and lower cost of goods sold.
This tradeoff is captured by the Dupont model equation, which shows the substitutability of profit margin and asset use efficiency.
The Dupont model thus leads us directly to consider the firm’s strategic decision in terms of which of these two areas it should focus on – volume or margin; and in each area, we have the choice of financing or operating decisions to reach our goals.<br>
By making investments in these assets, we can increase the profit margin either by
increasing the price which customers are willing to pay for our products or
decreasing the cost of producing the goods.
These are accomplished by investment in different kinds of investments.
Investment in assets such as trade-marks and similar intangibles are likely to lead to reduced asset-use efficiency, while they will allow for higher prices.
Investment in assets that improve production processes are designed to increased asset use efficiency and lower cost of goods sold.
This tradeoff is captured by the Dupont model equation, which shows the substitutability of profit margin and asset use efficiency.
The Dupont model thus leads us directly to consider the firm’s strategic decision in terms of which of these two areas it should focus on – volume or margin; and in each area, we have the choice of financing or operating decisions to reach our goals.<br>
41
Gerald Smith & Profit Leveraging Op ROA = Profit Margin x Asset Turnover (AT)
Hence D ROA/ D Profit Margin = AT, i.e the rate at which a change in the profit margin affects ROA equal the AT.
This implies that high AT firms should try to improve margins
For each unit increase in Margin, ROA increases by the amount of Op AT
Similarly, D ROA/ D AT = Profit Margin
This implies that high Profit Margin firms should improve Asset Turnover!
For each unit increase in AT, ROA increases by the amount of the Profit Margin<br>
Hence D ROA/ D Profit Margin = AT, i.e the rate at which a change in the profit margin affects ROA equal the AT.
This implies that high AT firms should try to improve margins
For each unit increase in Margin, ROA increases by the amount of Op AT
Similarly, D ROA/ D AT = Profit Margin
This implies that high Profit Margin firms should improve Asset Turnover!
For each unit increase in AT, ROA increases by the amount of the Profit Margin<br>
42
Low Gross Margin Strategies If Op Margins are low, then driving volume may not be valuable. It might be better to focus on improving margins for a presumably large customer base.
This may be done by thinking of the customer as the unit of analysis, rather than the product.
Cross-selling the customer other potentially higher-margin products may be more valuable. Even though these customers may be price sensitive, it may be possible to selectively cross-sell allied products at higher margins.
For example, U-Haul strategically sets low prices and margins on basic truck and trailer rentals to maintain a large mass-market base,
but then promotes add-on ancillary products and services offered and promoted to its large base of self-service customers, such as moving boxes, dollies, lifts etc.
What strategy is this?<br>
This may be done by thinking of the customer as the unit of analysis, rather than the product.
Cross-selling the customer other potentially higher-margin products may be more valuable. Even though these customers may be price sensitive, it may be possible to selectively cross-sell allied products at higher margins.
For example, U-Haul strategically sets low prices and margins on basic truck and trailer rentals to maintain a large mass-market base,
but then promotes add-on ancillary products and services offered and promoted to its large base of self-service customers, such as moving boxes, dollies, lifts etc.
What strategy is this?<br>
43
High Gross Margin Strategies? For high gross margin products, an effective strategy might be to go beyond the specific segment currently being served.
This could be done by using intensive advertising to drive product sales volume across the entire market, regardless of the varying price sensitivities of different market segments and to aggressively use sales promotions and price discounting to stimulate sales volume because initial margins are large enough to permit discounting.
However, discounting might work against branding. To guard against this, advertising, loyalty programs, innovation and distribution activities can be used to reduce price sensitivity and to increase the likelihood of repeat purchases.
Examples: Packaged goods companies like Kellogg, General Mills and Kraft General Foods use such a model in their breakfast cereals segments.
What kind of strategy is this?<br>
This could be done by using intensive advertising to drive product sales volume across the entire market, regardless of the varying price sensitivities of different market segments and to aggressively use sales promotions and price discounting to stimulate sales volume because initial margins are large enough to permit discounting.
However, discounting might work against branding. To guard against this, advertising, loyalty programs, innovation and distribution activities can be used to reduce price sensitivity and to increase the likelihood of repeat purchases.
Examples: Packaged goods companies like Kellogg, General Mills and Kraft General Foods use such a model in their breakfast cereals segments.
What kind of strategy is this?<br>
44
Bibliography Flesher, Dale and Gary Previts, “Donaldson Brown (1885-1965): The power of an individual and his ideas over time,” The Accounting Historians Journal, vol. 40, issue 1, 2013.
Swinyard, William, http://marriottschool.net/teacher/swinyard/Retailing/<br>
Swinyard, William, http://marriottschool.net/teacher/swinyard/Retailing/<br>