The Global Infrastructure Gap: Potential, Perils, and a Framework for Distinction Camille Gardner: Brown University Peter Blair Henry: New York University, PhD Excellence Initiative March 2022 Fact 1 In poor countries, 1.2 billion people
"The Global Infrastructure Gap: Potential, Perils," is the property of its rightful owner. Permission is granted to
download and print the materials on this website for personal, non-commercial use only, and to display it
on your personal computer provided you do not modify the materials and that you retain all copyright
notices contained in the materials. By downloading content from our website, you accept the terms of this
agreement.
Presentation Transcript
01
The Global Infrastructure Gap: Potential, Perils, and a Framework for Distinction Camille Gardner: Brown University
Peter Blair Henry: New York University, PhD Excellence Initiative
March 2022<br>
02
Fact 1 In poor countries, 1.2 billion people have no electricity and 1 billion live more than 2 kilometers from an all-weather road (Rozenberg and Fay 2019).<br>
03
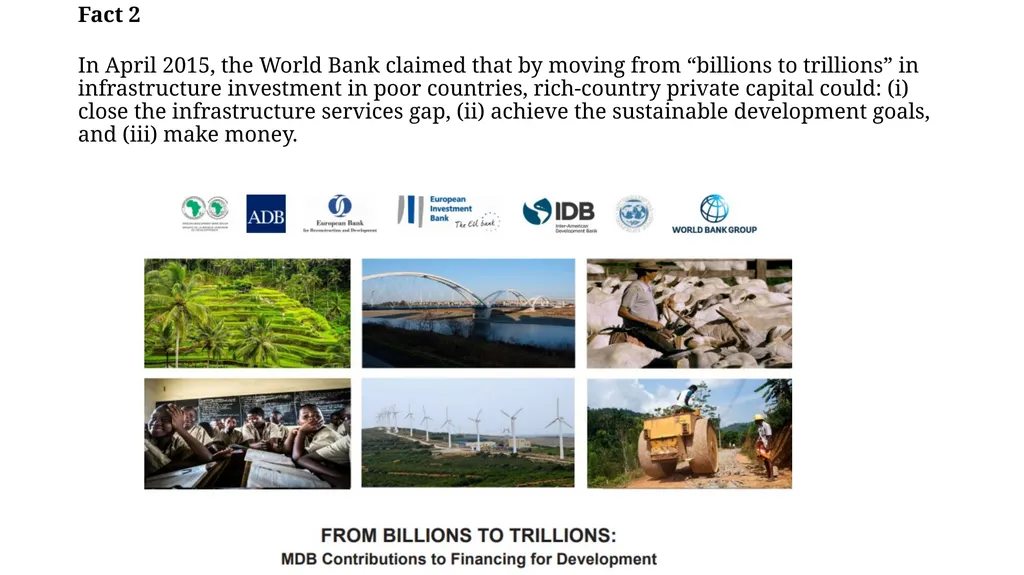
Fact 2 In April 2015, the World Bank claimed that by moving from “billions to trillions” in infrastructure investment in poor countries, rich-country private capital could: (i) close the infrastructure services gap, (ii) achieve the sustainable development goals, and (iii) make money.<br>
04
This Paper: Introduces a simple equilibrium framework that distinguishes those poor countries in which the Bank’s three-fold claim is tenable from those where it is not.
The Dual-Hurdle Framework: (1) provides a practical tool for setting infrastructure priorities; (2) can be applied to projects within countries as readily as it can to cross-country analysis.
Generating, validating, and making publicly available the data required to apply dual-hurdle analyses—both within and across countries—is a big opportunity for the Bank to do well and good.<br>
05
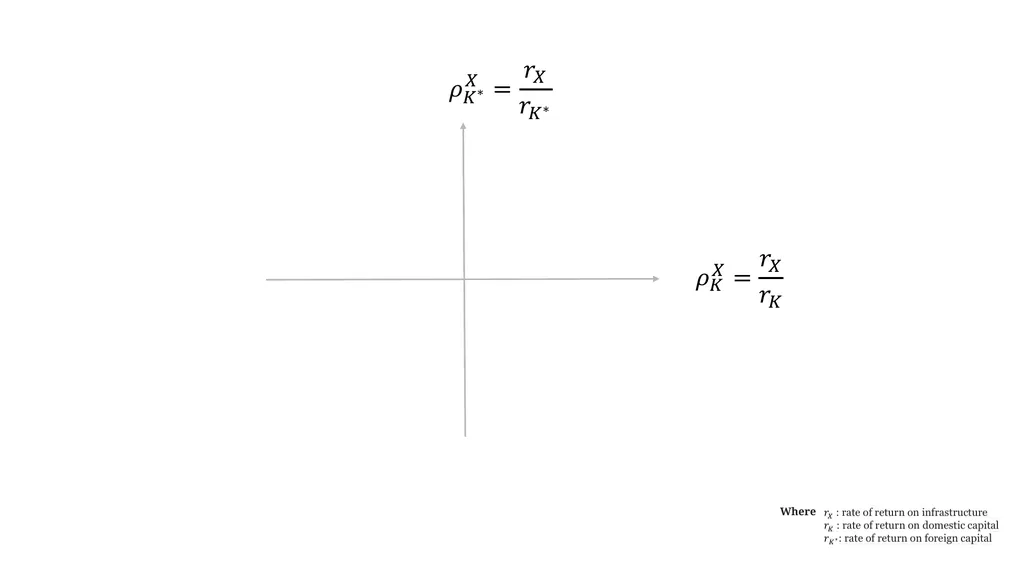
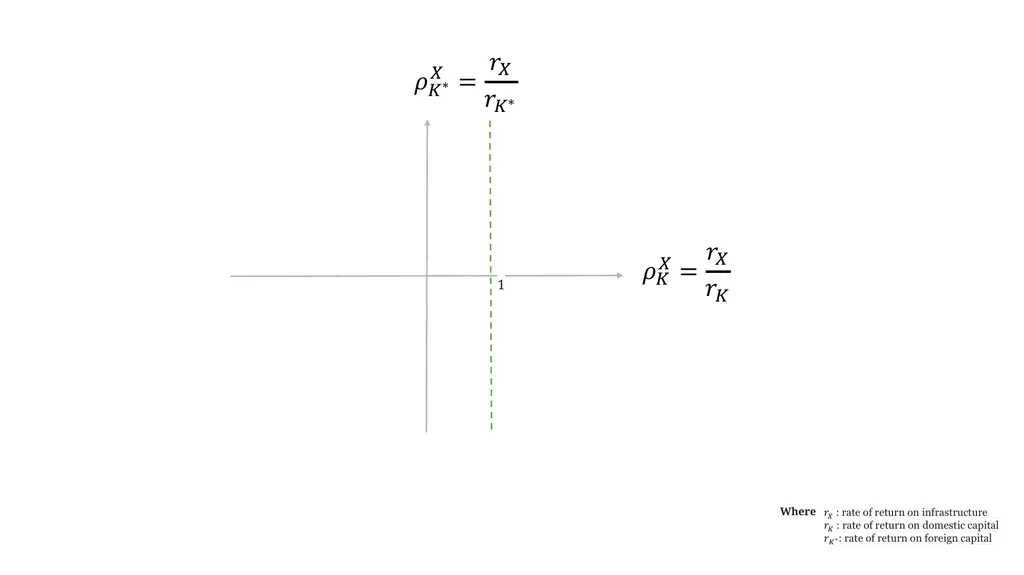
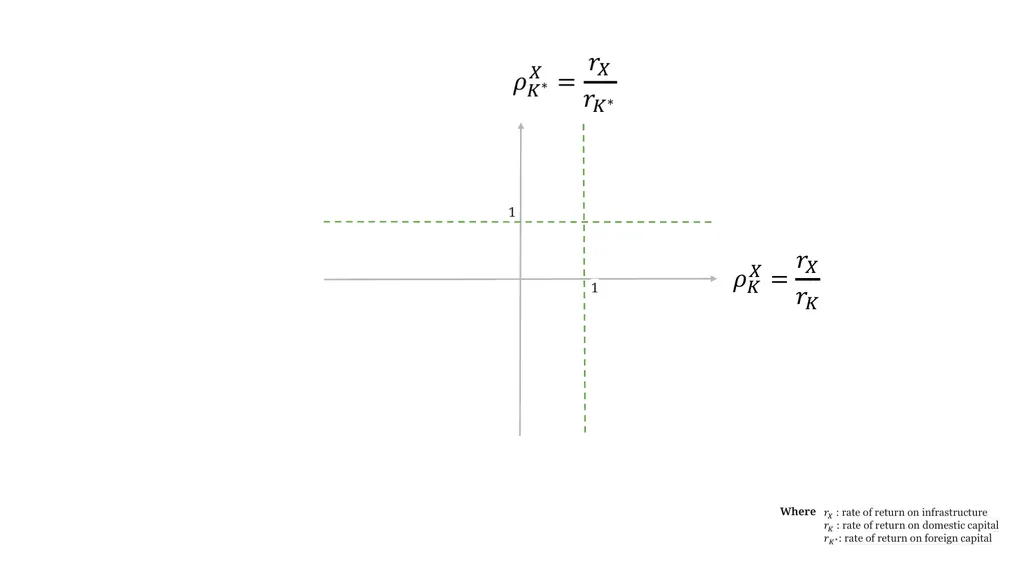
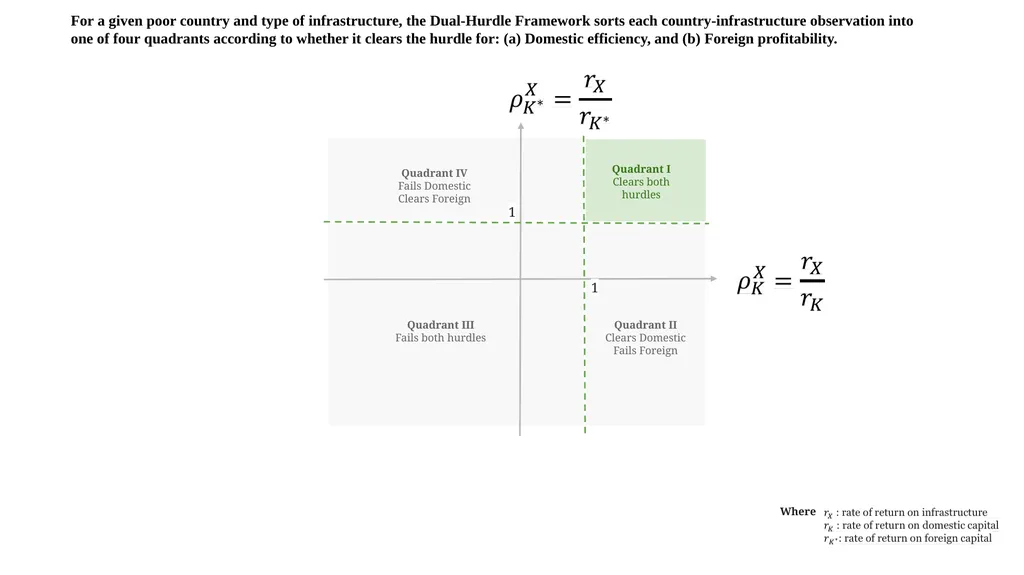
For a given poor country and type of infrastructure, the Dual-Hurdle Framework sorts each country-infrastructure observation into one of four quadrants according to whether it clears the hurdle for: (a) Domestic efficiency, and (b) Foreign profitability.<br>
06
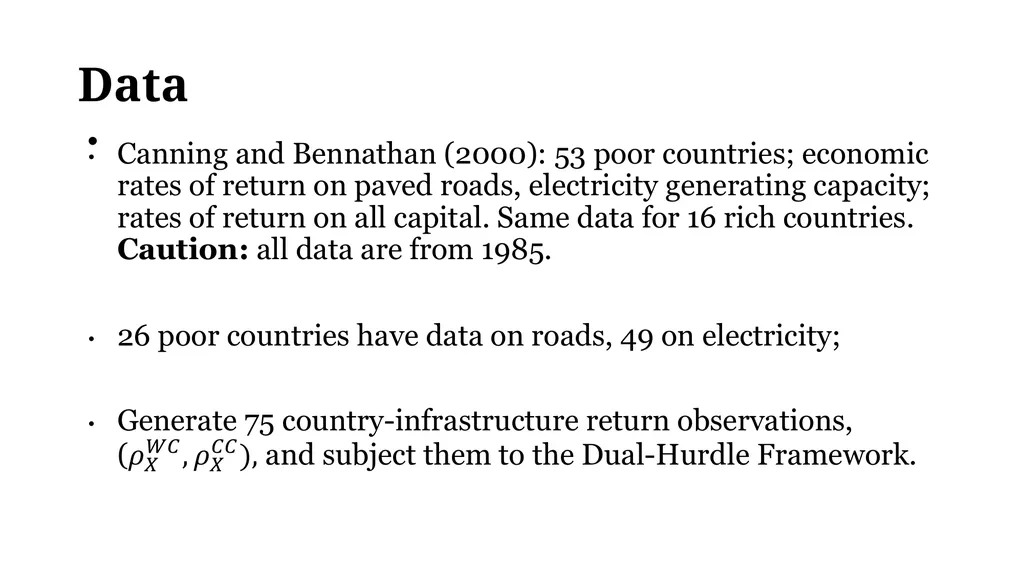
Data<br>
07
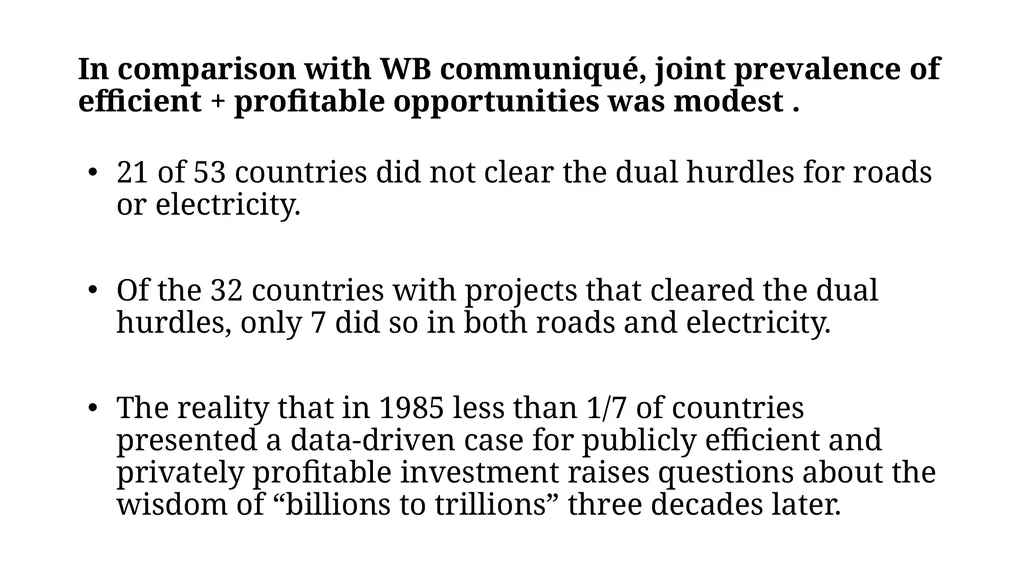
In comparison with WB communiqué, joint prevalence of efficient + profitable opportunities was modest . 21 of 53 countries did not clear the dual hurdles for roads or electricity.
Of the 32 countries with projects that cleared the dual hurdles, only 7 did so in both roads and electricity.
The reality that in 1985 less than 1/7 of countries presented a data-driven case for publicly efficient and privately profitable investment raises questions about the wisdom of “billions to trillions” three decades later.<br>
08
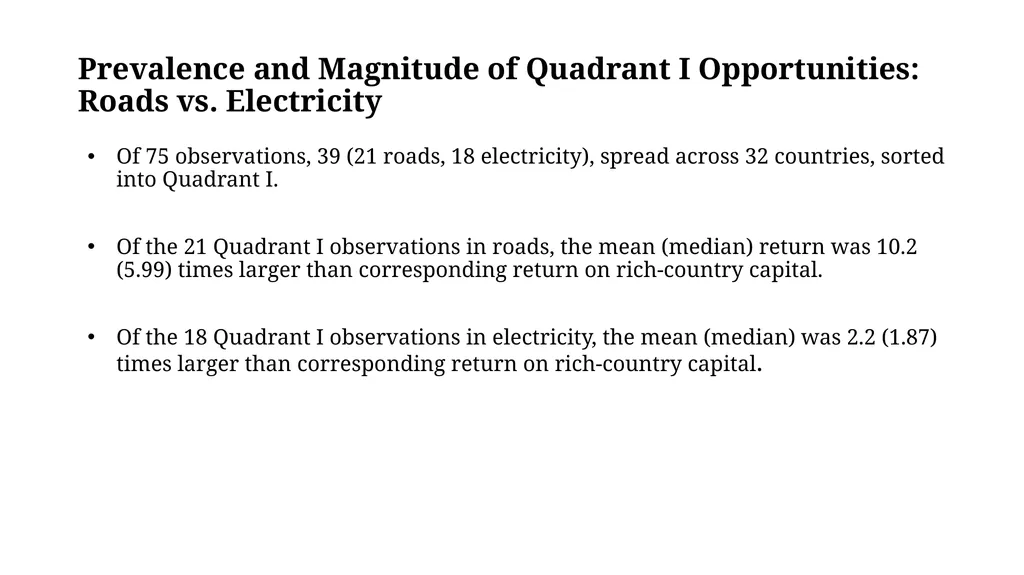
Prevalence and Magnitude of Quadrant I Opportunities: Roads vs. Electricity Of 75 observations, 39 (21 roads, 18 electricity), spread across 32 countries, sorted into Quadrant I.
Of the 21 Quadrant I observations in roads, the mean (median) return was 10.2 (5.99) times larger than corresponding return on rich-country capital.
Of the 18 Quadrant I observations in electricity, the mean (median) was 2.2 (1.87) times larger than corresponding return on rich-country capital.<br>
09
Alternative order-of-magnitude comparisons The average excess-return multiple on poor-country roads in 1985 was roughly 7 times the excess-return multiple on portfolio equity in poor countries, which, once their stock markets were liberalized, presented an arbitrage opportunity large enough to fuel the rise of the emerging-market equity fund industry.
Tradable claims on poor-country infrastructure are still limited, but the dual-hurdle analysis provides a framework for distinguishing countries where the creation of tradable claims might be beneficial from those where it would not.<br>
10
Conclusion: Too much has happened since 1985 to draw distinctions based on information from that year, but the new analysis of old data in this paper:
(a) provides a template that can readily be applied to updated data (cross- and within-country) on the economic rates of return on various types of infrastructure; and
(b) demonstrates the utility (and urgency) of the World Bank collecting and disseminating that data as soon as possible.<br>