The Government’s leaked analysis of Brexit costs
Author : myesha-ticknor | Published Date : 2025-05-24
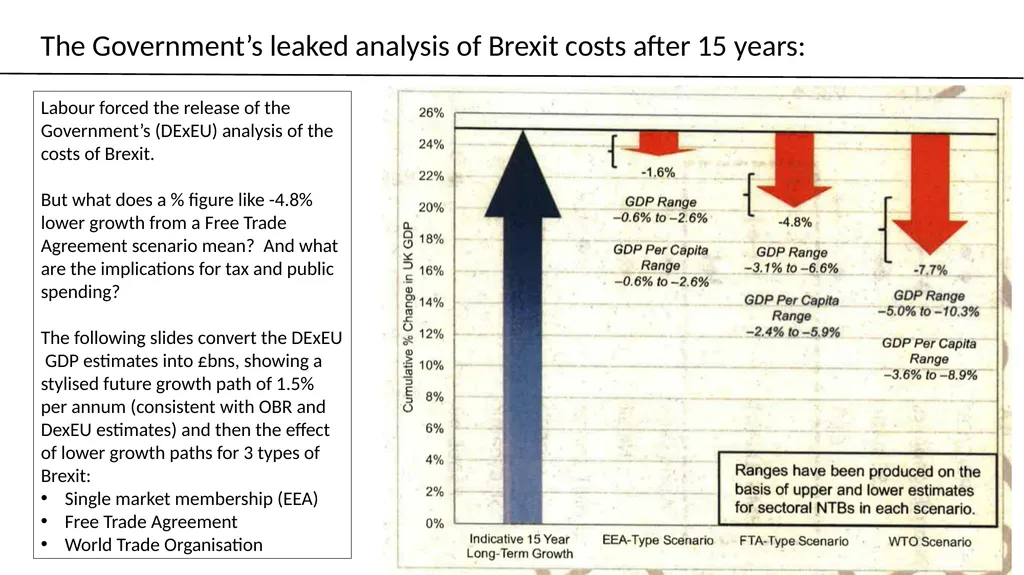
Description: The Governments leaked analysis of Brexit costs after 15 years Labour forced the release of the Governments DExEU analysis of the costs of Brexit But what does a figure like 48 lower growth from a Free Trade Agreement scenario
Presentation Embed Code
Download Presentation
Download
Presentation The PPT/PDF document
"The Government’s leaked analysis of Brexit costs" is the property of its rightful owner.
Permission is granted to download and print the materials on this website for personal, non-commercial use only,
and to display it on your personal computer provided you do not modify the materials and that you retain all
copyright notices contained in the materials. By downloading content from our website, you accept the terms of
this agreement.
Transcript:The Government’s leaked analysis of Brexit costs:
The Government’s leaked analysis of Brexit costs after 15 years: Labour forced the release of the Government’s (DExEU) analysis of the costs of Brexit. But what does a % figure like -4.8% lower growth from a Free Trade Agreement scenario mean? And what are the implications for tax and public spending? The following slides convert the DExEU GDP estimates into £bns, showing a stylised future growth path of 1.5% per annum (consistent with OBR and DexEU estimates) and then the effect of lower growth paths for 3 types of Brexit: Single market membership (EEA) Free Trade Agreement World Trade Organisation Expressed in £s, growth continues, but is lower than might have been. Normal growth rate is estimated by OBR to be 1.5%. To arrive at -7.7% lower growth in 2032 under WTO rules implies an average annual growth rate of 0.939%. FTA type Brexit implies annual growth of 1.148%. EEA type Brexit implies annual growth rate 1.371%. E.g. a Free Trade Agreement leads to foregone GDP of over £100bn pa by 2032 Labour, of course, would not contemplate a no deal / WTO type Brexit. Instead the choice is between some form of single market membership and FTA. The next slide draws out the difference between those two options. Labour has a choice of supporting single market membership or an FTA: the difference between these options is c. £80bn p.a. in foregone GDP by 2032 Adding up each years’ foregone GDP: the cumulative total over 15 years is c. £600bn difference between single market membership and an FTA To put this figure in perspective the Labour manifesto promised a National Transformation Fund of £250 billion, to be spent over 10 years, to invest in the UK’s infrastructure. With an FTA foregone tax revenue reaches over £40bn per annum by 2032 Again, the next slide draws out the difference between single market membership and an FTA. The choice for Labour: the difference between an FTA and single market membership is nearly £30bn per annum tax revenue foregone by 2032 Foregone tax revenue quickly adds up: cumulative total by 2032: over £200bn difference between single market membership and an FTA Notes and assumptions The spreadsheet containing the data and calculations can be found at https://www.nickdonovan.org.uk/npf. I am grateful to four macro-economists for checking the data and calculations, and their helpful comments. I have stressed the difference between an FTA and single market