Those who do not remember the past are condemned to repeat it George Santayana Spanish philosopher, poet and novelist(1863-1952) Basic Predictive Analysis Basics of Time Series Analysis Introduction to Forecasting Time Series Introduction
"Those who do not remember the past are condemned" is the property of its rightful owner. Permission is granted to
download and print the materials on this website for personal, non-commercial use only, and to display it
on your personal computer provided you do not modify the materials and that you retain all copyright
notices contained in the materials. By downloading content from our website, you accept the terms of this
agreement.
Presentation Transcript
01
Those who do not remember the past are condemned to repeat it
George Santayana Spanish philosopher, poet and novelist(1863-1952) Basic Predictive Analysis
Basics of Time Series Analysis
Introduction to Forecasting & Time Series<br>
02
Introduction to Forecasting and Time Series<br>
03
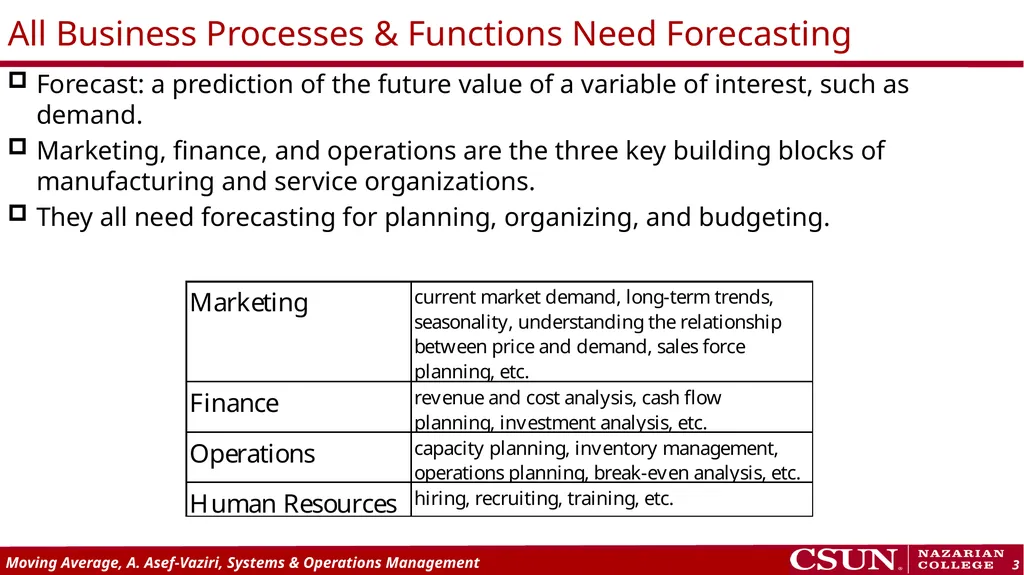
Forecast: a prediction of the future value of a variable of interest, such as demand.
Marketing, finance, and operations are the three key building blocks of manufacturing and service organizations.
They all need forecasting for planning, organizing, and budgeting. All Business Processes & Functions Need Forecasting<br>
04
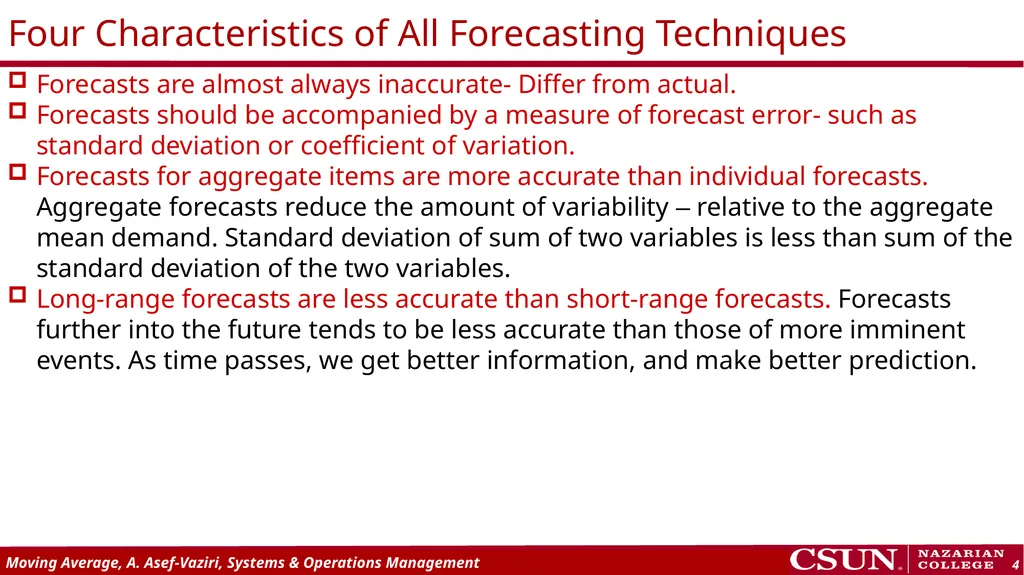
Forecasts are almost always inaccurate- Differ from actual.
Forecasts should be accompanied by a measure of forecast error- such as standard deviation or coefficient of variation.
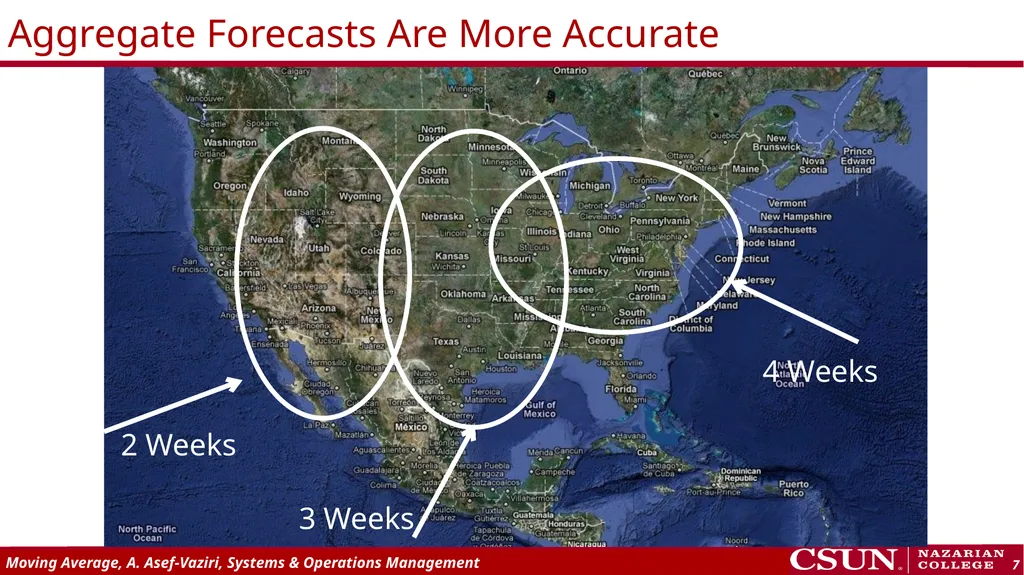
Forecasts for aggregate items are more accurate than individual forecasts. Aggregate forecasts reduce the amount of variability – relative to the aggregate mean demand. Standard deviation of sum of two variables is less than sum of the standard deviation of the two variables.
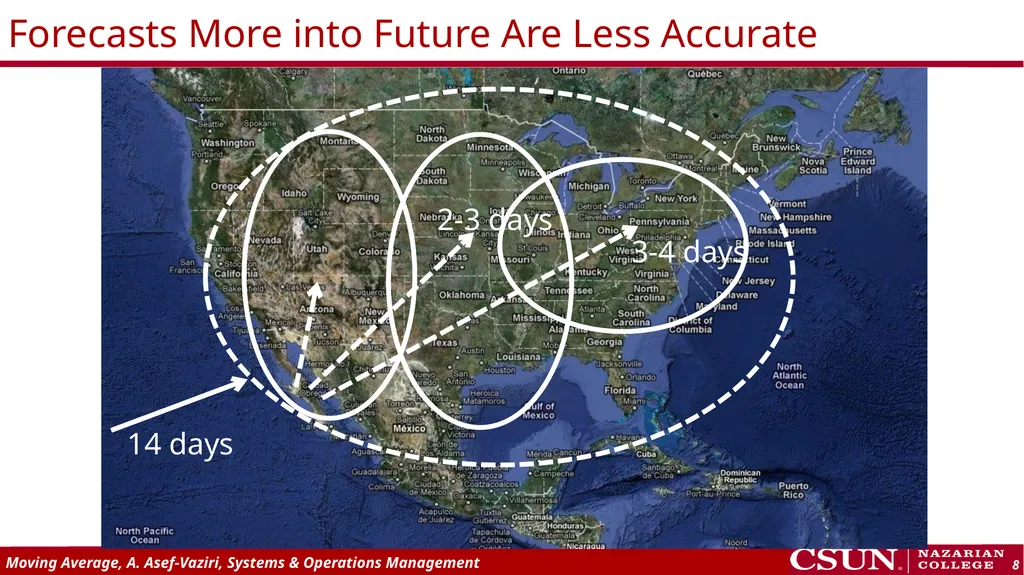
Long-range forecasts are less accurate than short-range forecasts. Forecasts further into the future tends to be less accurate than those of more imminent events. As time passes, we get better information, and make better prediction. Four Characteristics of All Forecasting Techniques<br>
05
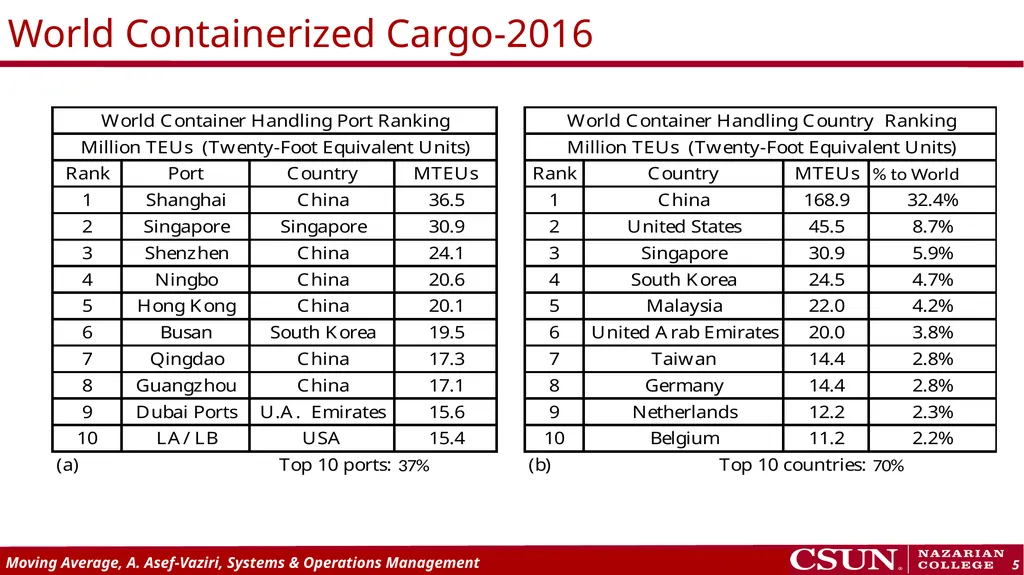
World Containerized Cargo-2016<br>
06
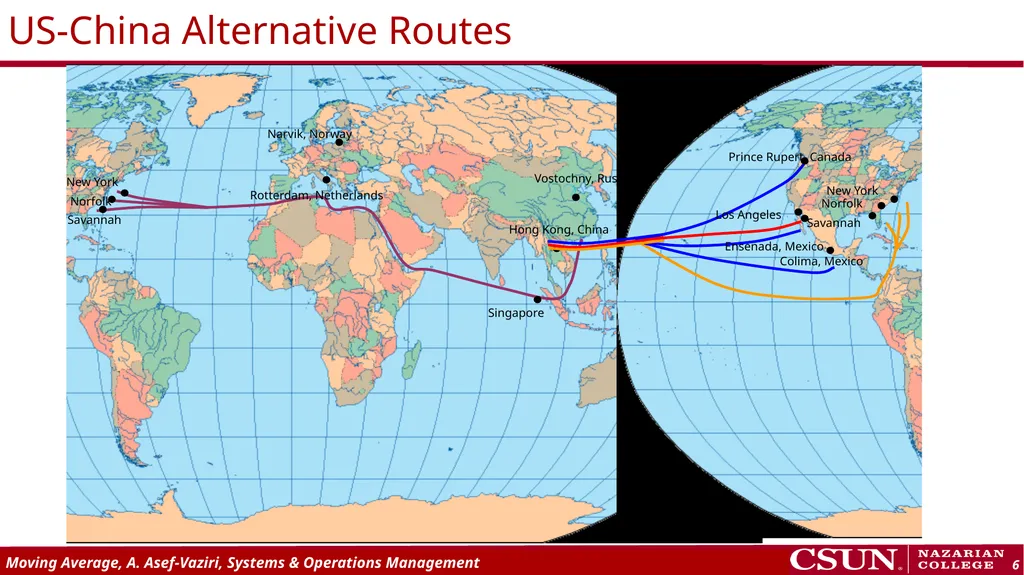
US-China Alternative Routes Narvik, Norway Vostochny, Russia Hong Kong, China Singapore Rotterdam, Netherlands Savannah Norfolk New York Prince Rupert, Canada Savannah Norfolk New York Los Angeles Colima, Mexico Ensenada, Mexico<br>
07
Aggregate Forecasts Are More Accurate<br>
08
Forecasts More into Future Are Less Accurate<br>
09
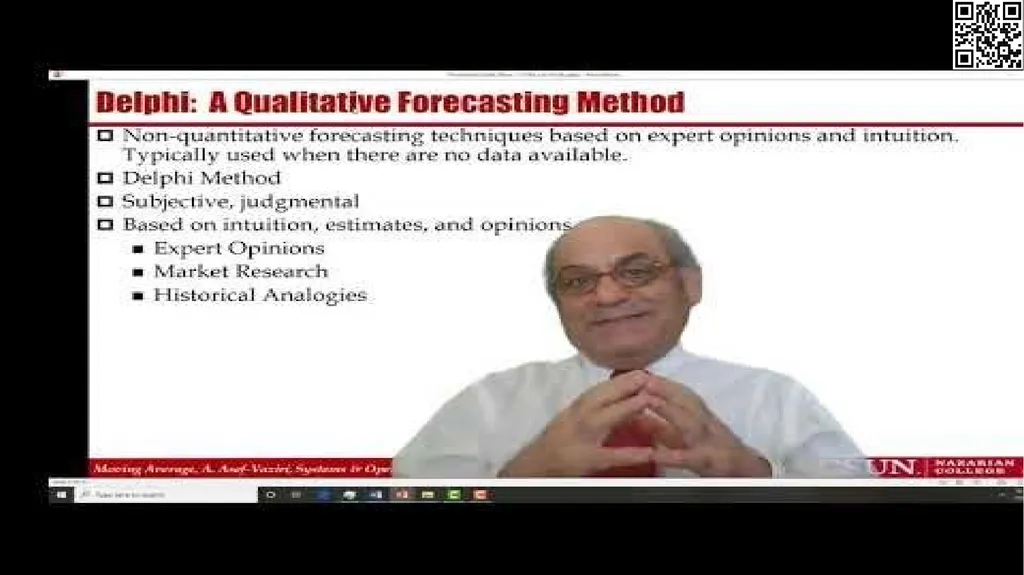
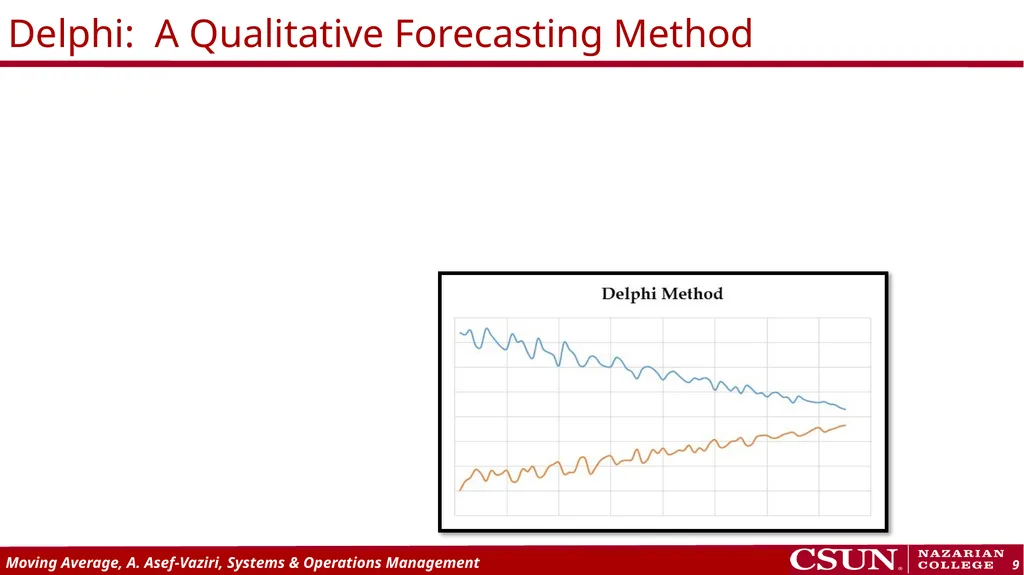
Delphi: A Qualitative Forecasting Method Non-quantitative forecasting techniques based on expert opinions and intuition. Typically used when there are no data available.
Delphi Method
Subjective, judgmental
Based on intuition, estimates, and opinions
Expert Opinions
Market Research
Historical Analogies<br>
10
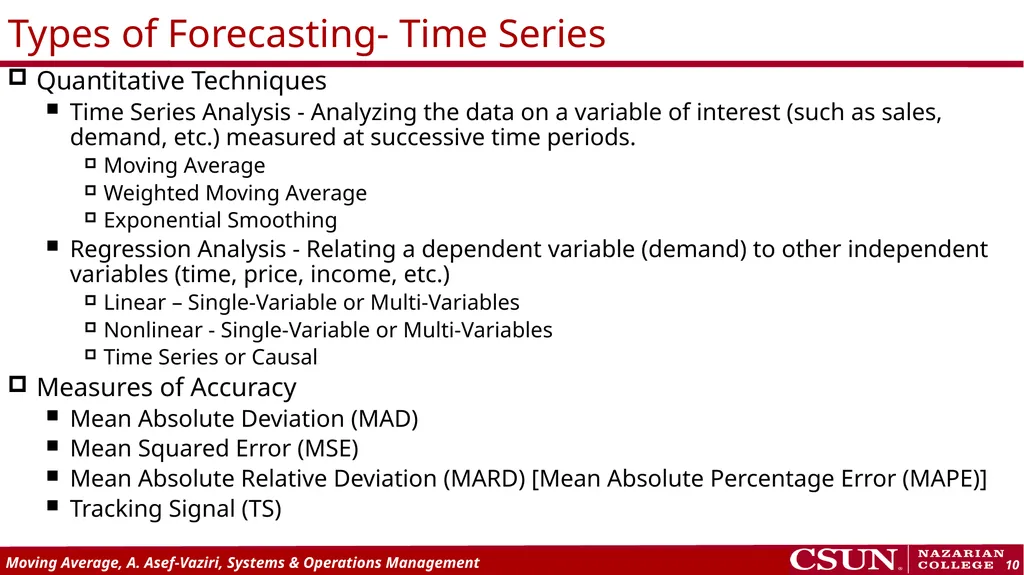
Quantitative Techniques
Time Series Analysis - Analyzing the data on a variable of interest (such as sales, demand, etc.) measured at successive time periods.
Moving Average
Weighted Moving Average
Exponential Smoothing
Regression Analysis - Relating a dependent variable (demand) to other independent variables (time, price, income, etc.)
Linear – Single-Variable or Multi-Variables
Nonlinear - Single-Variable or Multi-Variables
Time Series or Causal
Measures of Accuracy
Mean Absolute Deviation (MAD)
Mean Squared Error (MSE)
Mean Absolute Relative Deviation (MARD) [Mean Absolute Percentage Error (MAPE)]
Tracking Signal (TS) Types of Forecasting- Time Series<br>
11
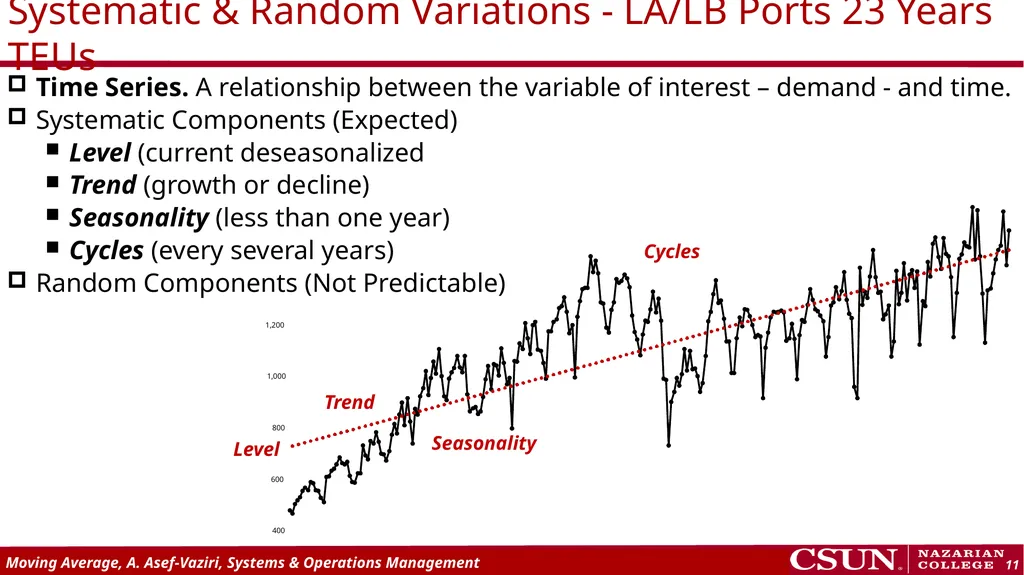
Systematic & Random Variations - LA/LB Ports 23 Years TEUs Time Series. A relationship between the variable of interest – demand - and time.
Systematic Components (Expected)
Level (current deseasonalized
Trend (growth or decline)
Seasonality (less than one year)
Cycles (every several years)
Random Components (Not Predictable) Level Trend Seasonality Cycles<br>
12
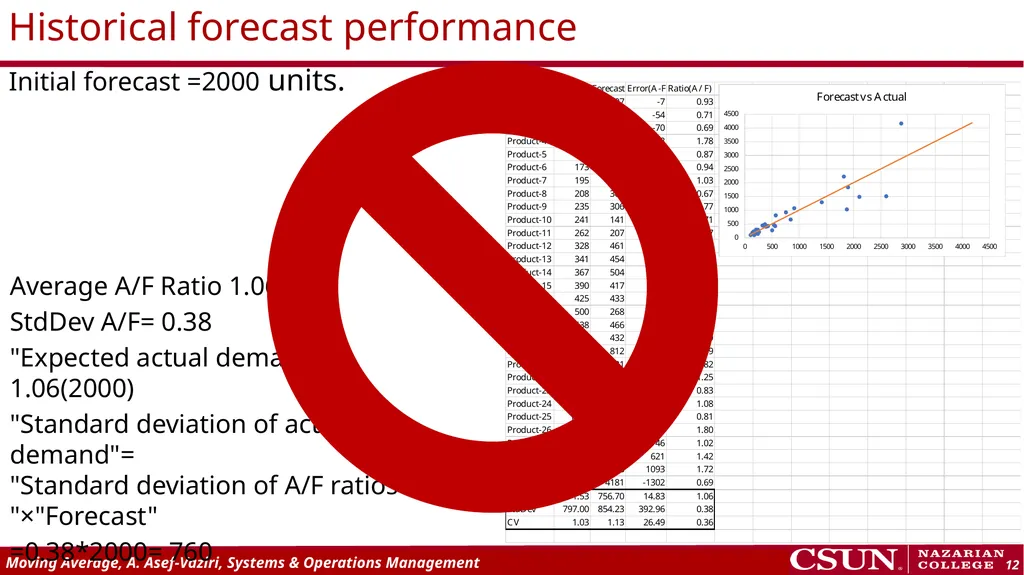
Historical forecast performance Initial forecast =2000 units. Average A/F Ratio 1.06
StdDev A/F= 0.38
"Expected actual demand "= 1.06(2000)
"Standard deviation of actual demand"= "Standard deviation of A/F ratios "×"Forecast"
=0.38*2000= 760
A~N(2120,760)<br>
13
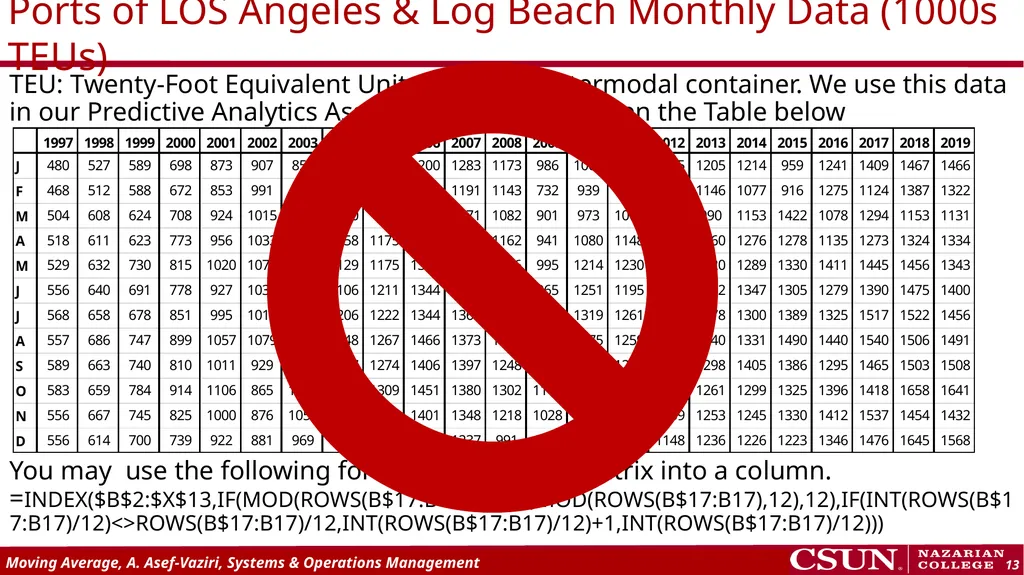
Ports of LOS Angeles & Log Beach Monthly Data (1000s TEUs) TEU: Twenty-Foot Equivalent Unit – A 20 feet intermodal container. We use this data in our Predictive Analytics Assignment. You may open the Table below You may use the following formula to turn the matrix into a column. =INDEX($B$2:$X$13,IF(MOD(ROWS(B$17:B17),12)>0,MOD(ROWS(B$17:B17),12),12),IF(INT(ROWS(B$17:B17)/12)<>ROWS(B$17:B17)/12,INT(ROWS(B$17:B17)/12)+1,INT(ROWS(B$17:B17)/12)))<br>
14
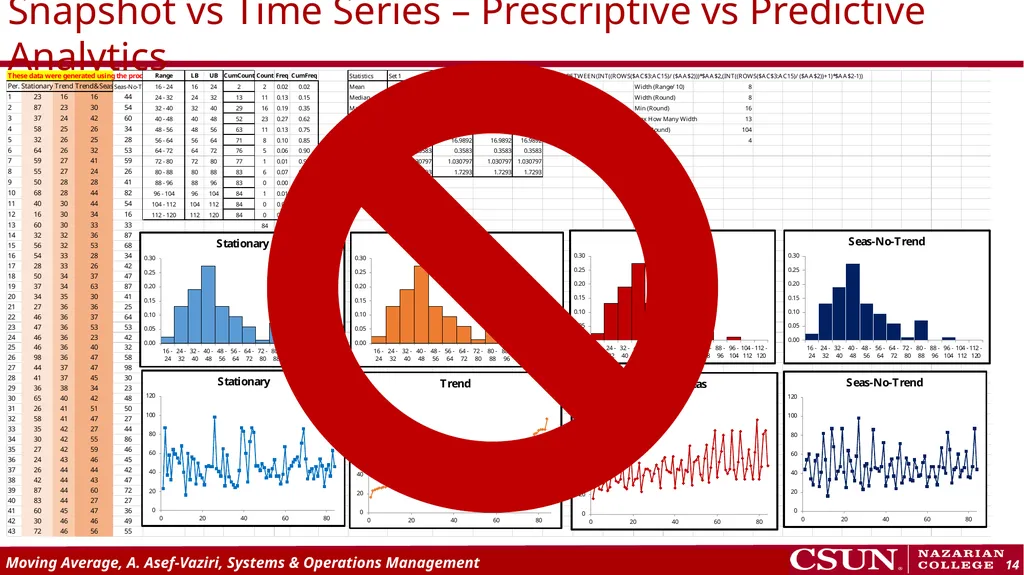
Snapshot vs Time Series – Prescriptive vs Predictive Analytics<br>