
Throughput World These sides and note were
Description: Throughput World These sides and note were prepared using 1. The book Streamlined: 14 Principles for Building and Managing the Lean Supply Chain. 2004. Srinivasan. TOMPSON ISBN: 978-0-324-23277-6. 2. The slides originally prepared by
Related Topics
Download Presentation
"Throughput World These sides and note were" is the property of its rightful owner. Permission is granted to download and print the materials on this website for personal, non-commercial use only, and to display it on your personal computer provided you do not modify the materials and that you retain all copyright notices contained in the materials. By downloading content from our website, you accept the terms of this agreement.
Presentation Transcript
slide1. Throughput World These sides and note were prepared using
1. The book Streamlined: 14 Principles for Building and Managing the Lean Supply Chain. 2004. Srinivasan. TOMPSON ISBN: 978-0-324-23277-6.
2. The slides originally prepared by Professor M. M. Srinivasan.
3. Operations Management. Jacobs and Chase. McGraw-Hill. Complex solutions do not work,
the more complex the problem
the simpler the solution must be.
Eli Goldratt.<br>
slide2. TOC owes its origin to Eliahu Goldratt, an Israeli physicist. The basic idea was published in his book; The Goal (1984).
TOC Premise 1: The Goal of a business is to make more money, … in the present and in the future Max NPV.
Just like the links of a chain, the processes within the enterprise work together to generate profit for the stakeholders.
The chain is only as strong as its weakest link.
TOC Premise 2: There is one or at most few constraint(s) determine its output. Theory of Constraints (TOC)<br>
slide3. Systems Thinking and TOC Focus on maximizing the productive use of the bottleneck. Schedule it to maximize throughput. The other resources can be schedule subsequently since they have available capacity by definition.
Principle: Time lost at a bottleneck resource results in a loss of throughput for the whole enterprise. Time saved a non-bottleneck resources is a mirage.
The traditional management lives in a cost world; minimizing costs and improving efficiencies. A complex system is broken down into smaller parts; cost or profit centers with local targets. Cost or profit centers achieve/beat targets; if every unit improved locally then the entire enterprise would improve globally. Managers in cost world think locally.<br>
slide4. Cost World – Local Optimization To improve performance of the total system, it is not enough to improve performance of the isolated functions; it is Local Optimization, it ignores the interactions between the various functions. Cost world thinks locally. The throughput world thinks globally.
An increase in the cost of an engine of $30 would have decreased the cost of the transmission by $80. The center producing the engine is reluctant to do so.<br>
slide5. Systems Approach The story of the blind men and an elephant originated in India, where it was widely disseminated. Rumi, the 13th Century Persian poet and teacher of Sufism, included it in his retelling, "The Elephant in the Dark," uses this story as an example of the limits of individual perception.
Some Hindus had brought an elephant for exhibition and placed it in a dark house. Crowds of people were going into that dark place to see the beast. Finding that ocular inspection was impossible, each visitor felt it with his palm in the darkness.
The palm of one fell on the trunk. This creature is like a water-spout, he said.
The hand of another rested on the elephant’s ear. To him the beast was evidently like a fan.<br>
slide6. Systems Approach Another rubbed against its leg. “I found the elephant’s shape is like a pillar,” he said.
Another laid his hand on its back. Certainly this elephant was like a throne, he said.
Rumi ends his poem by stating; if each had a candle and they went in together the differences would disappear.
Jalaluddin Rumi is not only the teacher of Sufism, but among other things, the messenger of system-thinking.<br>
slide7. The 5 Step TOC Focusing Process Step 1: Identify the System’s Constraint(s)
Step 2: Decide how to Exploit the System’s Constraints
Step 3: Subordinate Everything Else to that Decision
Step 4: Elevate the System’s Constraints
Step 5: If a Constraint Was Broken in previous Steps, Go to Step 1 Performance of subsystems to be linked to the performance of the total system. The 5-Steps in a continuing Process.<br>
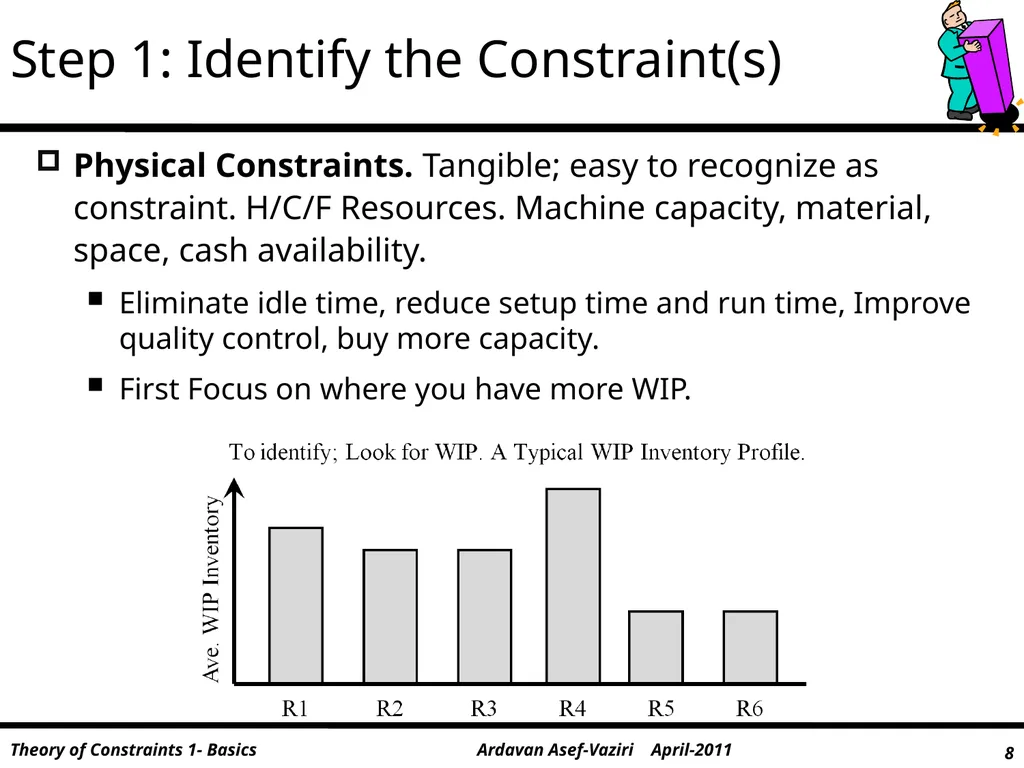
slide8. Step 1: Identify the Constraint(s) Physical Constraints. Tangible; easy to recognize as constraint. H/C/F Resources. Machine capacity, material, space, cash availability.
Eliminate idle time, reduce setup time and run time, Improve quality control, buy more capacity.
First Focus on where you have more WIP.<br>
slide9. Market Constraints Demand for company’s products and services is less than capacity, or not in desired proportion.
Harder to identify than physical constraints.
Excess capacity is easily identified as a market constraint.
Make an offer the customer cannot refuse! P > V<br>
slide10. Policy Constraints Methods Constraints. Never producing a batch of units below an EOQ; producing products for which there is no current demand. A flawed method of absorption costing that adds value to a product as it moves through a series of process steps.
Measures Constraints. Buying large quantities for quantity discounts. Paying sales commission based on volume of sale. Rewarding managers if they utilize their resources to produce more output because a higher output better absorbs labor and overhead. Tell me how you measure me and I will tell you how I behave.
Mindset Constraints. Shop supervisor believes operators should be busy all of the time. The enterprise can become profitable through outsourcing. You don't understand, we are different, that won't work here!<br>
slide11. Step 2 : Decide How to Exploit the System’s Constraint(s) Exploiting the constraint means using the constraint as profitably as possible
Until the constraints are overcome by other means, the enterprise should work them as profitably (effectively) as possible.
The real meaning of the word exploit?
If constraint is physical resource, ensure the resource is never idle.
If the market is the constraint, exploit by ensuring not a single sale is lost as a result of our action or inaction.
Market constraint implies extra capacity, so we exploit this by guaranteeing 100% on time delivery to customer.<br>
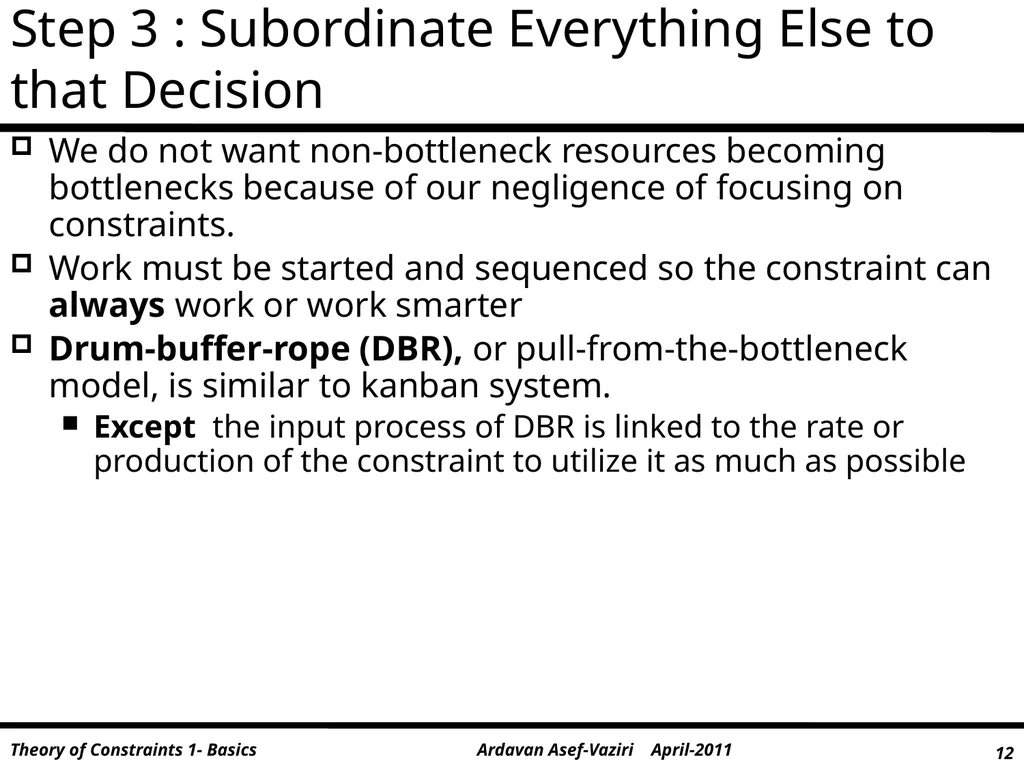
slide12. Step 3 : Subordinate Everything Else to that Decision We do not want non-bottleneck resources becoming bottlenecks because of our negligence of focusing on constraints.
Work must be started and sequenced so the constraint can always work or work smarter
Drum-buffer-rope (DBR), or pull-from-the-bottleneck model, is similar to kanban system.
Except the input process of DBR is linked to the rate or production of the constraint to utilize it as much as possible<br>
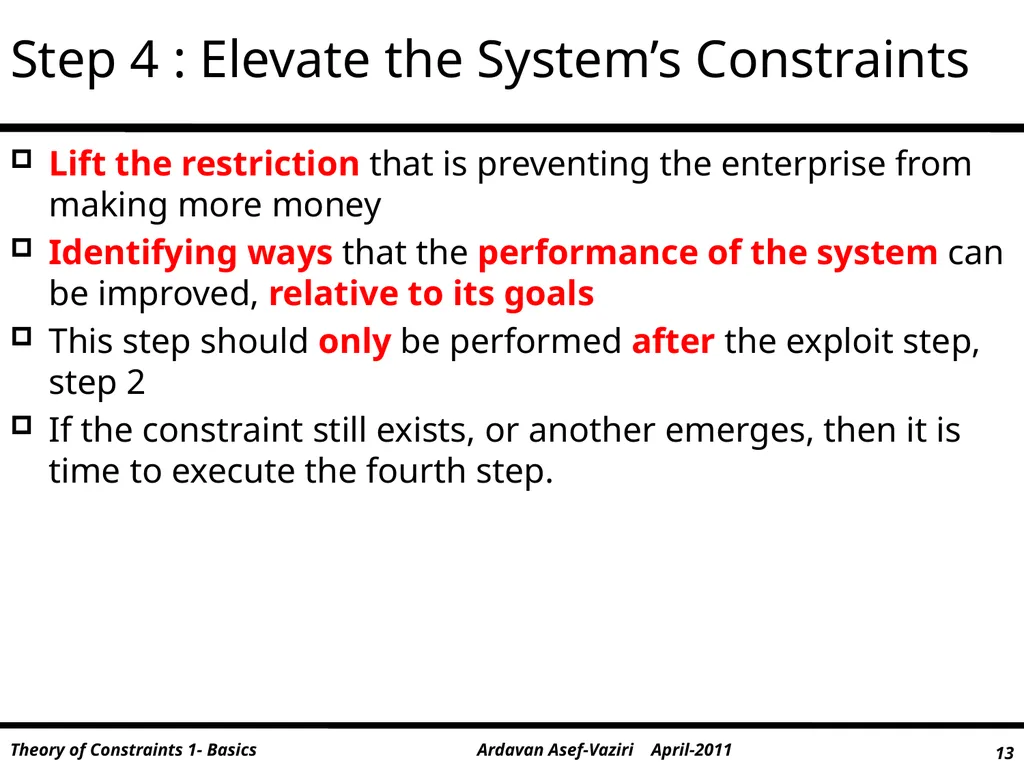
slide13. Step 4 : Elevate the System’s Constraints Lift the restriction that is preventing the enterprise from making more money
Identifying ways that the performance of the system can be improved, relative to its goals
This step should only be performed after the exploit step, step 2
If the constraint still exists, or another emerges, then it is time to execute the fourth step.<br>
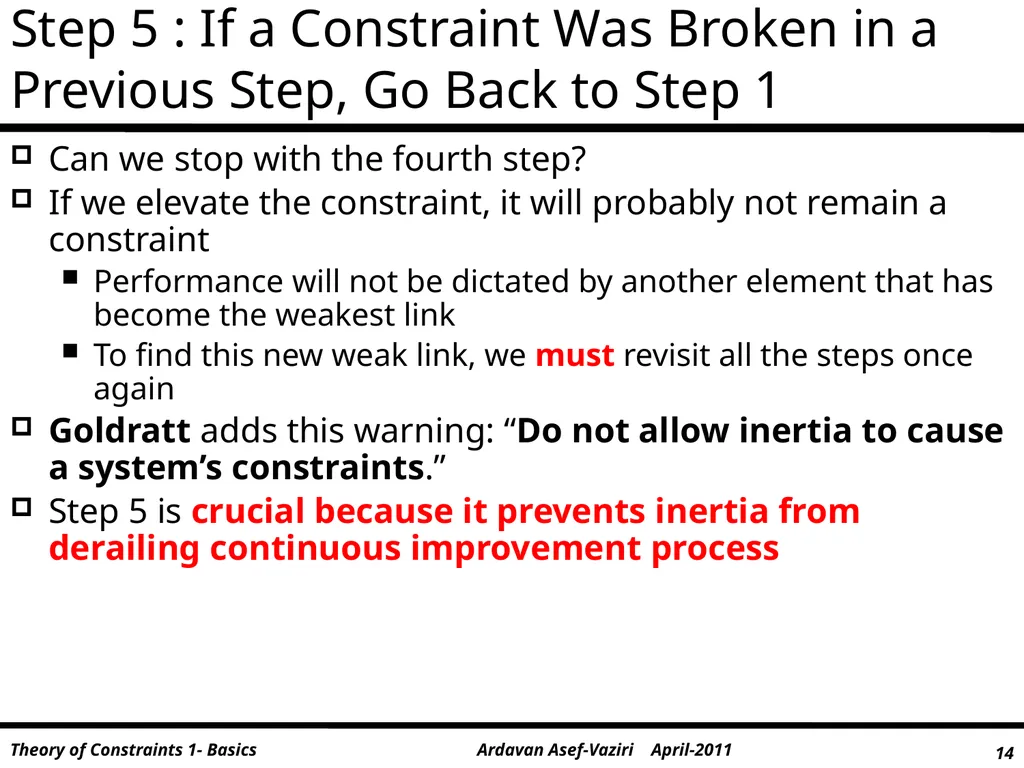
slide14. Step 5 : If a Constraint Was Broken in a Previous Step, Go Back to Step 1 Can we stop with the fourth step?
If we elevate the constraint, it will probably not remain a constraint
Performance will not be dictated by another element that has become the weakest link
To find this new weak link, we must revisit all the steps once again
Goldratt adds this warning: “Do not allow inertia to cause a system’s constraints.”
Step 5 is crucial because it prevents inertia from derailing continuous improvement process<br>
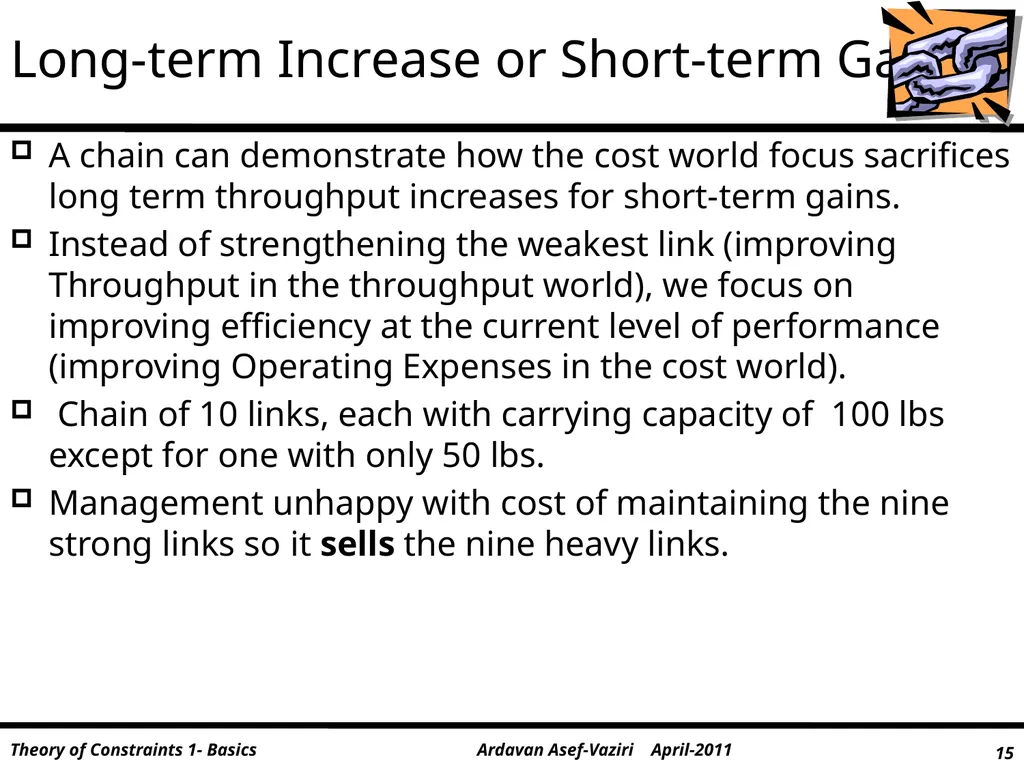
slide15. Long-term Increase or Short-term Gain? A chain can demonstrate how the cost world focus sacrifices long term throughput increases for short-term gains.
Instead of strengthening the weakest link (improving Throughput in the throughput world), we focus on improving efficiency at the current level of performance (improving Operating Expenses in the cost world).
Chain of 10 links, each with carrying capacity of 100 lbs except for one with only 50 lbs.
Management unhappy with cost of maintaining the nine strong links so it sells the nine heavy links.<br>
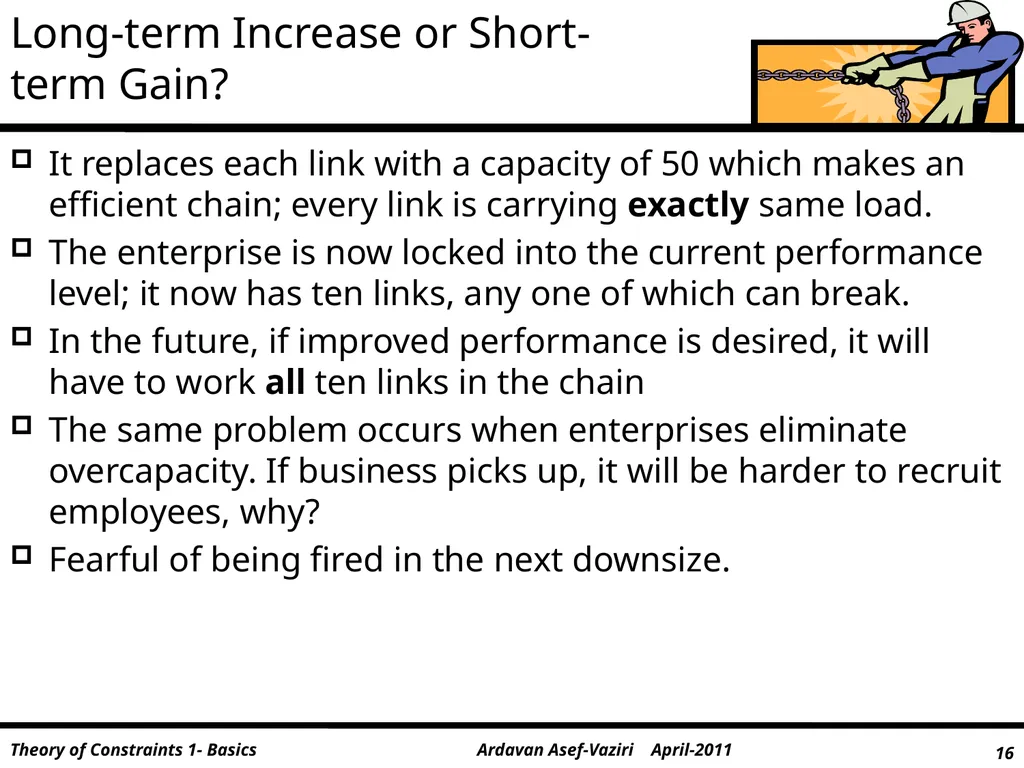
slide16. Long-term Increase or Short-term Gain? It replaces each link with a capacity of 50 which makes an efficient chain; every link is carrying exactly same load.
The enterprise is now locked into the current performance level; it now has ten links, any one of which can break.
In the future, if improved performance is desired, it will have to work all ten links in the chain
The same problem occurs when enterprises eliminate overcapacity. If business picks up, it will be harder to recruit employees, why?
Fearful of being fired in the next downsize.<br>
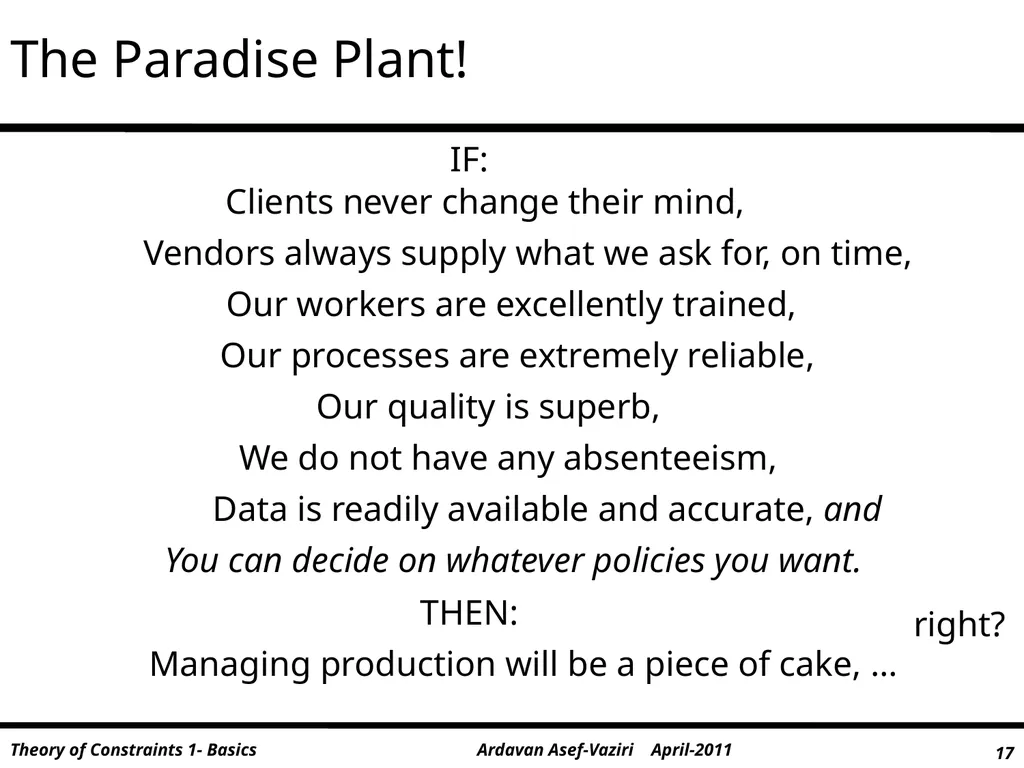
slide17. IF: Clients never change their mind, Vendors always supply what we ask for, on time, We do not have any absenteeism, Our workers are excellently trained, Our processes are extremely reliable, Our quality is superb, Data is readily available and accurate, and Managing production will be a piece of cake, … THEN: You can decide on whatever policies you want. right? The Paradise Plant!<br>
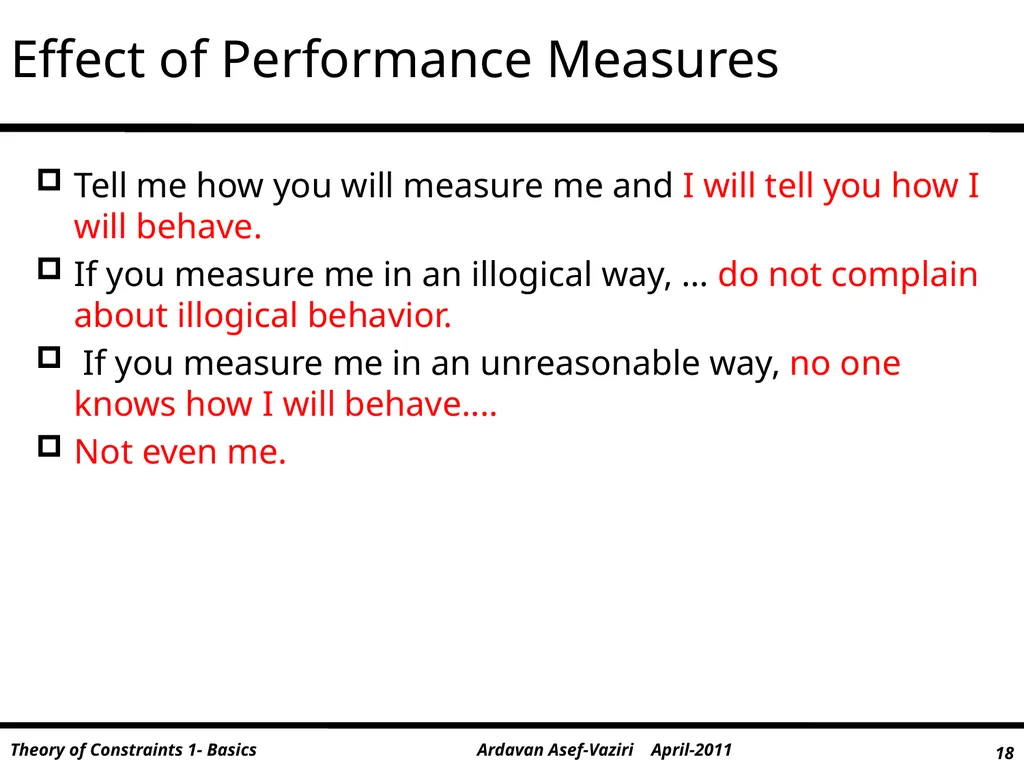
slide18. Tell me how you will measure me and I will tell you how I will behave.
If you measure me in an illogical way, … do not complain about illogical behavior.
If you measure me in an unreasonable way, no one knows how I will behave....
Not even me. Effect of Performance Measures<br>
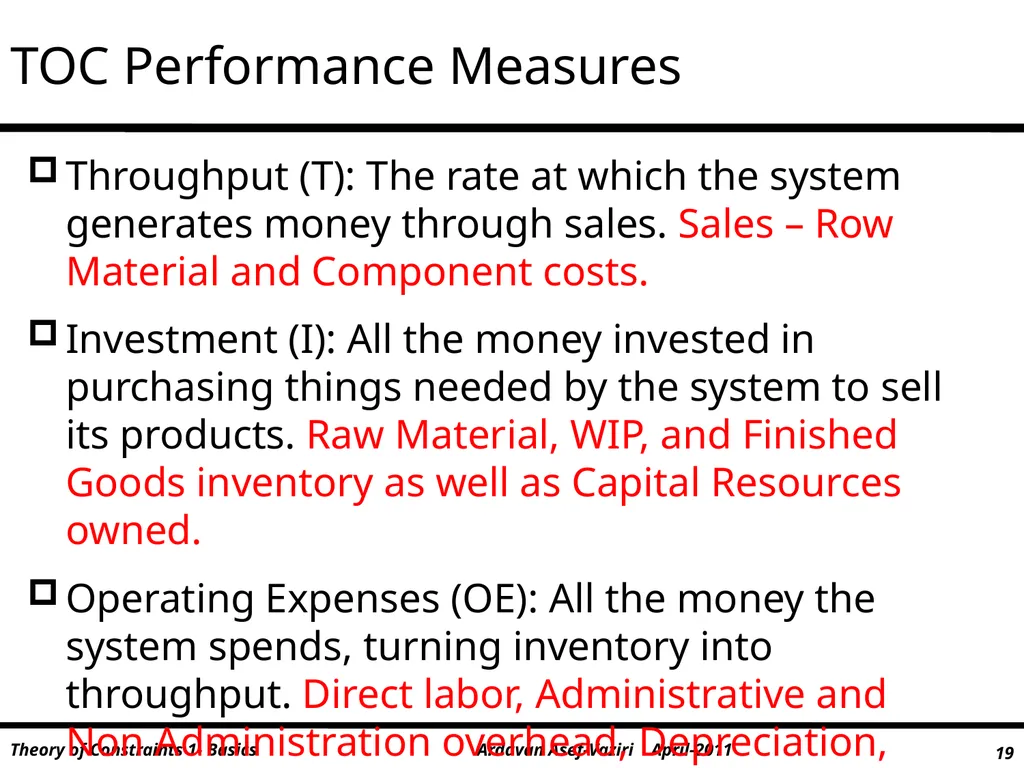
slide19. TOC Performance Measures Throughput (T): The rate at which the system generates money through sales. Sales – Row Material and Component costs.
Investment (I): All the money invested in purchasing things needed by the system to sell its products. Raw Material, WIP, and Finished Goods inventory as well as Capital Resources owned.
Operating Expenses (OE): All the money the system spends, turning inventory into throughput. Direct labor, Administrative and Non Administration overhead, Depreciation, Rent.<br>
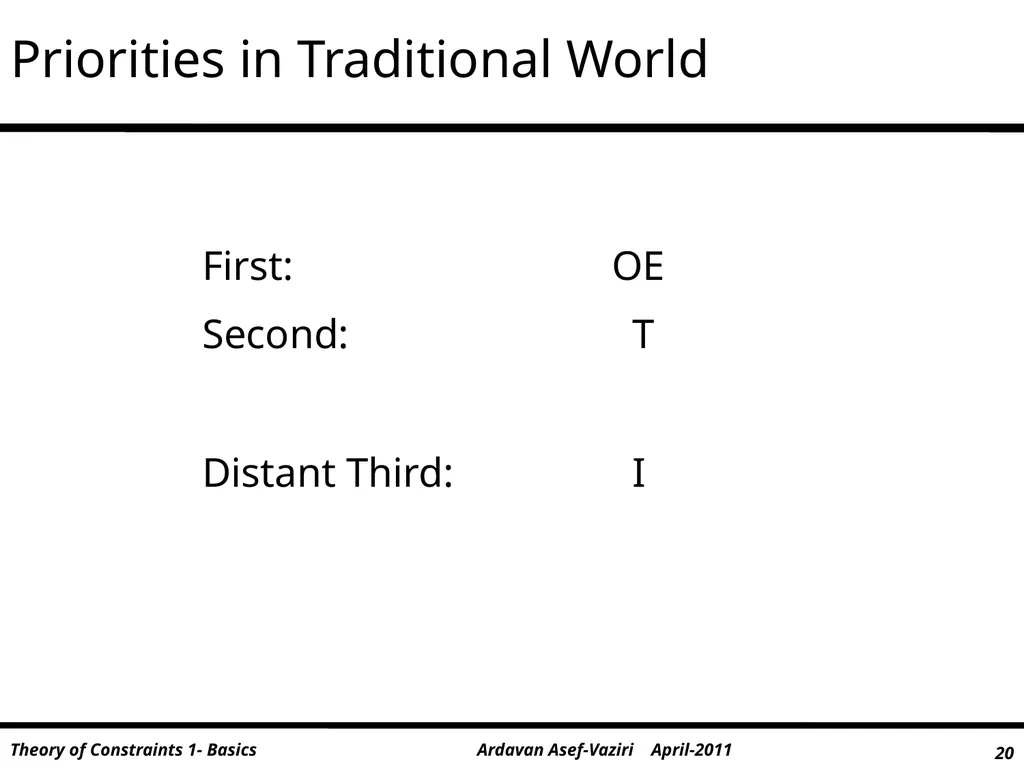
slide20. Priorities in Traditional World First: OE
Second: T
Distant Third: I<br>
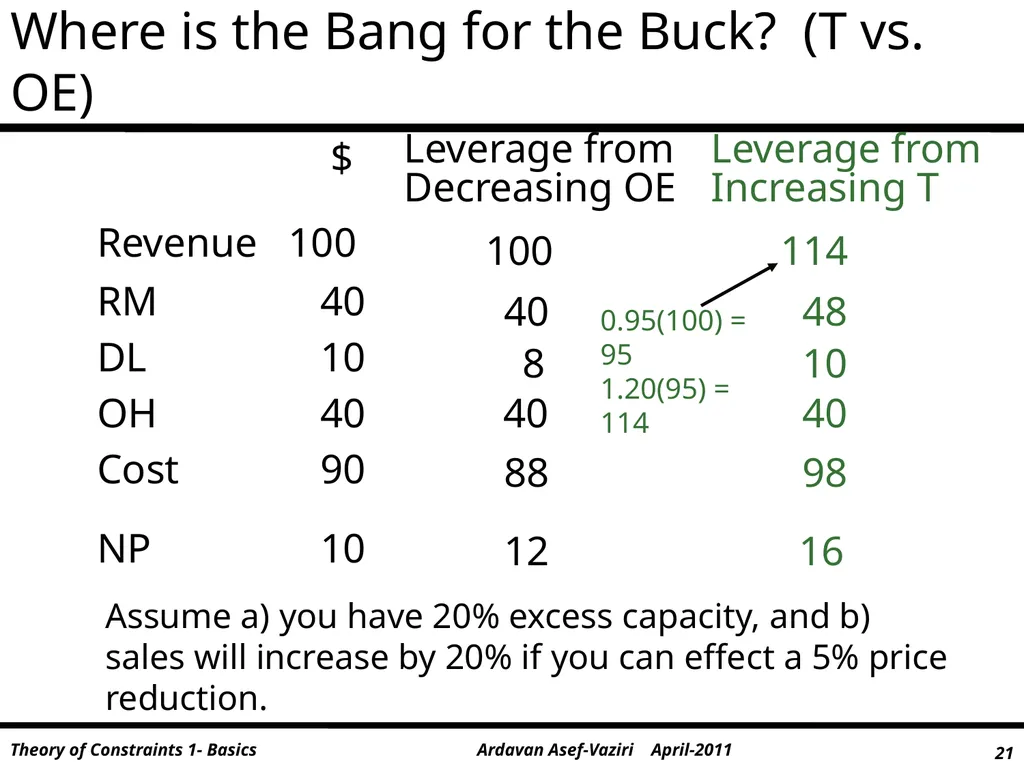
slide21. Where is the Bang for the Buck? (T vs. OE) $
Revenue 100
RM 40
DL 10
OH 40
Cost 90
NP 10 100 114 10 8 40 40 98 88 16 12 40 48 Leverage from
Decreasing OE Leverage from
Increasing T Assume a) you have 20% excess capacity, and b) sales will increase by 20% if you can effect a 5% price reduction. 0.95(100) = 95
1.20(95) = 114<br>
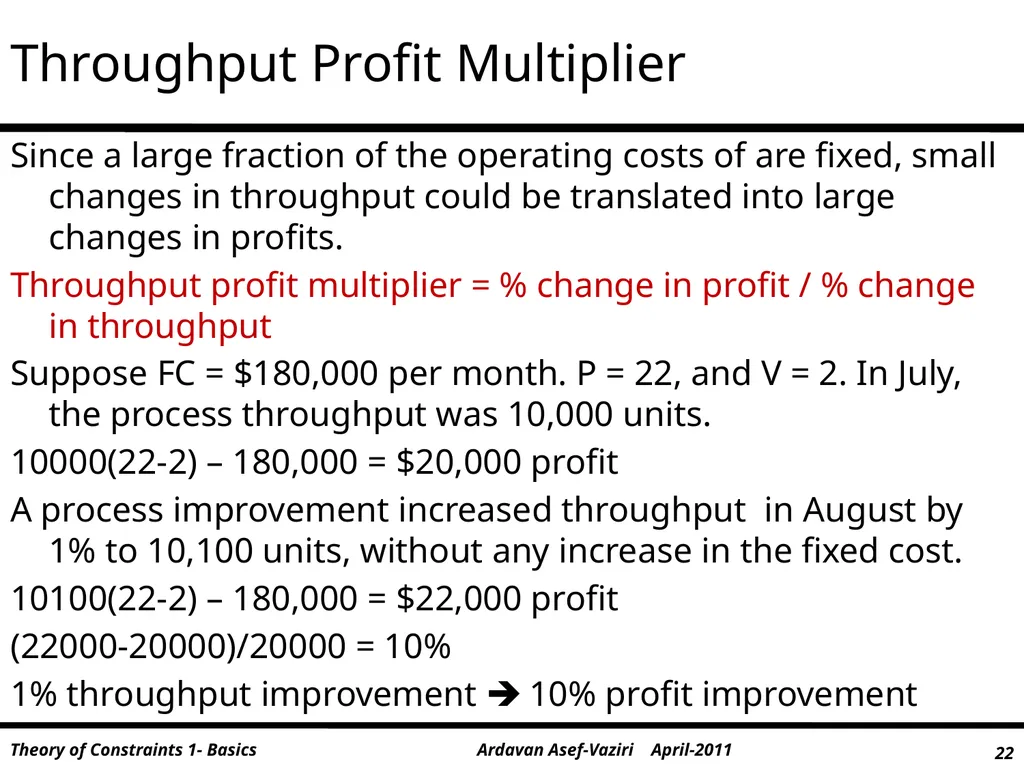
slide22. Throughput Profit Multiplier Since a large fraction of the operating costs of are fixed, small changes in throughput could be translated into large changes in profits.
Throughput profit multiplier = % change in profit / % change in throughput
Suppose FC = $180,000 per month. P = 22, and V = 2. In July, the process throughput was 10,000 units.
10000(22-2) – 180,000 = $20,000 profit
A process improvement increased throughput in August by 1% to 10,100 units, without any increase in the fixed cost.
10100(22-2) – 180,000 = $22,000 profit
(22000-20000)/20000 = 10%
1% throughput improvement 10% profit improvement<br>
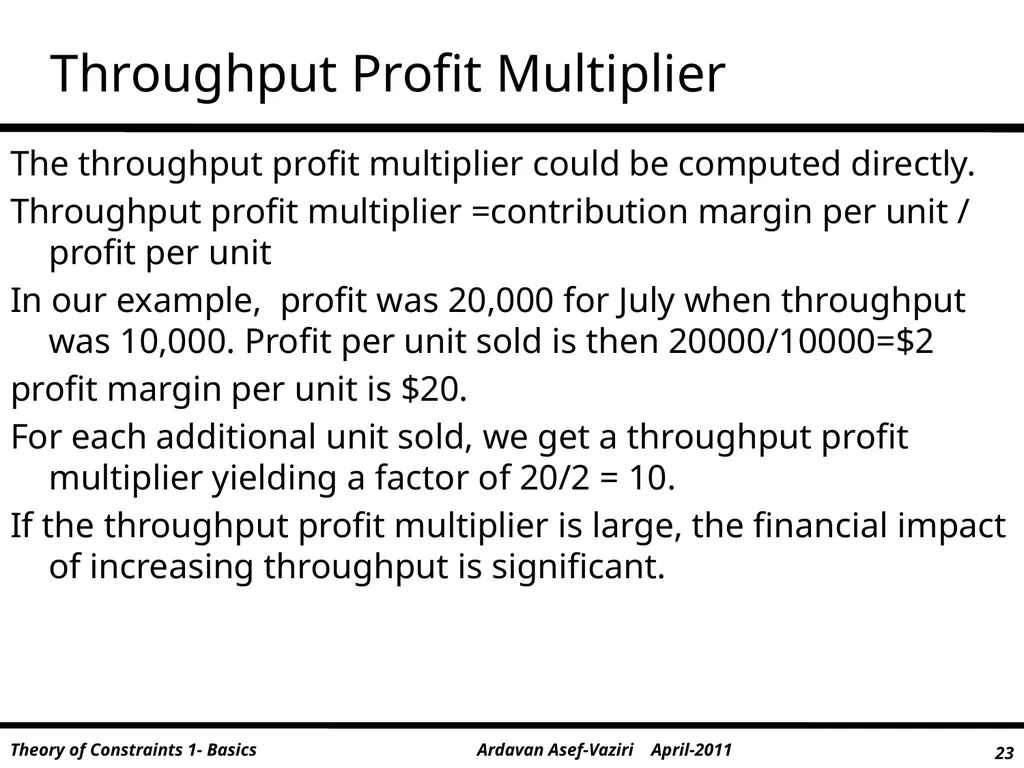
slide23. Throughput Profit Multiplier The throughput profit multiplier could be computed directly.
Throughput profit multiplier =contribution margin per unit / profit per unit
In our example, profit was 20,000 for July when throughput was 10,000. Profit per unit sold is then 20000/10000=$2
profit margin per unit is $20.
For each additional unit sold, we get a throughput profit multiplier yielding a factor of 20/2 = 10.
If the throughput profit multiplier is large, the financial impact of increasing throughput is significant.<br>
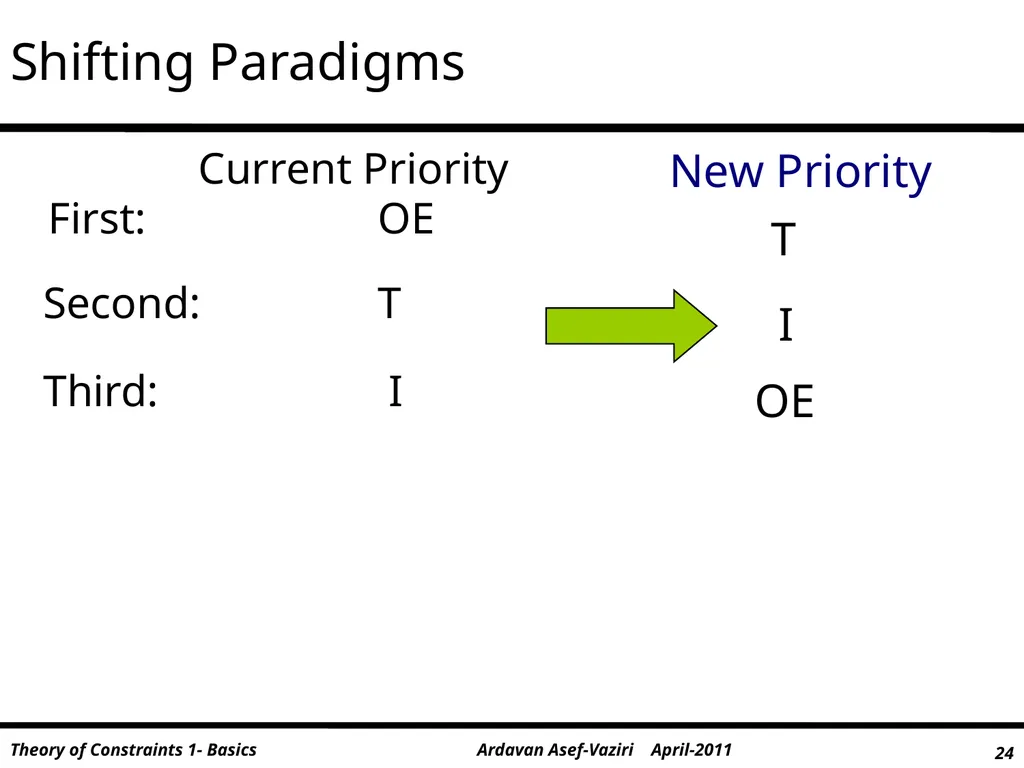
slide24. Shifting Paradigms Current Priority
First: OE
Second: T
Third: I T I OE New Priority<br>
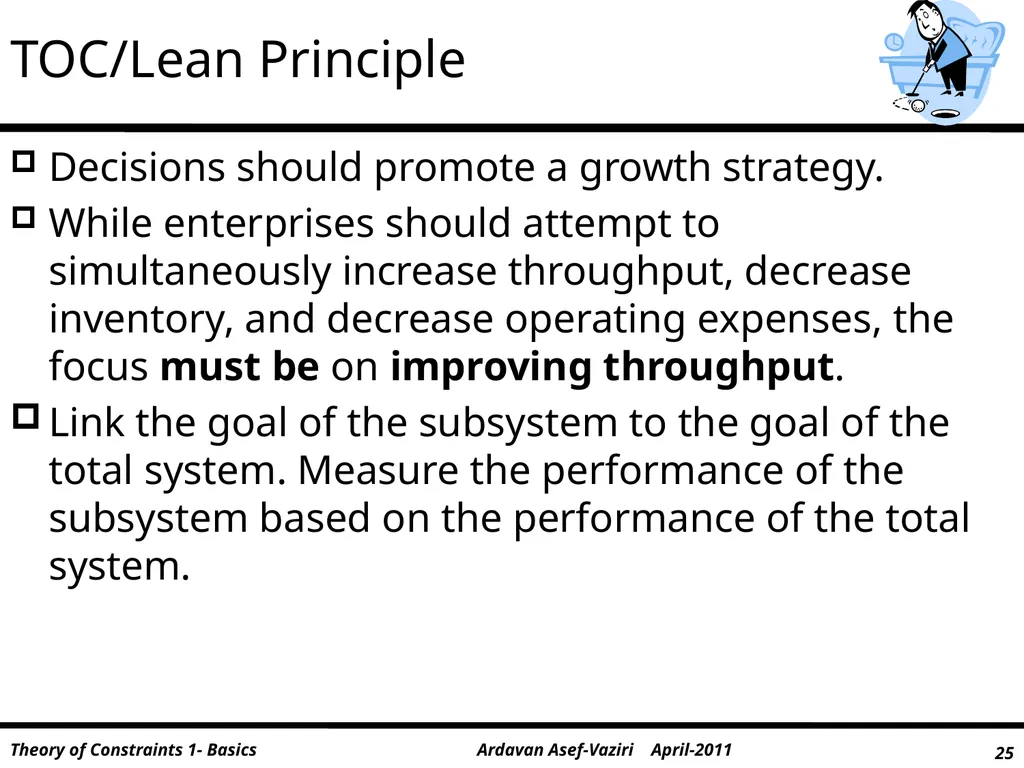
slide25. TOC/Lean Principle Decisions should promote a growth strategy.
While enterprises should attempt to simultaneously increase throughput, decrease inventory, and decrease operating expenses, the focus must be on improving throughput.
Link the goal of the subsystem to the goal of the total system. Measure the performance of the subsystem based on the performance of the total system.<br>
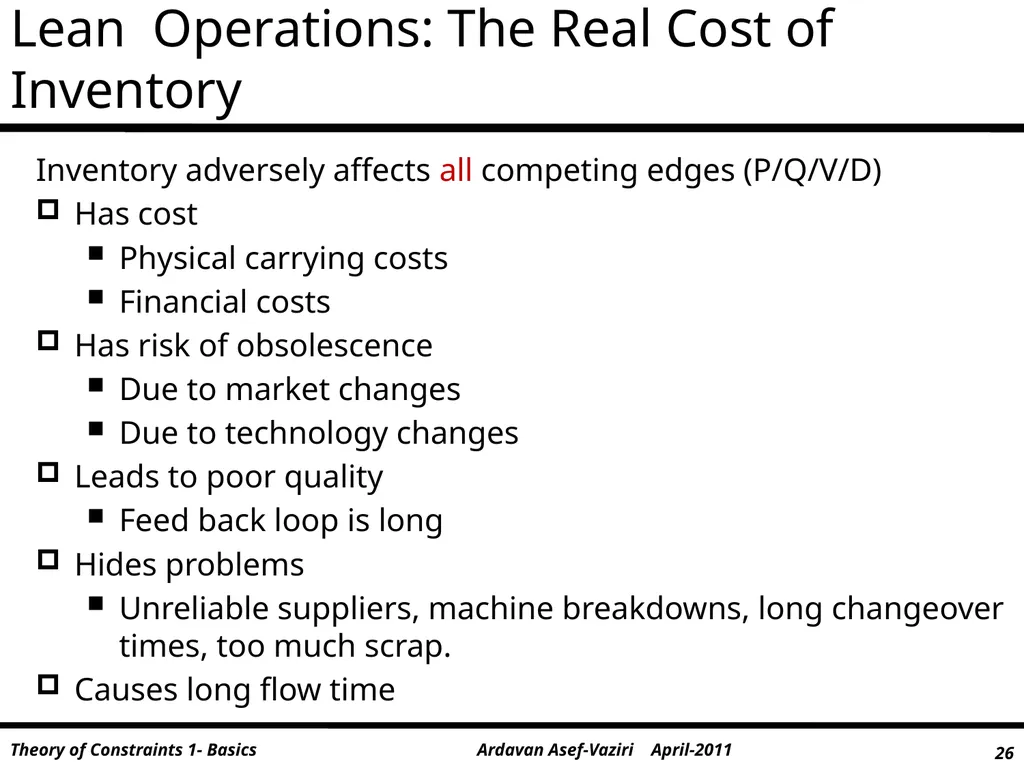
slide26. Inventory adversely affects all competing edges (P/Q/V/D)
Has cost
Physical carrying costs
Financial costs
Has risk of obsolescence
Due to market changes
Due to technology changes
Leads to poor quality
Feed back loop is long
Hides problems
Unreliable suppliers, machine breakdowns, long changeover times, too much scrap.
Causes long flow time Lean Operations: The Real Cost of Inventory<br>
1. The book Streamlined: 14 Principles for Building and Managing the Lean Supply Chain. 2004. Srinivasan. TOMPSON ISBN: 978-0-324-23277-6.
2. The slides originally prepared by Professor M. M. Srinivasan.
3. Operations Management. Jacobs and Chase. McGraw-Hill. Complex solutions do not work,
the more complex the problem
the simpler the solution must be.
Eli Goldratt.<br>
slide2. TOC owes its origin to Eliahu Goldratt, an Israeli physicist. The basic idea was published in his book; The Goal (1984).
TOC Premise 1: The Goal of a business is to make more money, … in the present and in the future Max NPV.
Just like the links of a chain, the processes within the enterprise work together to generate profit for the stakeholders.
The chain is only as strong as its weakest link.
TOC Premise 2: There is one or at most few constraint(s) determine its output. Theory of Constraints (TOC)<br>
slide3. Systems Thinking and TOC Focus on maximizing the productive use of the bottleneck. Schedule it to maximize throughput. The other resources can be schedule subsequently since they have available capacity by definition.
Principle: Time lost at a bottleneck resource results in a loss of throughput for the whole enterprise. Time saved a non-bottleneck resources is a mirage.
The traditional management lives in a cost world; minimizing costs and improving efficiencies. A complex system is broken down into smaller parts; cost or profit centers with local targets. Cost or profit centers achieve/beat targets; if every unit improved locally then the entire enterprise would improve globally. Managers in cost world think locally.<br>
slide4. Cost World – Local Optimization To improve performance of the total system, it is not enough to improve performance of the isolated functions; it is Local Optimization, it ignores the interactions between the various functions. Cost world thinks locally. The throughput world thinks globally.
An increase in the cost of an engine of $30 would have decreased the cost of the transmission by $80. The center producing the engine is reluctant to do so.<br>
slide5. Systems Approach The story of the blind men and an elephant originated in India, where it was widely disseminated. Rumi, the 13th Century Persian poet and teacher of Sufism, included it in his retelling, "The Elephant in the Dark," uses this story as an example of the limits of individual perception.
Some Hindus had brought an elephant for exhibition and placed it in a dark house. Crowds of people were going into that dark place to see the beast. Finding that ocular inspection was impossible, each visitor felt it with his palm in the darkness.
The palm of one fell on the trunk. This creature is like a water-spout, he said.
The hand of another rested on the elephant’s ear. To him the beast was evidently like a fan.<br>
slide6. Systems Approach Another rubbed against its leg. “I found the elephant’s shape is like a pillar,” he said.
Another laid his hand on its back. Certainly this elephant was like a throne, he said.
Rumi ends his poem by stating; if each had a candle and they went in together the differences would disappear.
Jalaluddin Rumi is not only the teacher of Sufism, but among other things, the messenger of system-thinking.<br>
slide7. The 5 Step TOC Focusing Process Step 1: Identify the System’s Constraint(s)
Step 2: Decide how to Exploit the System’s Constraints
Step 3: Subordinate Everything Else to that Decision
Step 4: Elevate the System’s Constraints
Step 5: If a Constraint Was Broken in previous Steps, Go to Step 1 Performance of subsystems to be linked to the performance of the total system. The 5-Steps in a continuing Process.<br>
slide8. Step 1: Identify the Constraint(s) Physical Constraints. Tangible; easy to recognize as constraint. H/C/F Resources. Machine capacity, material, space, cash availability.
Eliminate idle time, reduce setup time and run time, Improve quality control, buy more capacity.
First Focus on where you have more WIP.<br>
slide9. Market Constraints Demand for company’s products and services is less than capacity, or not in desired proportion.
Harder to identify than physical constraints.
Excess capacity is easily identified as a market constraint.
Make an offer the customer cannot refuse! P > V<br>
slide10. Policy Constraints Methods Constraints. Never producing a batch of units below an EOQ; producing products for which there is no current demand. A flawed method of absorption costing that adds value to a product as it moves through a series of process steps.
Measures Constraints. Buying large quantities for quantity discounts. Paying sales commission based on volume of sale. Rewarding managers if they utilize their resources to produce more output because a higher output better absorbs labor and overhead. Tell me how you measure me and I will tell you how I behave.
Mindset Constraints. Shop supervisor believes operators should be busy all of the time. The enterprise can become profitable through outsourcing. You don't understand, we are different, that won't work here!<br>
slide11. Step 2 : Decide How to Exploit the System’s Constraint(s) Exploiting the constraint means using the constraint as profitably as possible
Until the constraints are overcome by other means, the enterprise should work them as profitably (effectively) as possible.
The real meaning of the word exploit?
If constraint is physical resource, ensure the resource is never idle.
If the market is the constraint, exploit by ensuring not a single sale is lost as a result of our action or inaction.
Market constraint implies extra capacity, so we exploit this by guaranteeing 100% on time delivery to customer.<br>
slide12. Step 3 : Subordinate Everything Else to that Decision We do not want non-bottleneck resources becoming bottlenecks because of our negligence of focusing on constraints.
Work must be started and sequenced so the constraint can always work or work smarter
Drum-buffer-rope (DBR), or pull-from-the-bottleneck model, is similar to kanban system.
Except the input process of DBR is linked to the rate or production of the constraint to utilize it as much as possible<br>
slide13. Step 4 : Elevate the System’s Constraints Lift the restriction that is preventing the enterprise from making more money
Identifying ways that the performance of the system can be improved, relative to its goals
This step should only be performed after the exploit step, step 2
If the constraint still exists, or another emerges, then it is time to execute the fourth step.<br>
slide14. Step 5 : If a Constraint Was Broken in a Previous Step, Go Back to Step 1 Can we stop with the fourth step?
If we elevate the constraint, it will probably not remain a constraint
Performance will not be dictated by another element that has become the weakest link
To find this new weak link, we must revisit all the steps once again
Goldratt adds this warning: “Do not allow inertia to cause a system’s constraints.”
Step 5 is crucial because it prevents inertia from derailing continuous improvement process<br>
slide15. Long-term Increase or Short-term Gain? A chain can demonstrate how the cost world focus sacrifices long term throughput increases for short-term gains.
Instead of strengthening the weakest link (improving Throughput in the throughput world), we focus on improving efficiency at the current level of performance (improving Operating Expenses in the cost world).
Chain of 10 links, each with carrying capacity of 100 lbs except for one with only 50 lbs.
Management unhappy with cost of maintaining the nine strong links so it sells the nine heavy links.<br>
slide16. Long-term Increase or Short-term Gain? It replaces each link with a capacity of 50 which makes an efficient chain; every link is carrying exactly same load.
The enterprise is now locked into the current performance level; it now has ten links, any one of which can break.
In the future, if improved performance is desired, it will have to work all ten links in the chain
The same problem occurs when enterprises eliminate overcapacity. If business picks up, it will be harder to recruit employees, why?
Fearful of being fired in the next downsize.<br>
slide17. IF: Clients never change their mind, Vendors always supply what we ask for, on time, We do not have any absenteeism, Our workers are excellently trained, Our processes are extremely reliable, Our quality is superb, Data is readily available and accurate, and Managing production will be a piece of cake, … THEN: You can decide on whatever policies you want. right? The Paradise Plant!<br>
slide18. Tell me how you will measure me and I will tell you how I will behave.
If you measure me in an illogical way, … do not complain about illogical behavior.
If you measure me in an unreasonable way, no one knows how I will behave....
Not even me. Effect of Performance Measures<br>
slide19. TOC Performance Measures Throughput (T): The rate at which the system generates money through sales. Sales – Row Material and Component costs.
Investment (I): All the money invested in purchasing things needed by the system to sell its products. Raw Material, WIP, and Finished Goods inventory as well as Capital Resources owned.
Operating Expenses (OE): All the money the system spends, turning inventory into throughput. Direct labor, Administrative and Non Administration overhead, Depreciation, Rent.<br>
slide20. Priorities in Traditional World First: OE
Second: T
Distant Third: I<br>
slide21. Where is the Bang for the Buck? (T vs. OE) $
Revenue 100
RM 40
DL 10
OH 40
Cost 90
NP 10 100 114 10 8 40 40 98 88 16 12 40 48 Leverage from
Decreasing OE Leverage from
Increasing T Assume a) you have 20% excess capacity, and b) sales will increase by 20% if you can effect a 5% price reduction. 0.95(100) = 95
1.20(95) = 114<br>
slide22. Throughput Profit Multiplier Since a large fraction of the operating costs of are fixed, small changes in throughput could be translated into large changes in profits.
Throughput profit multiplier = % change in profit / % change in throughput
Suppose FC = $180,000 per month. P = 22, and V = 2. In July, the process throughput was 10,000 units.
10000(22-2) – 180,000 = $20,000 profit
A process improvement increased throughput in August by 1% to 10,100 units, without any increase in the fixed cost.
10100(22-2) – 180,000 = $22,000 profit
(22000-20000)/20000 = 10%
1% throughput improvement 10% profit improvement<br>
slide23. Throughput Profit Multiplier The throughput profit multiplier could be computed directly.
Throughput profit multiplier =contribution margin per unit / profit per unit
In our example, profit was 20,000 for July when throughput was 10,000. Profit per unit sold is then 20000/10000=$2
profit margin per unit is $20.
For each additional unit sold, we get a throughput profit multiplier yielding a factor of 20/2 = 10.
If the throughput profit multiplier is large, the financial impact of increasing throughput is significant.<br>
slide24. Shifting Paradigms Current Priority
First: OE
Second: T
Third: I T I OE New Priority<br>
slide25. TOC/Lean Principle Decisions should promote a growth strategy.
While enterprises should attempt to simultaneously increase throughput, decrease inventory, and decrease operating expenses, the focus must be on improving throughput.
Link the goal of the subsystem to the goal of the total system. Measure the performance of the subsystem based on the performance of the total system.<br>
slide26. Inventory adversely affects all competing edges (P/Q/V/D)
Has cost
Physical carrying costs
Financial costs
Has risk of obsolescence
Due to market changes
Due to technology changes
Leads to poor quality
Feed back loop is long
Hides problems
Unreliable suppliers, machine breakdowns, long changeover times, too much scrap.
Causes long flow time Lean Operations: The Real Cost of Inventory<br>