Topic 3: Meteorology and data filtering Issues How to treat meteorology: Should we do meteorological trend adjustment? If seasonality is changing, how to reflect it in trend analysis? Data filtering for trend analysis (selection of
"Topic 3: Meteorology and data filtering Issues How" is the property of its rightful owner. Permission is granted to
download and print the materials on this website for personal, non-commercial use only, and to display it
on your personal computer provided you do not modify the materials and that you retain all copyright
notices contained in the materials. By downloading content from our website, you accept the terms of this
agreement.
Presentation Transcript
01
Topic 3: Meteorology and data filtering<br>
02
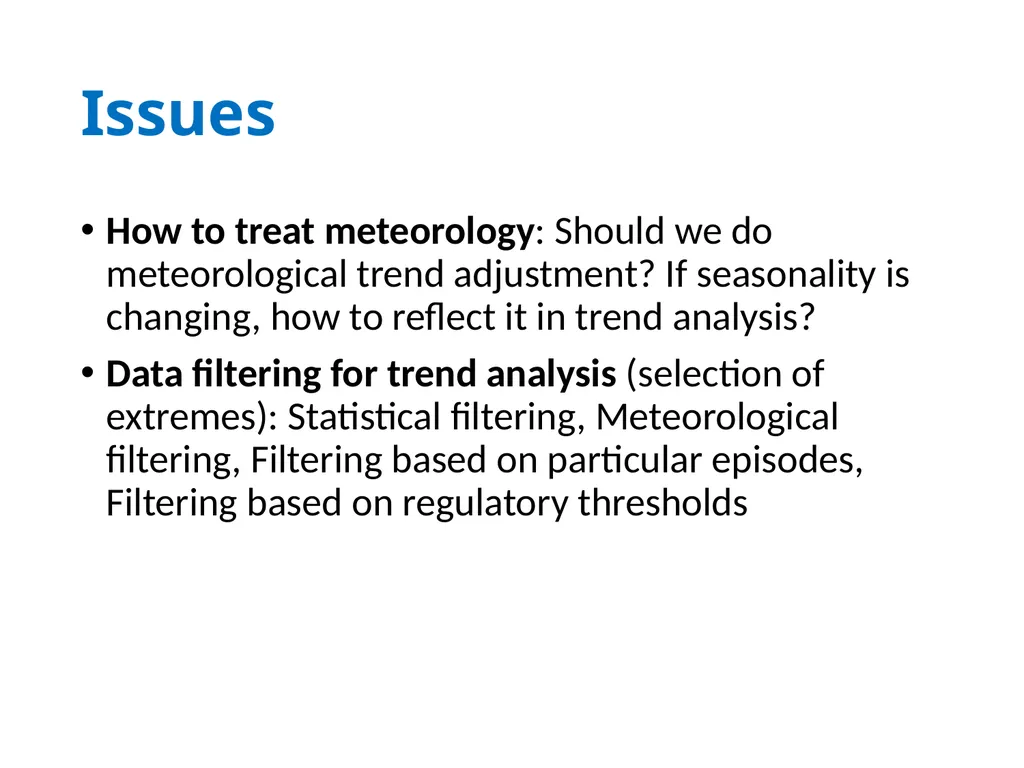
Issues How to treat meteorology: Should we do meteorological trend adjustment? If seasonality is changing, how to reflect it in trend analysis?
Data filtering for trend analysis (selection of extremes): Statistical filtering, Meteorological filtering, Filtering based on particular episodes, Filtering based on regulatory thresholds<br>
03
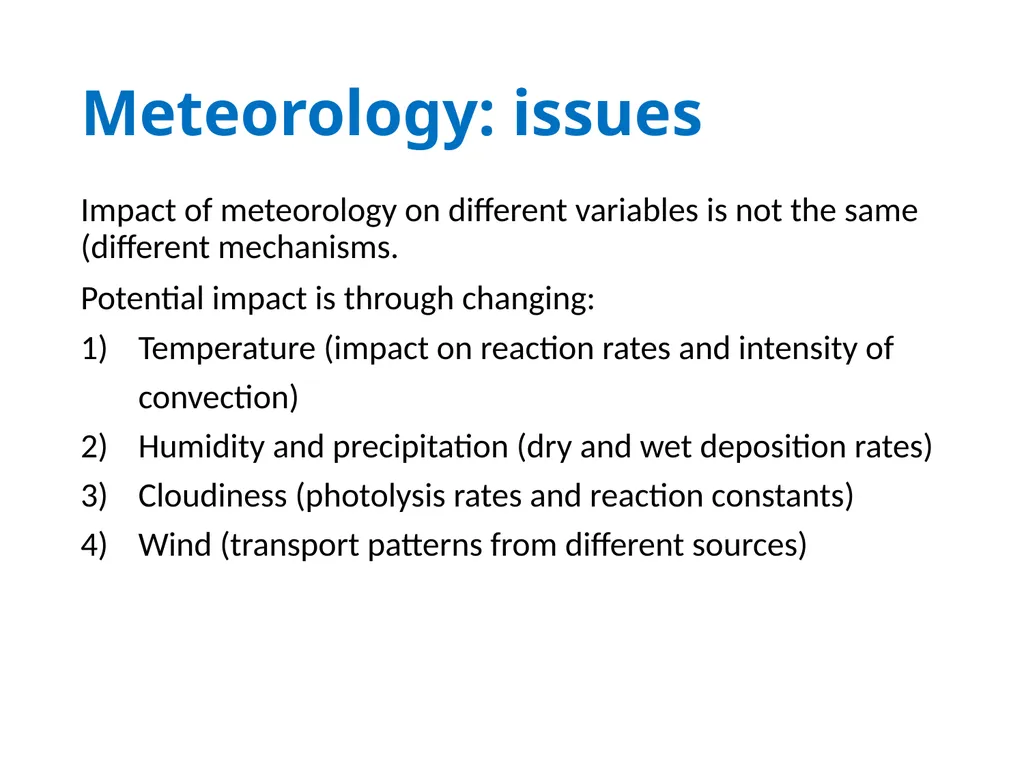
Meteorology: issues Impact of meteorology on different variables is not the same (different mechanisms.
Potential impact is through changing:
Temperature (impact on reaction rates and intensity of convection)
Humidity and precipitation (dry and wet deposition rates)
Cloudiness (photolysis rates and reaction constants)
Wind (transport patterns from different sources)<br>
04
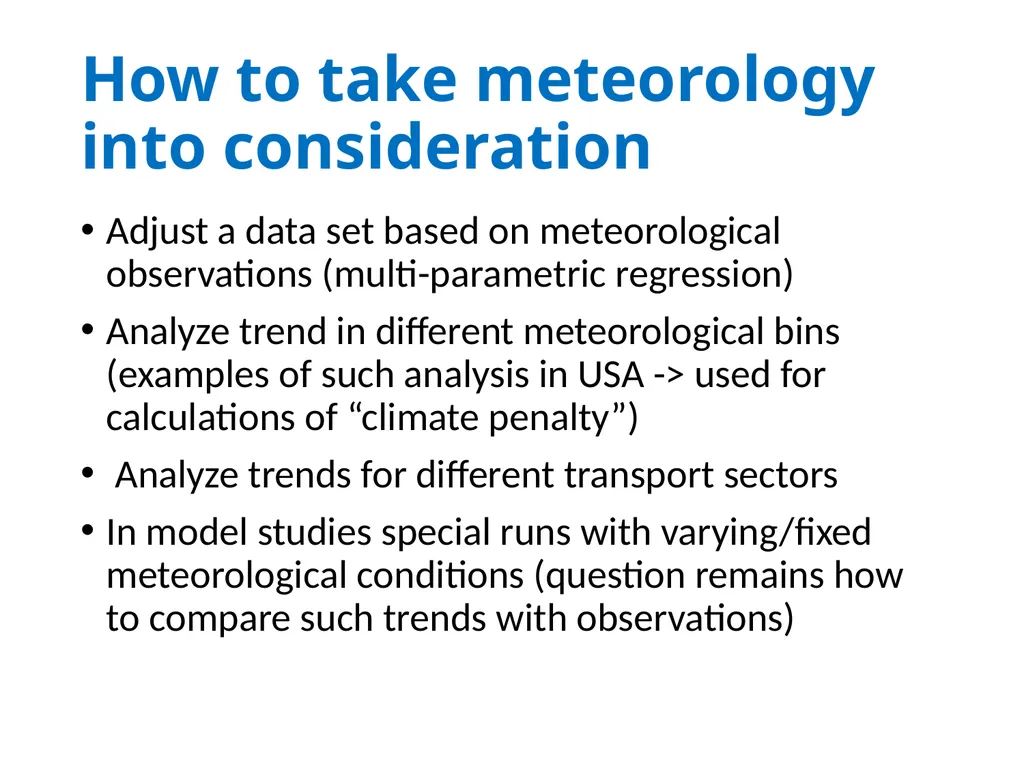
How to take meteorology into consideration Adjust a data set based on meteorological observations (multi-parametric regression)
Analyze trend in different meteorological bins (examples of such analysis in USA -> used for calculations of “climate penalty”)
Analyze trends for different transport sectors
In model studies special runs with varying/fixed meteorological conditions (question remains how to compare such trends with observations)<br>
05
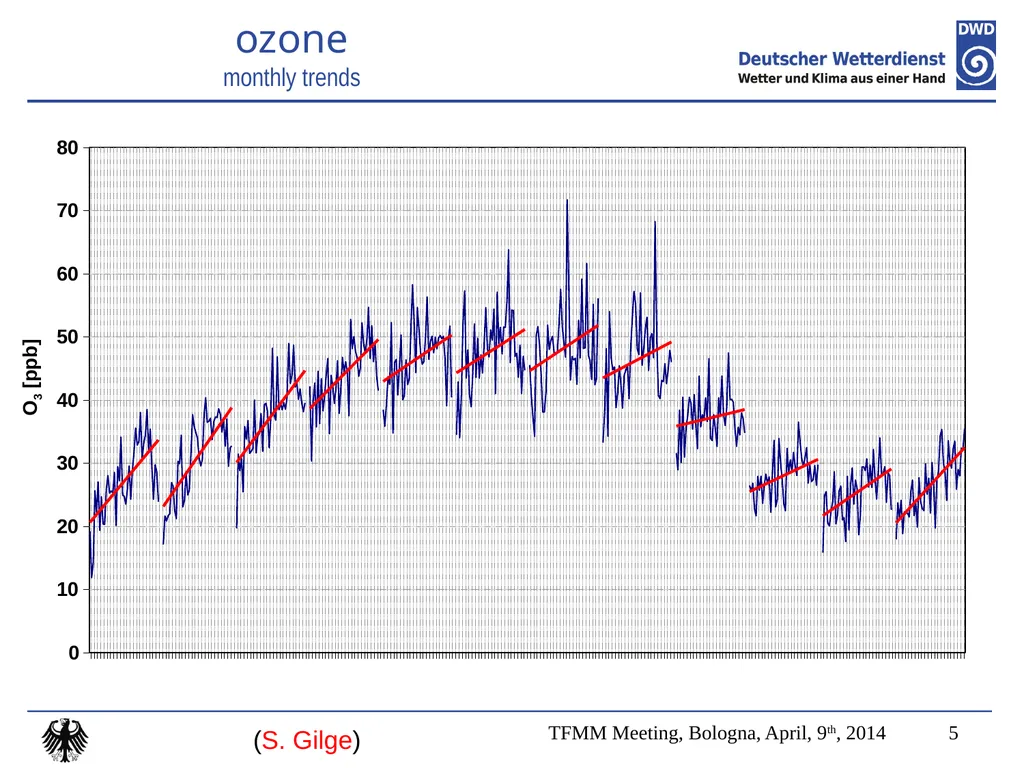
ozone
monthly trends O3 [ppb] TFMM Meeting, Bologna, April, 9th, 2014 5 (S. Gilge)<br>
06
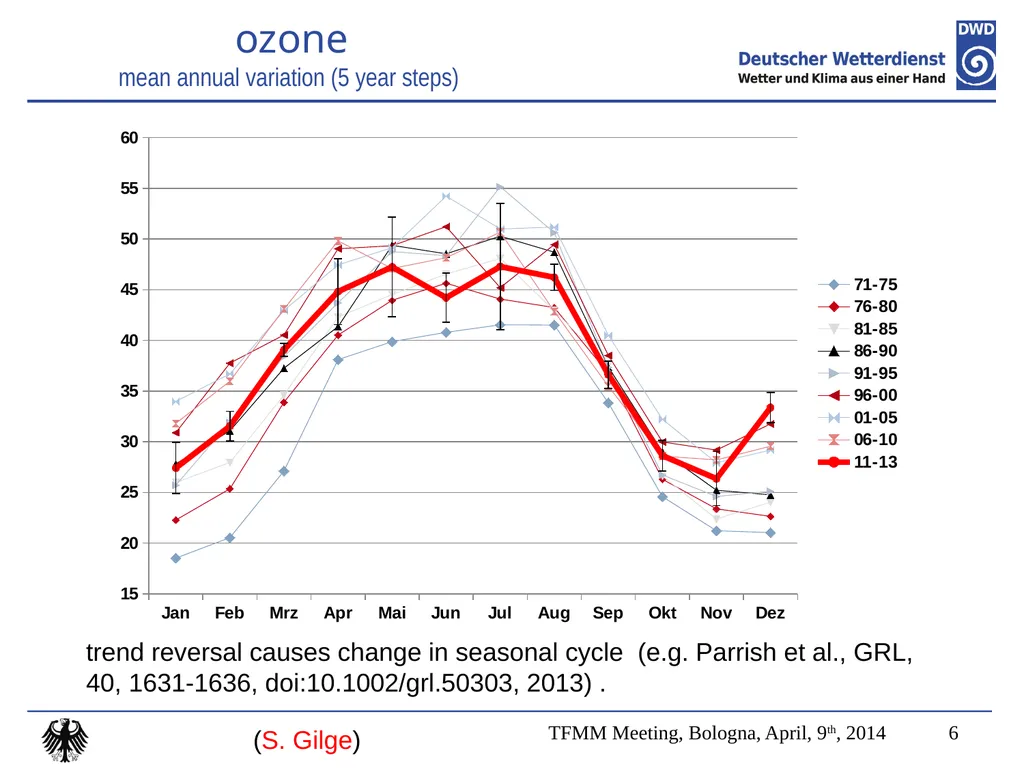
ozone
mean annual variation (5 year steps) TFMM Meeting, Bologna, April, 9th, 2014 6 (S. Gilge) trend reversal causes change in seasonal cycle (e.g. Parrish et al., GRL, 40, 1631-1636, doi:10.1002/grl.50303, 2013) .<br>
07
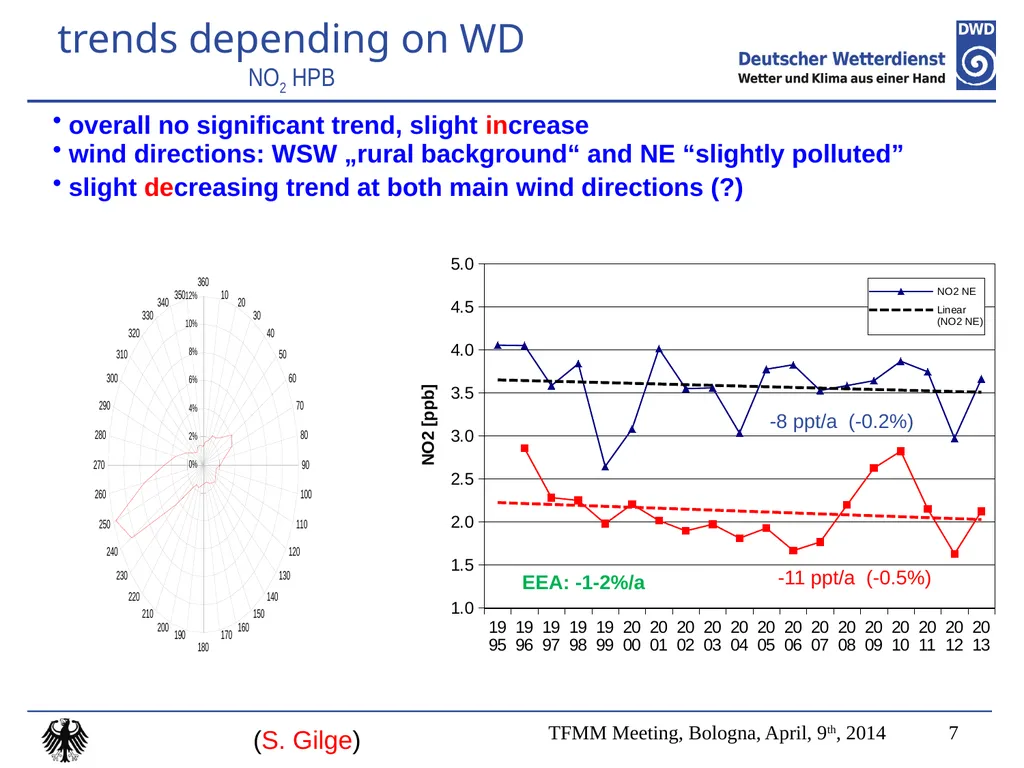
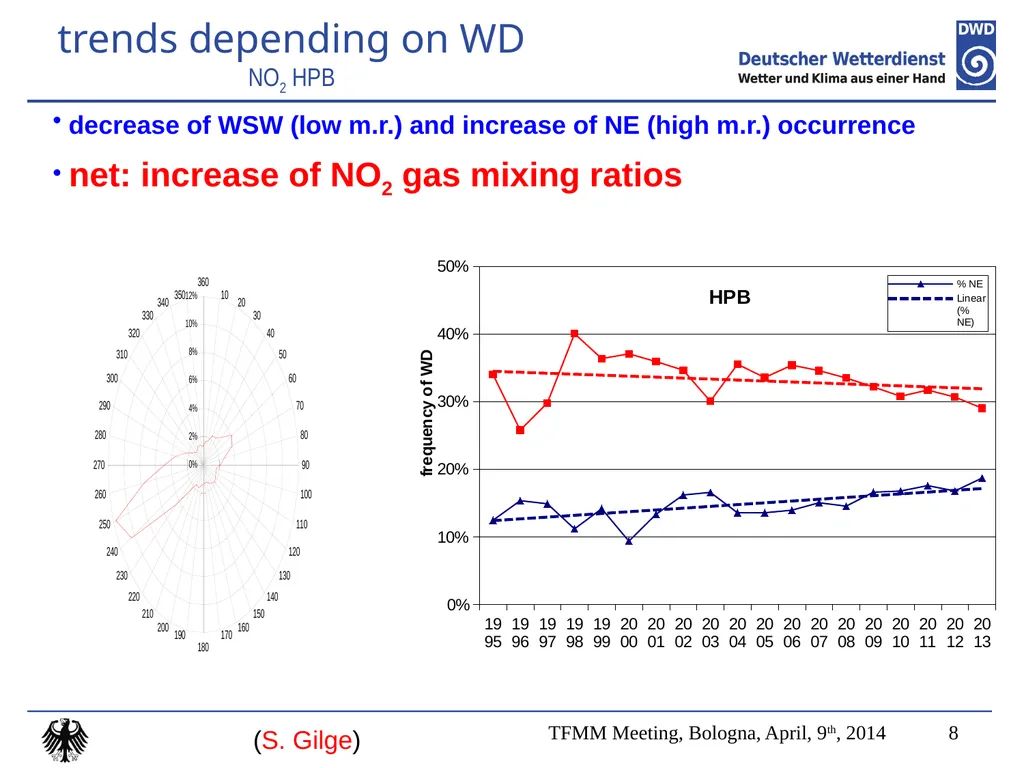
overall no significant trend, slight increase wind directions: WSW „rural background“ and NE “slightly polluted” slight decreasing trend at both main wind directions (?) trends depending on WD
NO2 HPB -11 ppt/a (-0.5%) -8 ppt/a (-0.2%) TFMM Meeting, Bologna, April, 9th, 2014 7 EEA: -1-2%/a (S. Gilge)<br>
08
decrease of WSW (low m.r.) and increase of NE (high m.r.) occurrence net: increase of NO2 gas mixing ratios trends depending on WD
NO2 HPB TFMM Meeting, Bologna, April, 9th, 2014 8 (S. Gilge)<br>
09
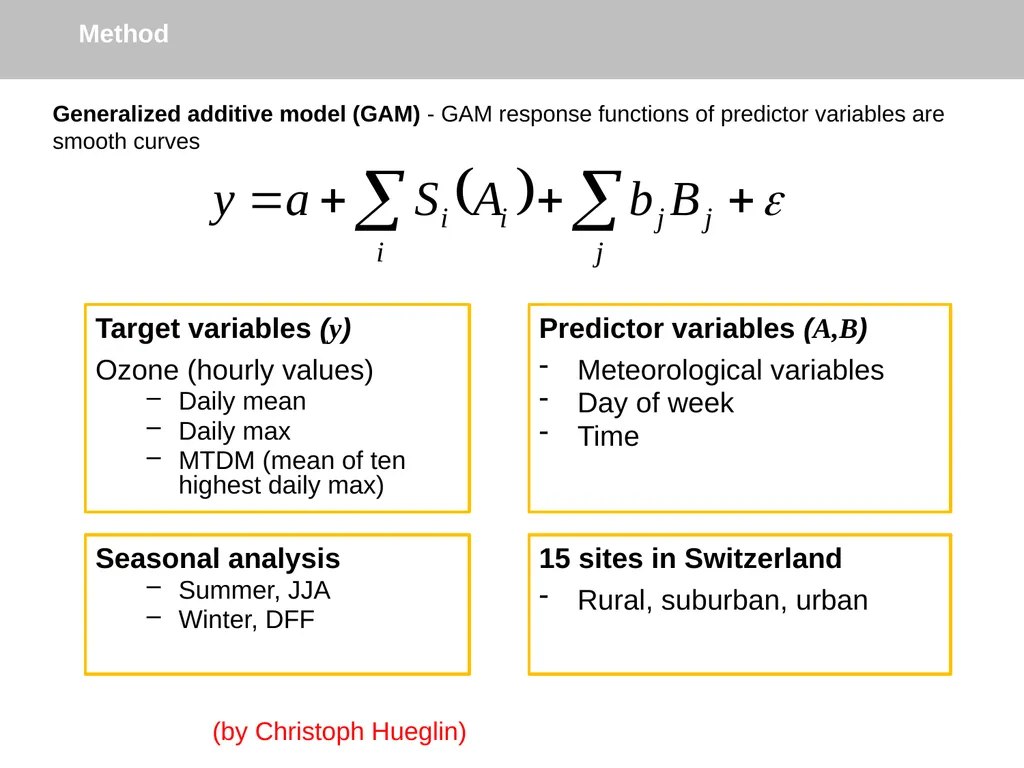
Generalized additive model (GAM) - GAM response functions of predictor variables are smooth curves Method Target variables (y)
Ozone (hourly values)
Daily mean
Daily max
MTDM (mean of ten highest daily max) Predictor variables (A,B)
Meteorological variables
Day of week
Time 15 sites in Switzerland
Rural, suburban, urban Seasonal analysis
Summer, JJA
Winter, DFF (by Christoph Hueglin)<br>
10
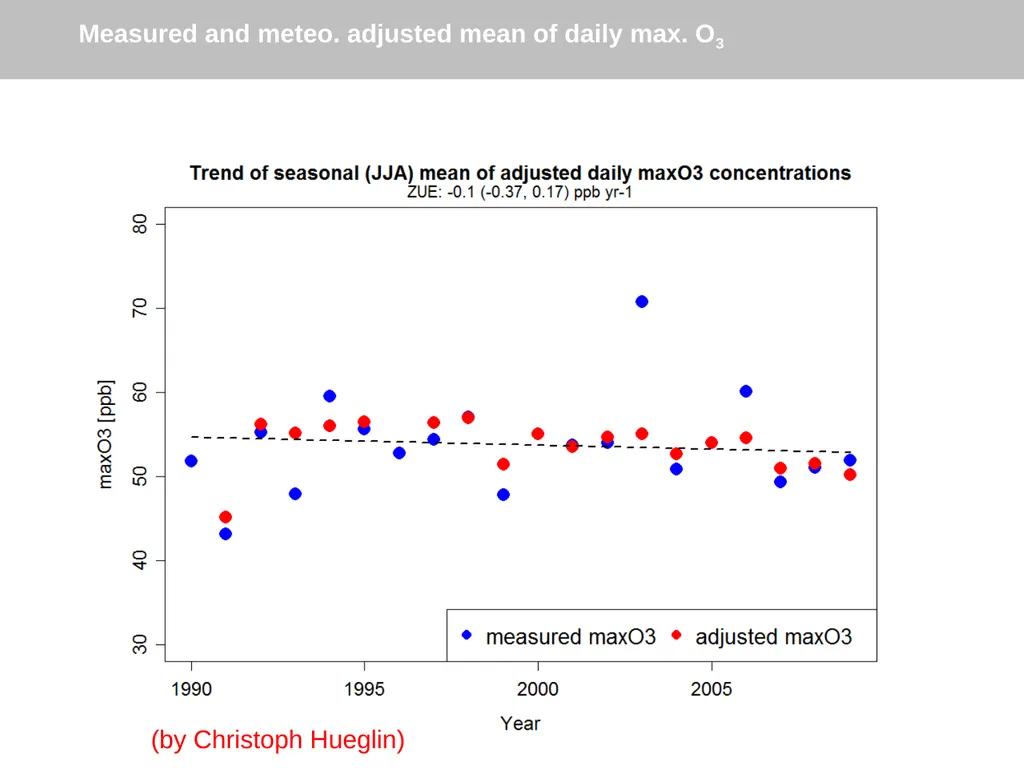
Measured and meteo. adjusted mean of daily max. O3 (by Christoph Hueglin)<br>
11
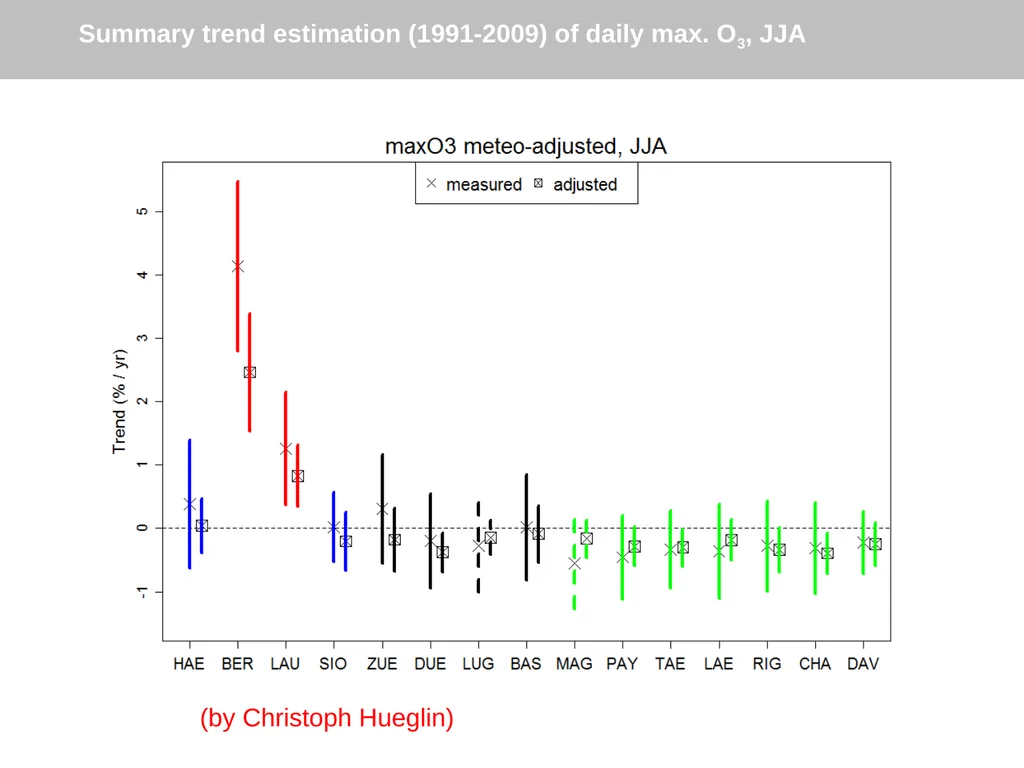
Summary trend estimation (1991-2009) of daily max. O3, JJA (by Christoph Hueglin)<br>
12
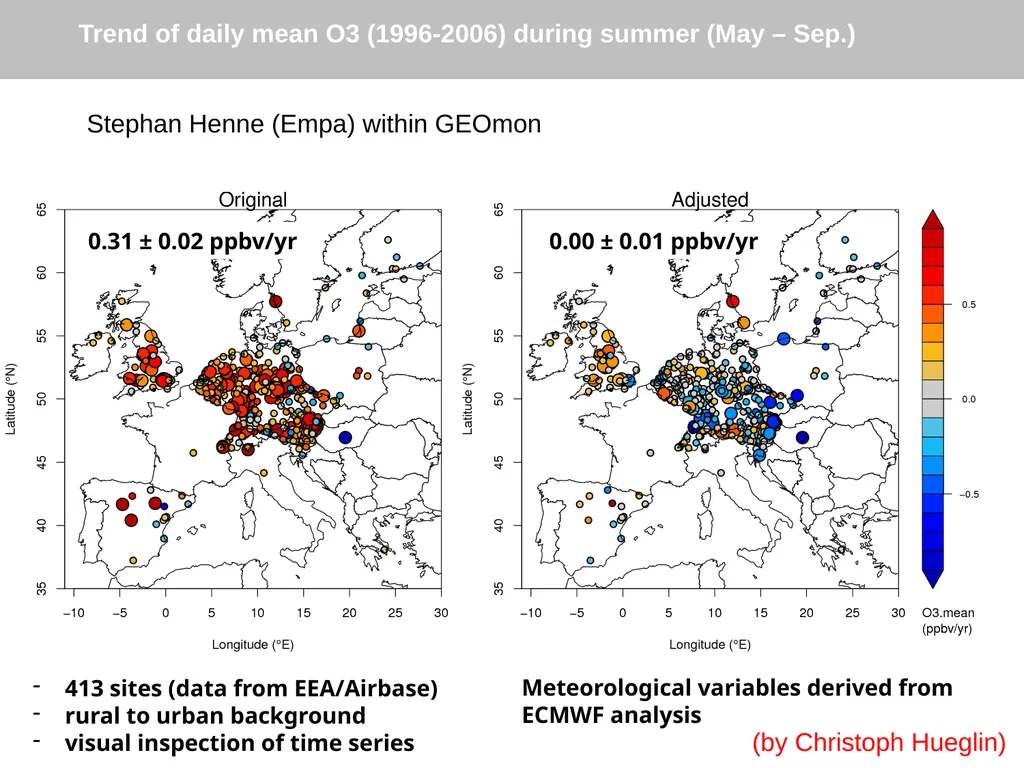
0.31 ± 0.02 ppbv/yr 0.00 ± 0.01 ppbv/yr 413 sites (data from EEA/Airbase)
rural to urban background
visual inspection of time series Trend of daily mean O3 (1996-2006) during summer (May – Sep.) Stephan Henne (Empa) within GEOmon Meteorological variables derived from
ECMWF analysis (by Christoph Hueglin)<br>
13
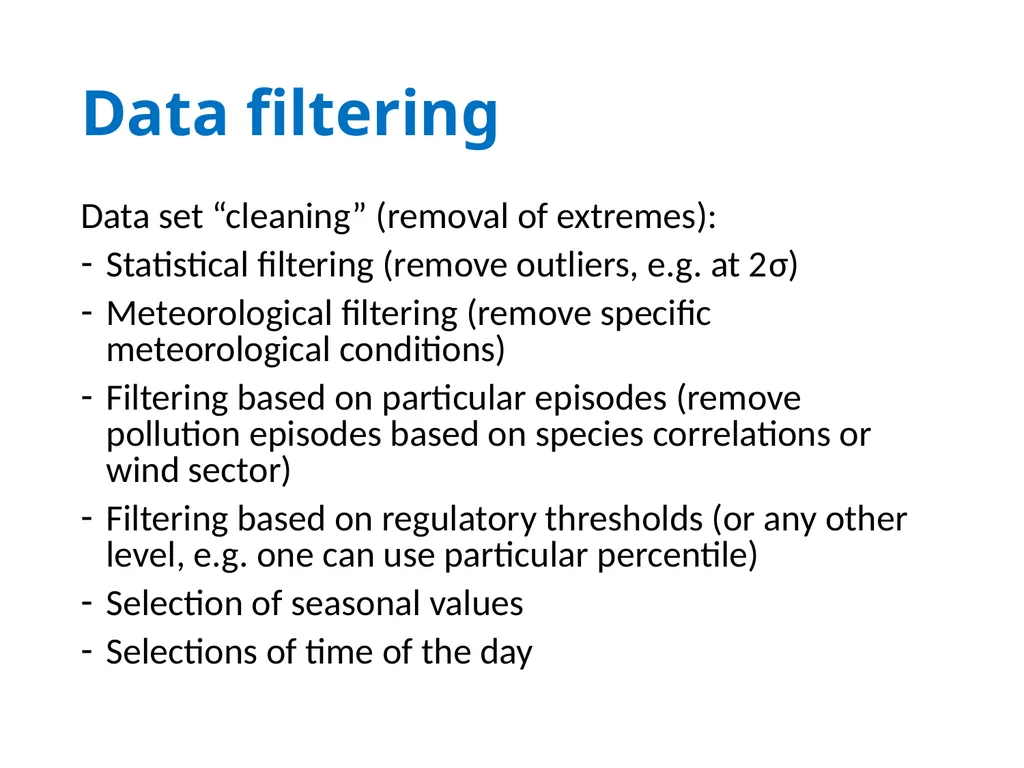
Data filtering Data set “cleaning” (removal of extremes):
Statistical filtering (remove outliers, e.g. at 2σ)
Meteorological filtering (remove specific meteorological conditions)
Filtering based on particular episodes (remove pollution episodes based on species correlations or wind sector)
Filtering based on regulatory thresholds (or any other level, e.g. one can use particular percentile)
Selection of seasonal values
Selections of time of the day<br>
14
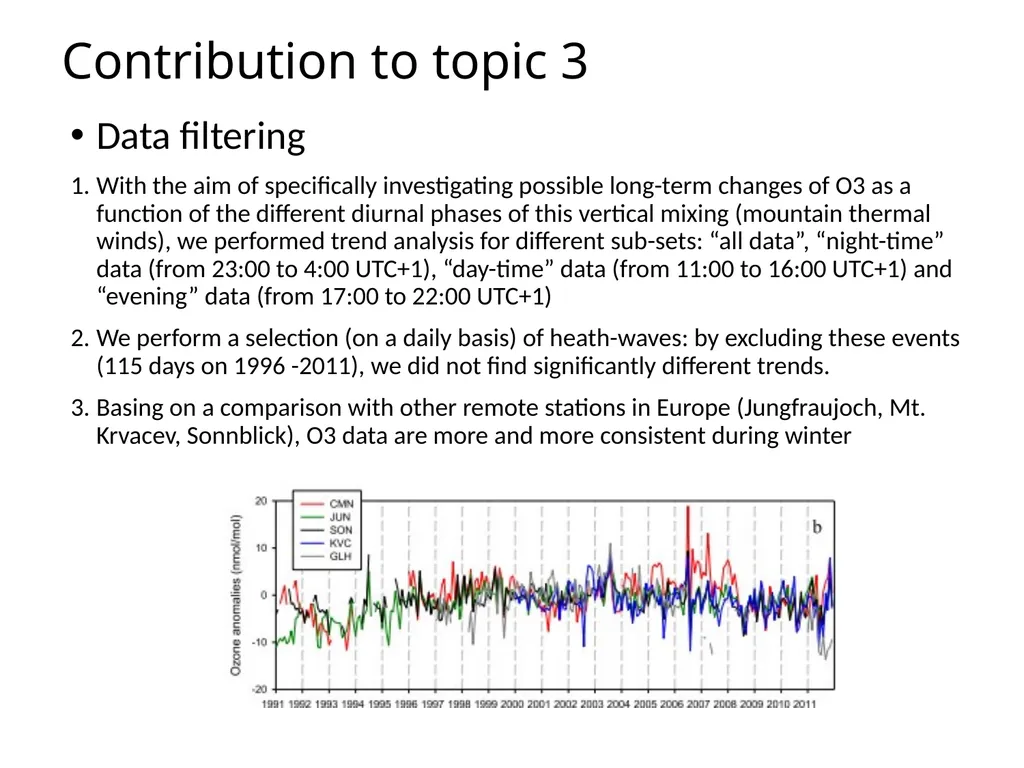
Contribution to topic 3 Data filtering
With the aim of specifically investigating possible long-term changes of O3 as a function of the different diurnal phases of this vertical mixing (mountain thermal winds), we performed trend analysis for different sub-sets: “all data”, “night-time” data (from 23:00 to 4:00 UTC+1), “day-time” data (from 11:00 to 16:00 UTC+1) and “evening” data (from 17:00 to 22:00 UTC+1)
We perform a selection (on a daily basis) of heath-waves: by excluding these events (115 days on 1996 -2011), we did not find significantly different trends.
Basing on a comparison with other remote stations in Europe (Jungfraujoch, Mt. Krvacev, Sonnblick), O3 data are more and more consistent during winter<br>
15
Meteorology: discussion What variables absolutely need meteorological adjustment:
O3, PM, ……..
Do we do meteorological adjustment (do we understand how it works)?
If we do meteorological adjustment, how do we do it?<br>
16
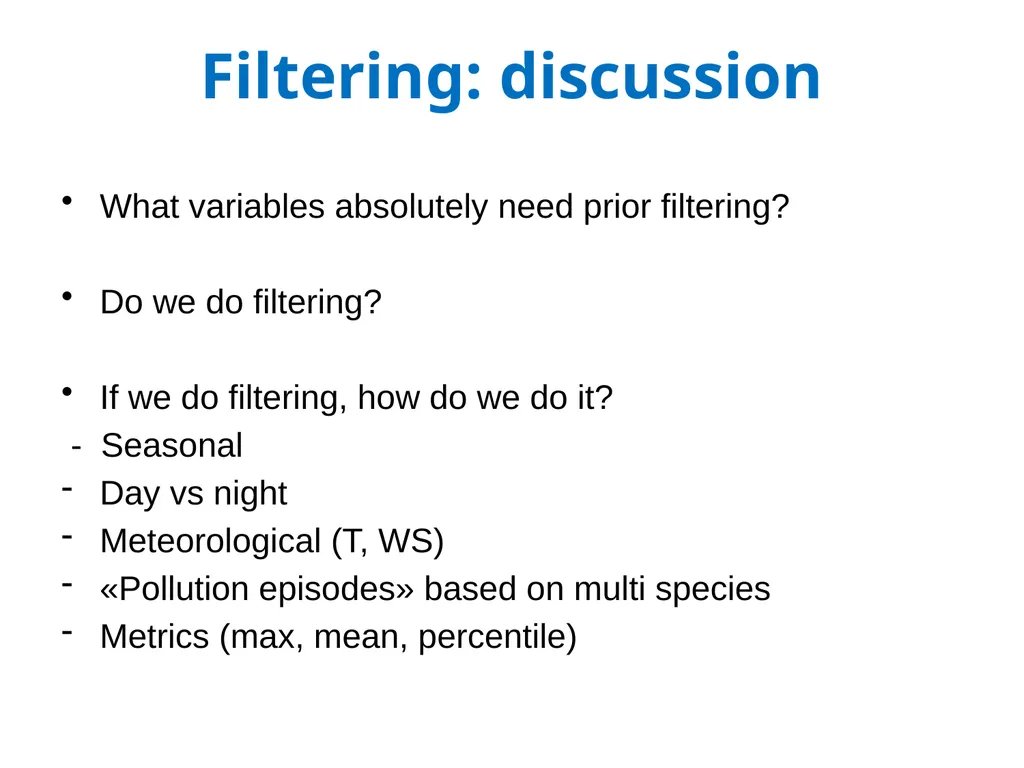
Filtering: discussion What variables absolutely need prior filtering?
Do we do filtering?
If we do filtering, how do we do it?
- Seasonal
Day vs night
Meteorological (T, WS)
«Pollution episodes» based on multi species
Metrics (max, mean, percentile)<br>