
Topic 7: Equity Valuation Larry Schrenk,





Description: Topic 7: Equity Valuation Larry Schrenk, Instructor FIN 377: Investments 8.1 Important Distinctions 8.23 Discounted Cash Flow Discounted Dividend Model (DDM) Free Cash Flow to Equity (FCFE) Free Cash Flow to Firm (FCFF) 8.4 Relative
Related Topics
Download Presentation
"Topic 7: Equity Valuation Larry Schrenk," is the property of its rightful owner. Permission is granted to download and print the materials on this website for personal, non-commercial use only, and to display it on your personal computer provided you do not modify the materials and that you retain all copyright notices contained in the materials. By downloading content from our website, you accept the terms of this agreement.
Presentation Transcript
slide1. Topic 7: Equity Valuation
Larry Schrenk, Instructor FIN 377: Investments<br>
slide2. 8.1 Important Distinctions
8.2/3 Discounted Cash Flow
Discounted Dividend Model (DDM)
Free Cash Flow to Equity (FCFE)
Free Cash Flow to Firm (FCFF)
8.4 Relative Valuation
8.5 Ratio Analysis
8.6 The Quality of Financial Statements Overview<br>
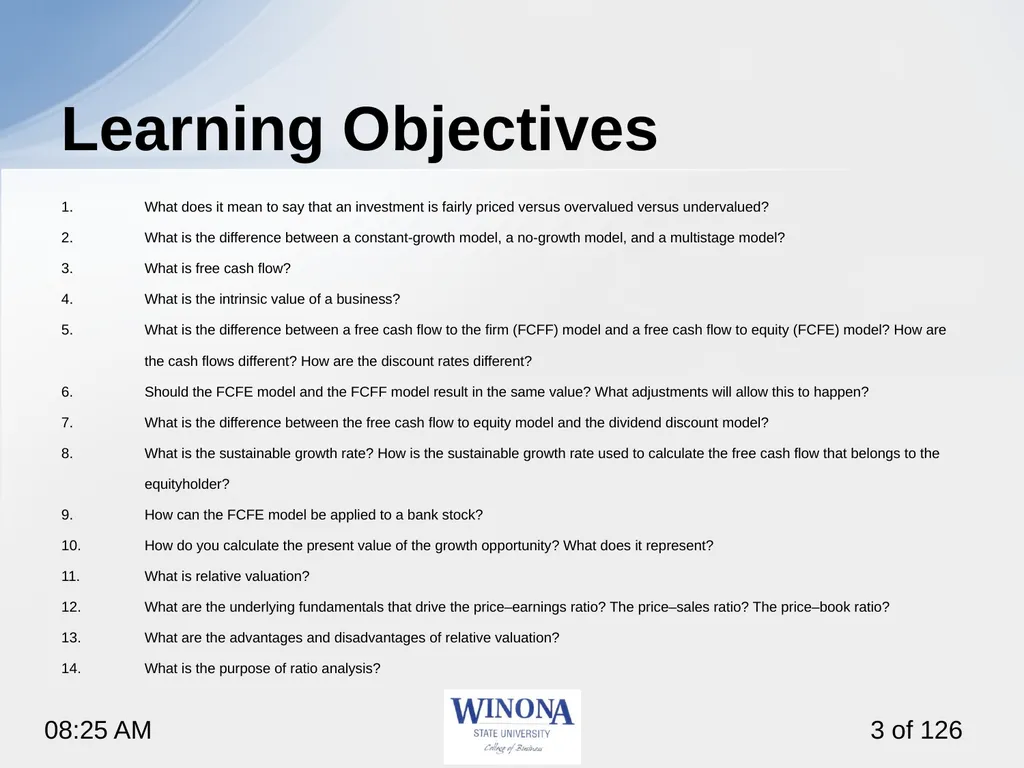
slide3. What does it mean to say that an investment is fairly priced versus overvalued versus undervalued?
What is the difference between a constant-growth model, a no-growth model, and a multistage model?
What is free cash flow?
What is the intrinsic value of a business?
What is the difference between a free cash flow to the firm (FCFF) model and a free cash flow to equity (FCFE) model? How are the cash flows different? How are the discount rates different?
Should the FCFE model and the FCFF model result in the same value? What adjustments will allow this to happen?
What is the difference between the free cash flow to equity model and the dividend discount model?
What is the sustainable growth rate? How is the sustainable growth rate used to calculate the free cash flow that belongs to the equityholder?
How can the FCFE model be applied to a bank stock?
How do you calculate the present value of the growth opportunity? What does it represent?
What is relative valuation?
What are the underlying fundamentals that drive the price–earnings ratio? The price–sales ratio? The price–book ratio?
What are the advantages and disadvantages of relative valuation?
What is the purpose of ratio analysis? Learning Objectives<br>
slide4. Reilley, et al., Investment Analysis and Portfolio Management, Chap. 8 Readings<br>
slide5. 8.1 Important Distinctions<br>
slide6. 8.1 Fairly Valued, Overvalued, and Undervalued Fairly Valued
Overvalued
Undervalued<br>
slide7. 8.1.1 Fairly Valued, Overvalued, and Undervalued Two approaches to valuation:
Absolute valuation
Discounted cash flow (DCF) valuation
Relative valuation<br>
slide8. 8.1.2 Top-Down Approach versus Bottom-Up Approach Two approaches:
Top-down, three-step approach
Bottom-up, stock valuation, stock picking approach
Difference: Importance of economic and industry influence on individual firms and stocks
Both can be implemented by fundamentalists or technicians<br>
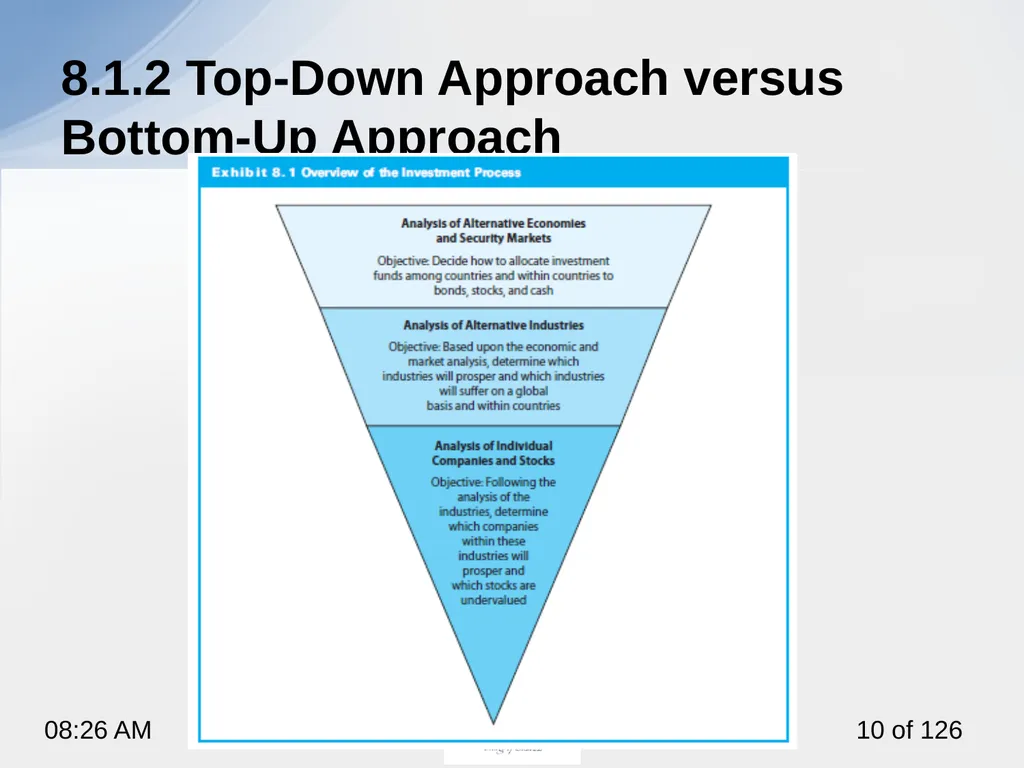
slide9. 8.1.2 Top-Down Approach versus Bottom-Up Approach Top-down approach:
The overall market and economy
The industry
The individual company<br>
slide10. 8.1.2 Top-Down Approach versus Bottom-Up Approach<br>
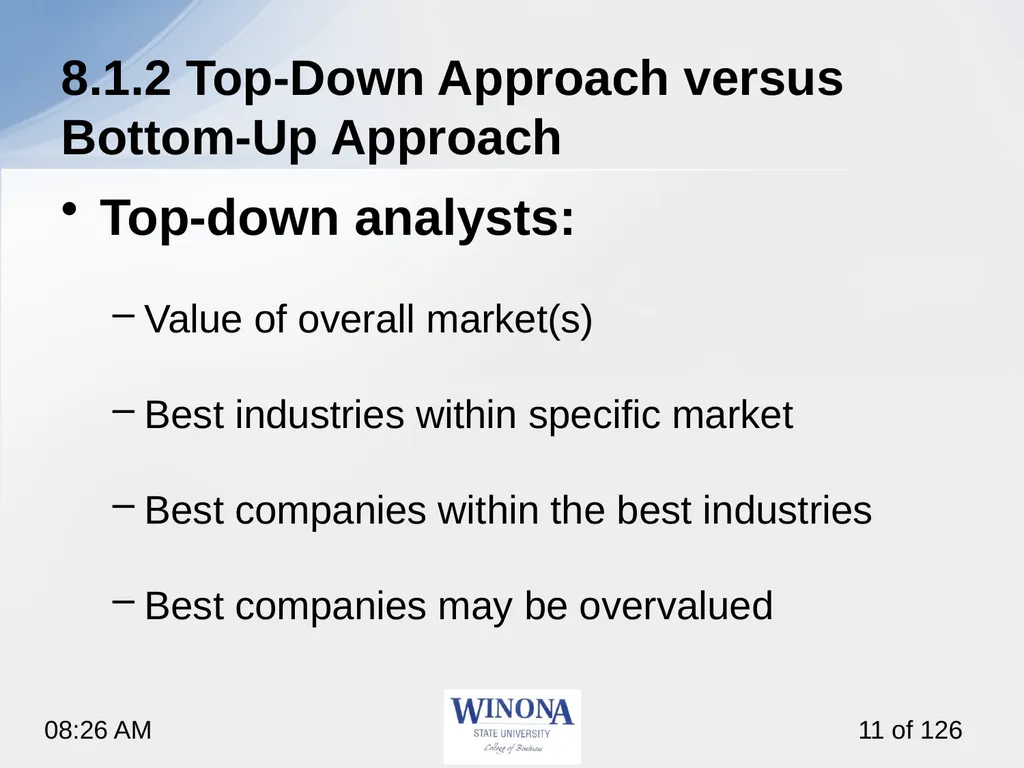
slide11. 8.1.2 Top-Down Approach versus Bottom-Up Approach Top-down analysts:
Value of overall market(s)
Best industries within specific market
Best companies within the best industries
Best companies may be overvalued<br>
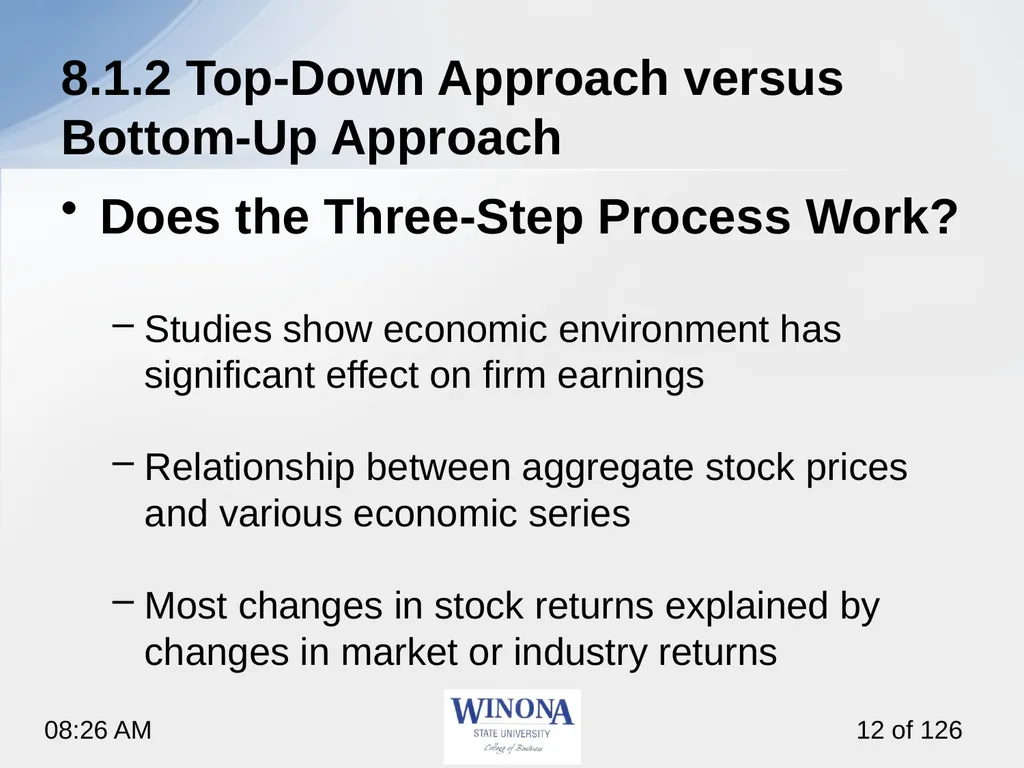
slide12. 8.1.2 Top-Down Approach versus Bottom-Up Approach Does the Three-Step Process Work?
Studies show economic environment has significant effect on firm earnings
Relationship between aggregate stock prices and various economic series
Most changes in stock returns explained by changes in market or industry returns<br>
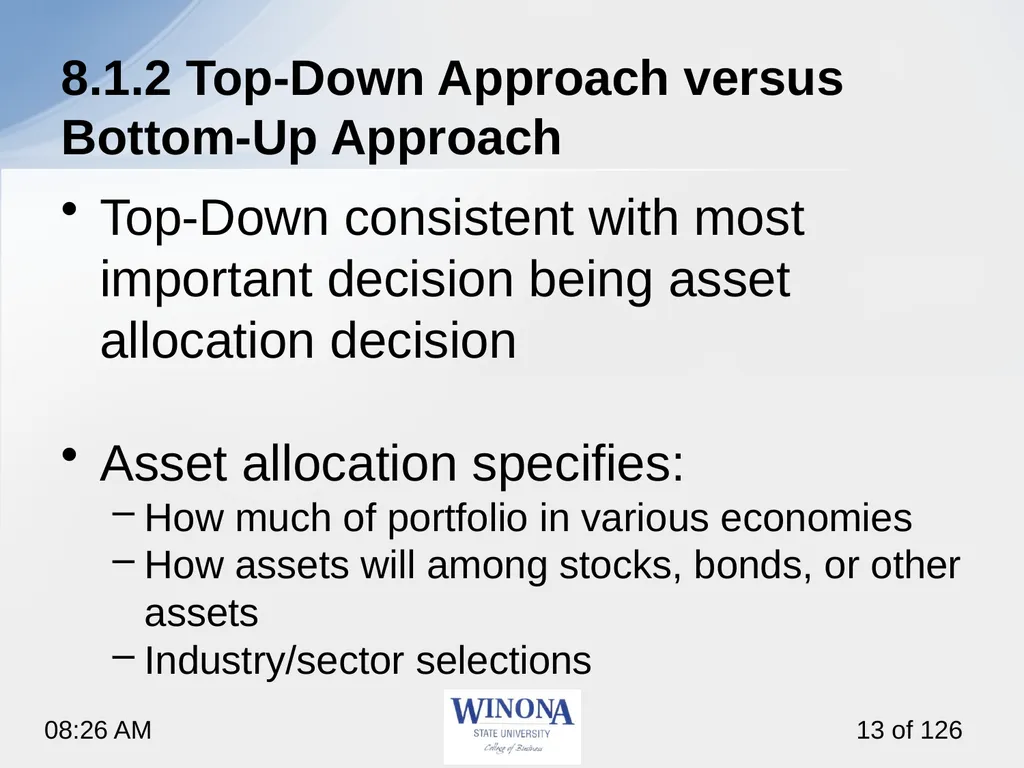
slide13. 8.1.2 Top-Down Approach versus Bottom-Up Approach Top-Down consistent with most important decision being asset allocation decision
Asset allocation specifies:
How much of portfolio in various economies
How assets will among stocks, bonds, or other assets
Industry/sector selections<br>
slide14. 8.2/3 Discounted Cash Flow<br>
slide15. 8.2 An Introduction to DCF and Relative Valuation Asset value calculated using discounted cash flow and relative valuation
Intrinsic value:
The present value of cash flows is the value that we ascribe to the business<br>
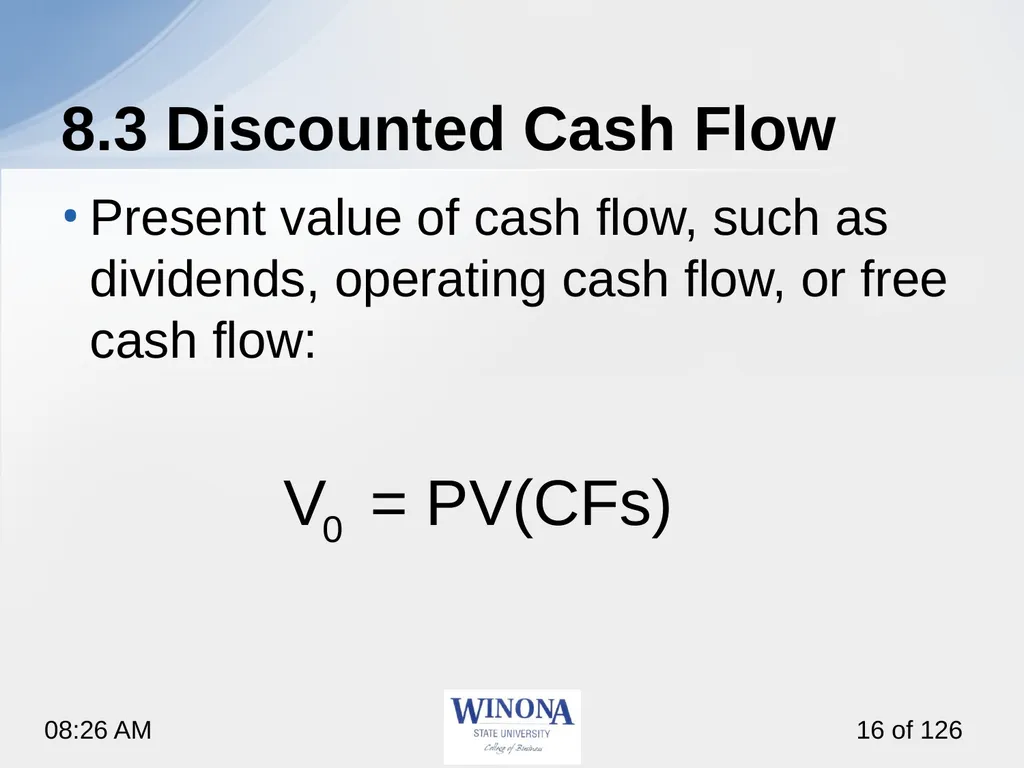
slide16. 8.3 Discounted Cash Flow Present value of cash flow, such as dividends, operating cash flow, or free cash flow:<br>
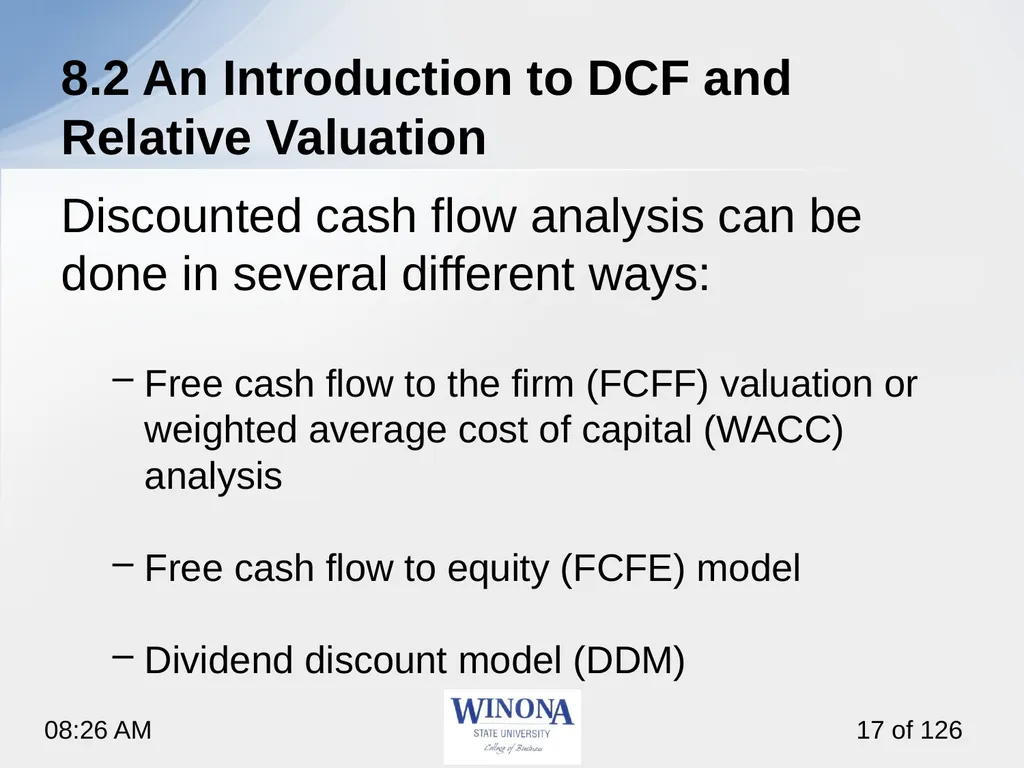
slide17. 8.2 An Introduction to DCF and Relative Valuation Discounted cash flow analysis can be done in several different ways:
Free cash flow to the firm (FCFF) valuation or weighted average cost of capital (WACC) analysis
Free cash flow to equity (FCFE) model
Dividend discount model (DDM)<br>
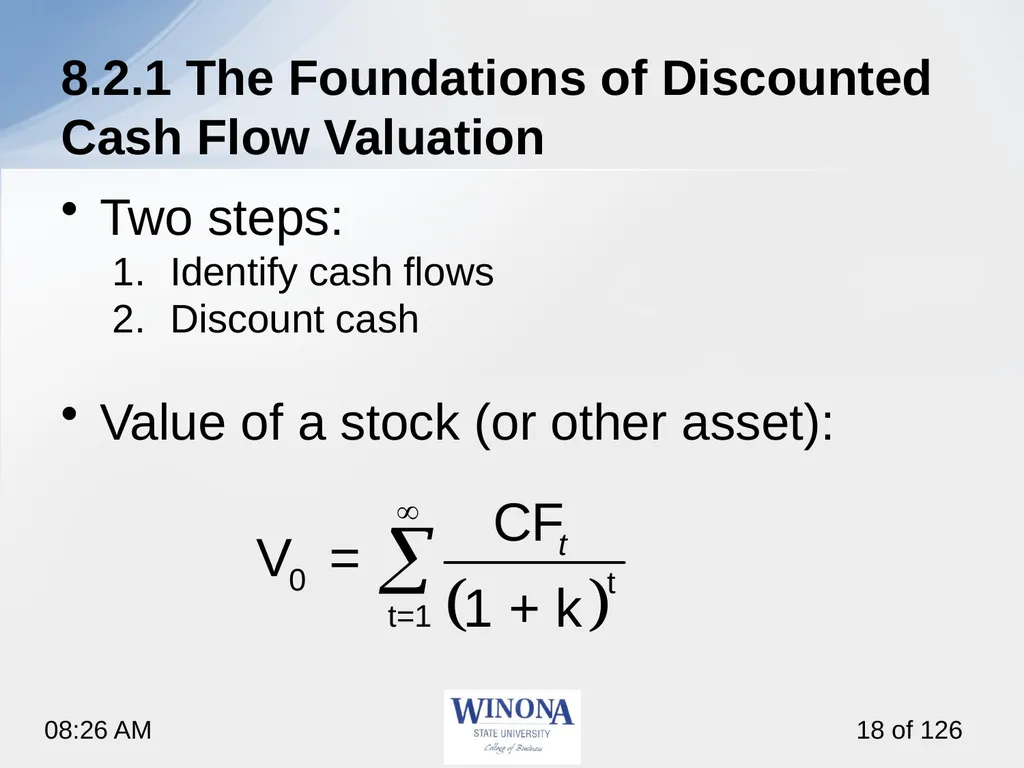
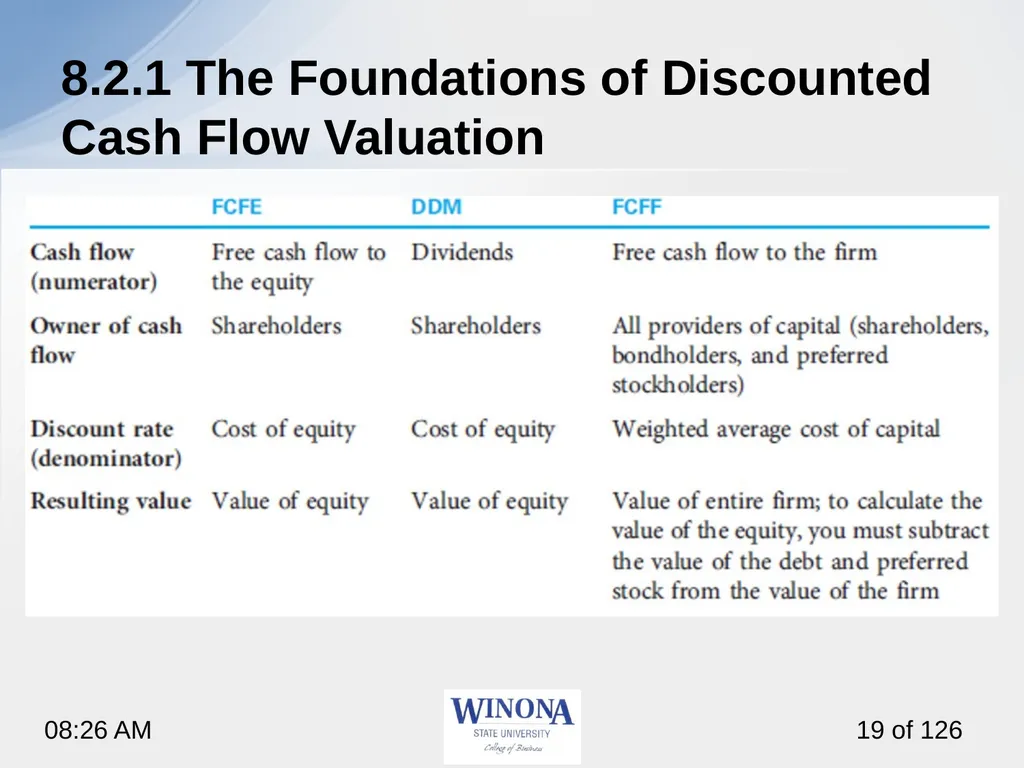
slide18. 8.2.1 The Foundations of Discounted Cash Flow Valuation Two steps:
Identify cash flows
Discount cash
Value of a stock (or other asset):<br>
slide19. 8.2.1 The Foundations of Discounted Cash Flow Valuation<br>
slide20. 8.2/3 Discounted Cash Flow Discounted Dividend Model (DDM)<br>
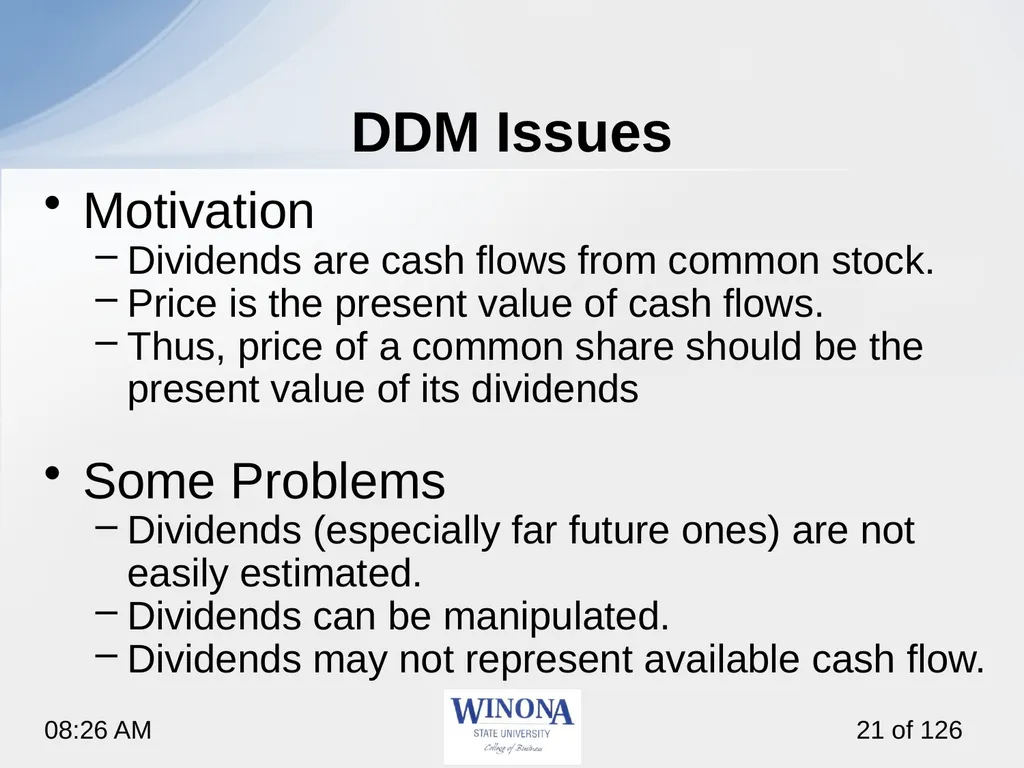
slide21. DDM Issues Motivation
Dividends are cash flows from common stock.
Price is the present value of cash flows.
Thus, price of a common share should be the present value of its dividends
Some Problems
Dividends (especially far future ones) are not easily estimated.
Dividends can be manipulated.
Dividends may not represent available cash flow.<br>
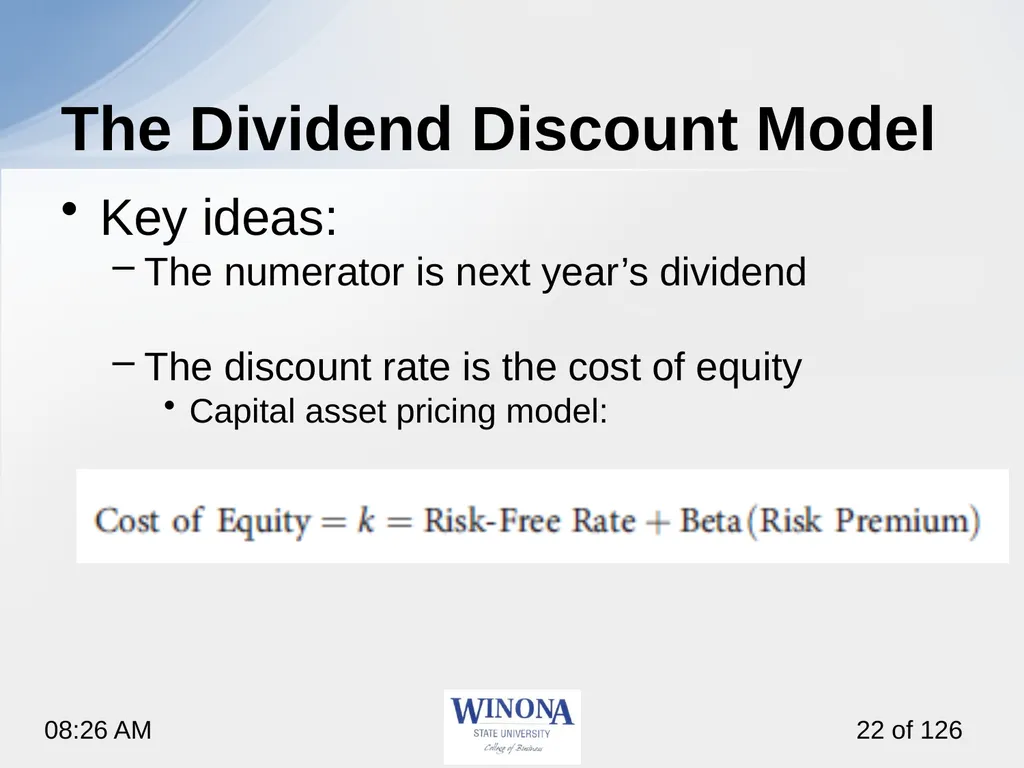
slide22. The Dividend Discount Model Key ideas:
The numerator is next year’s dividend
The discount rate is the cost of equity
Capital asset pricing model:<br>
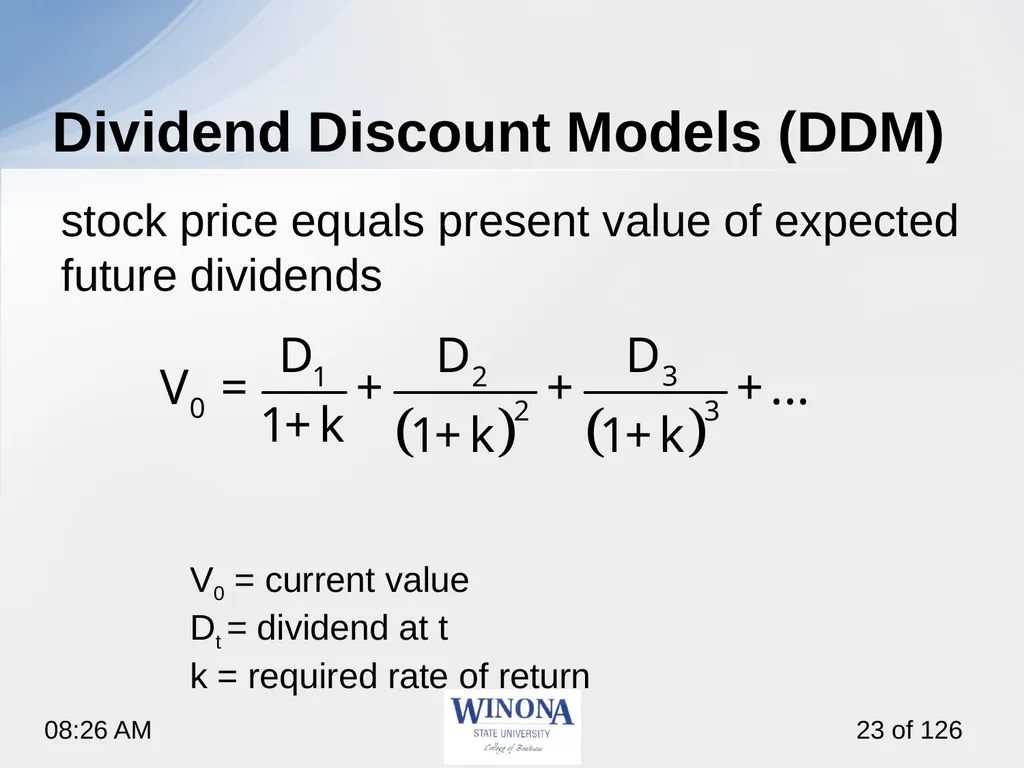
slide23. stock price equals present value of expected future dividends
V0 = current value
Dt = dividend at t
k = required rate of return Dividend Discount Models (DDM)<br>
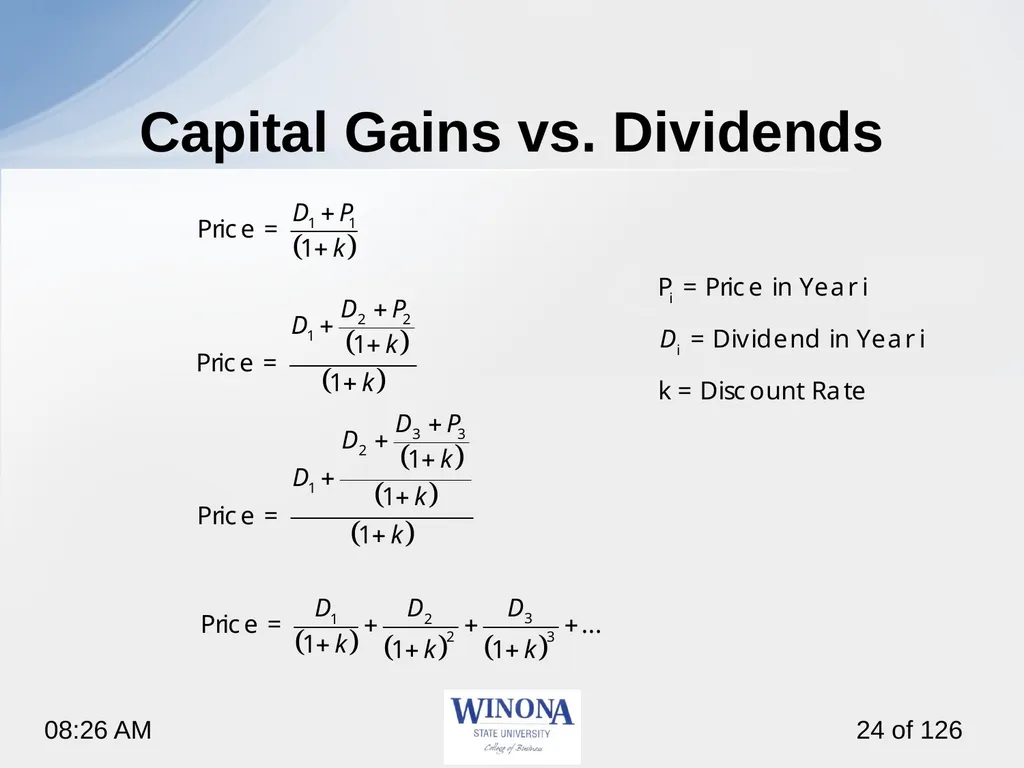
slide24. Capital Gains vs. Dividends<br>
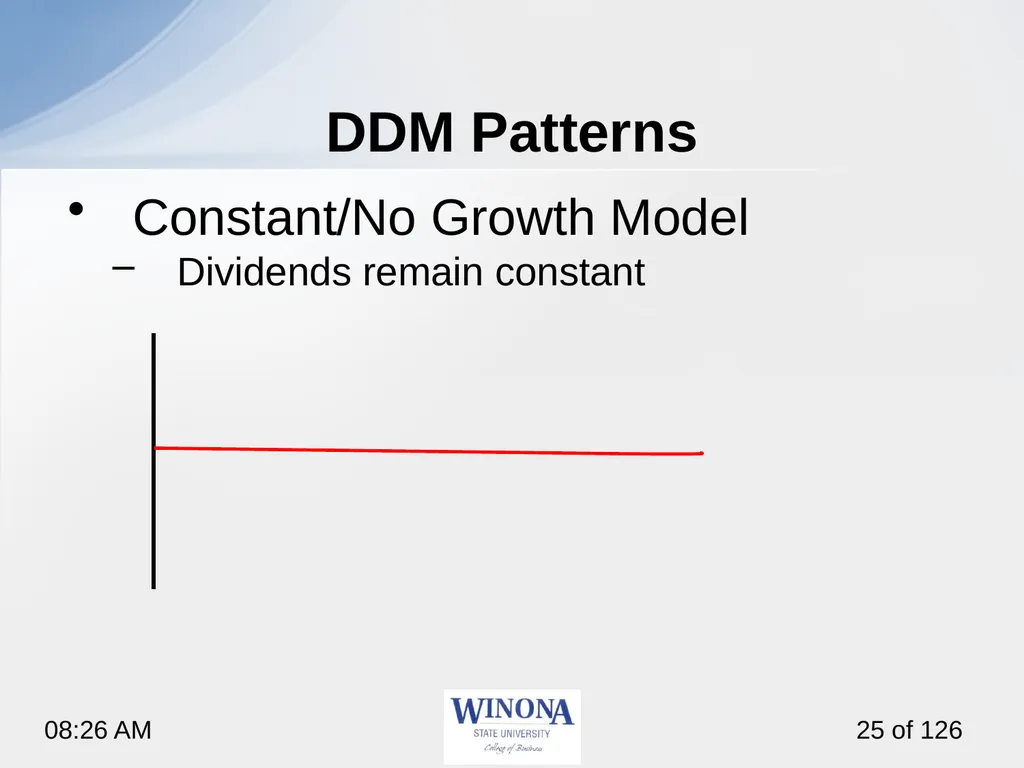
slide25. DDM Patterns Constant/No Growth Model
Dividends remain constant<br>
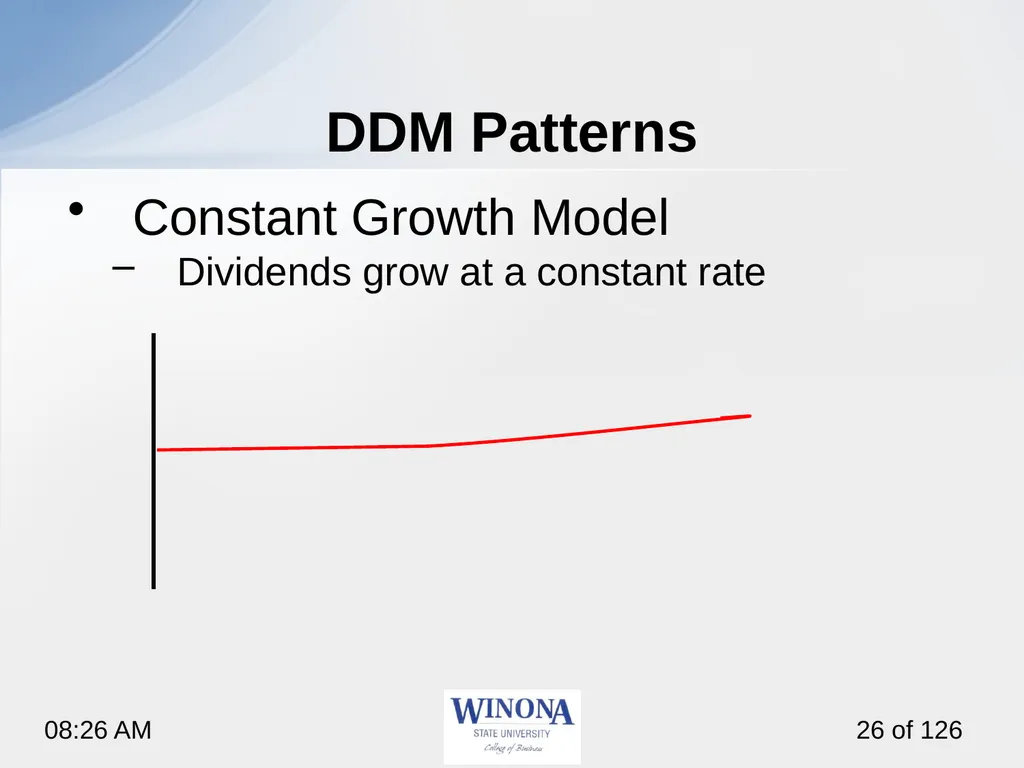
slide26. DDM Patterns Constant Growth Model
Dividends grow at a constant rate<br>
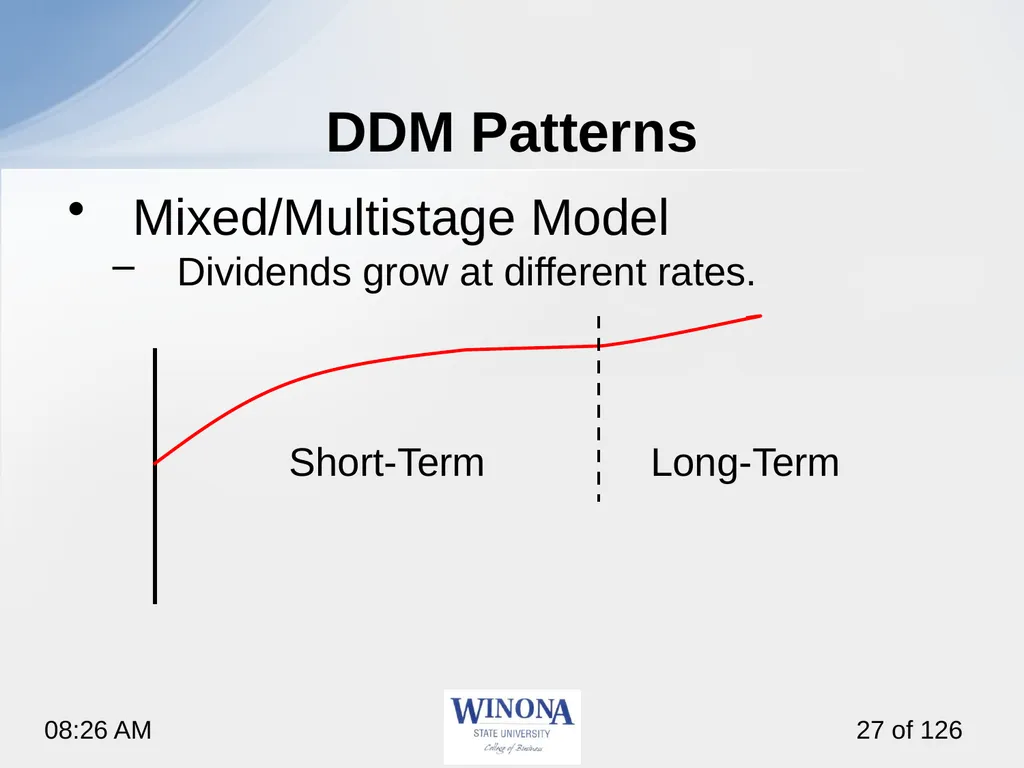
slide27. DDM Patterns Mixed/Multistage Model
Dividends grow at different rates.
Short-Term Long-Term<br>
slide28. 8.2/3 Discounted Cash Flow Constant/No Growth Model<br>
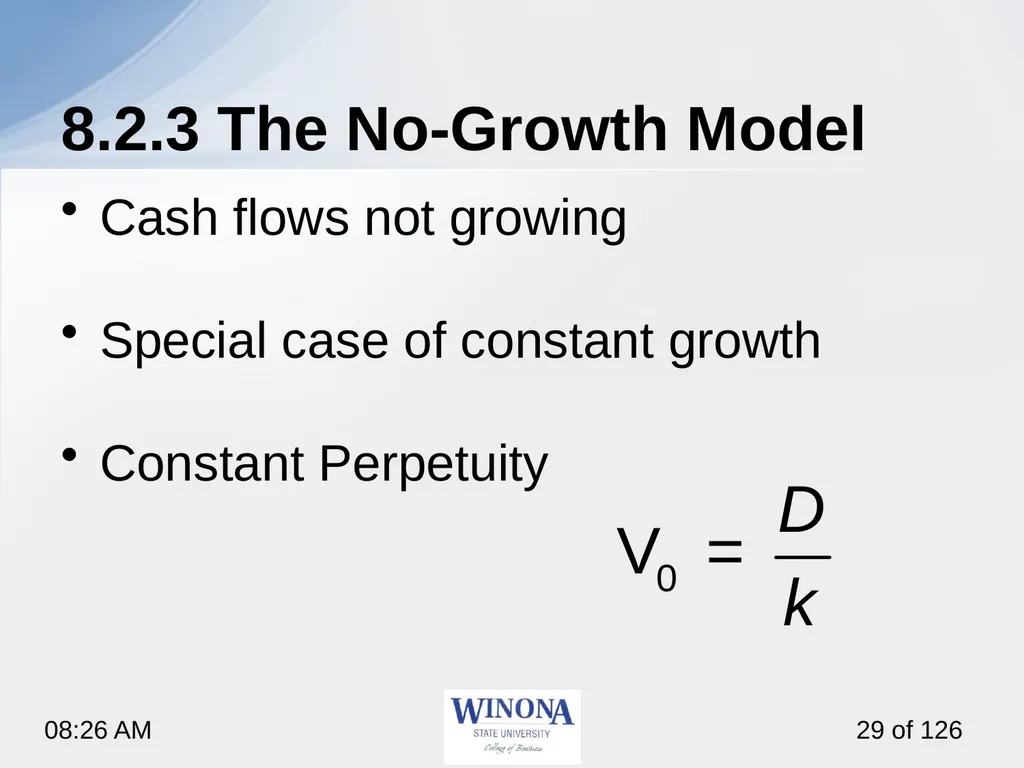
slide29. 8.2.3 The No-Growth Model Cash flows not growing
Special case of constant growth
Constant Perpetuity<br>
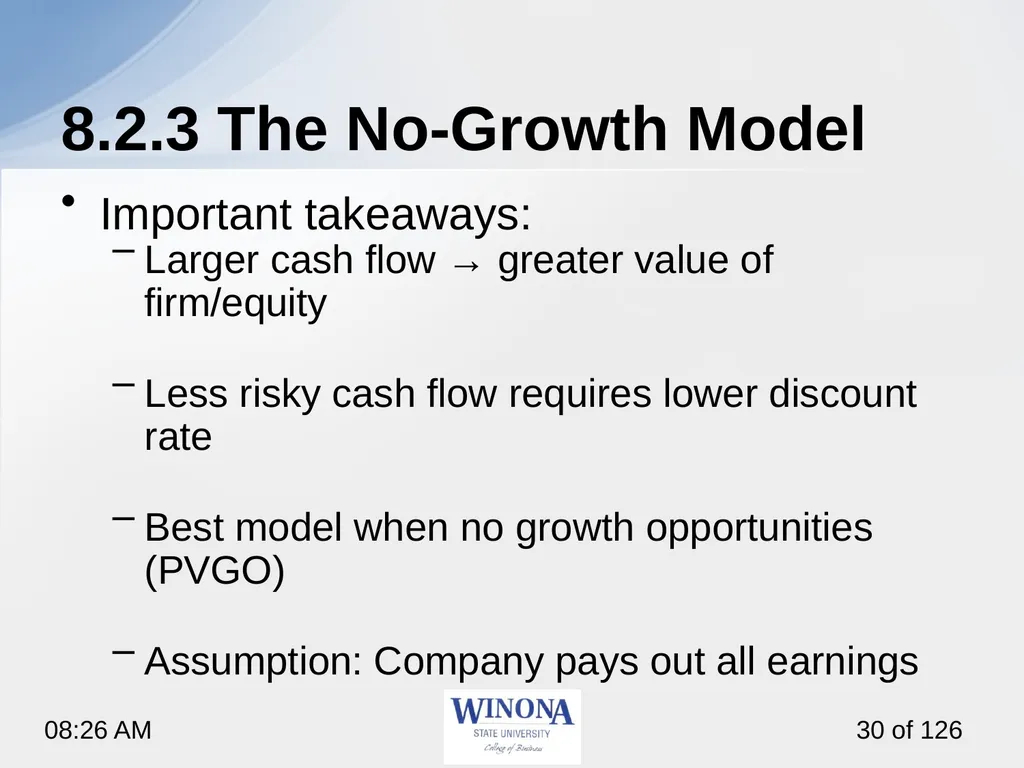
slide30. 8.2.3 The No-Growth Model Important takeaways:
Larger cash flow → greater value of firm/equity
Less risky cash flow requires lower discount rate
Best model when no growth opportunities (PVGO)
Assumption: Company pays out all earnings<br>
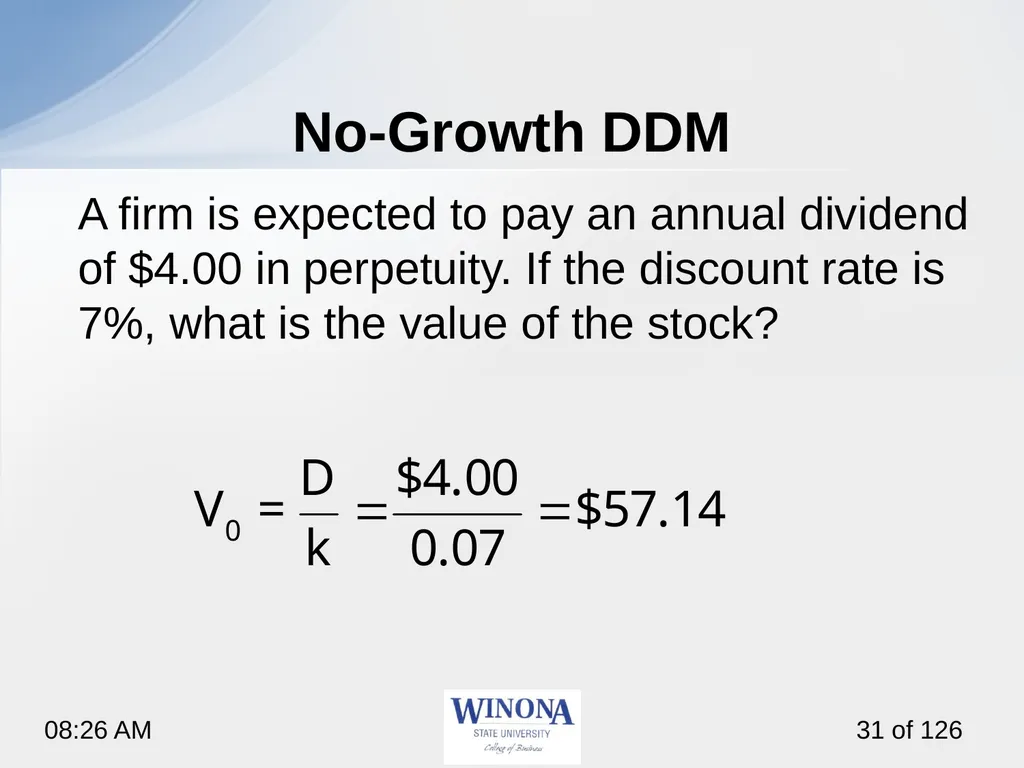
slide31. No-Growth DDM A firm is expected to pay an annual dividend of $4.00 in perpetuity. If the discount rate is 7%, what is the value of the stock?<br>
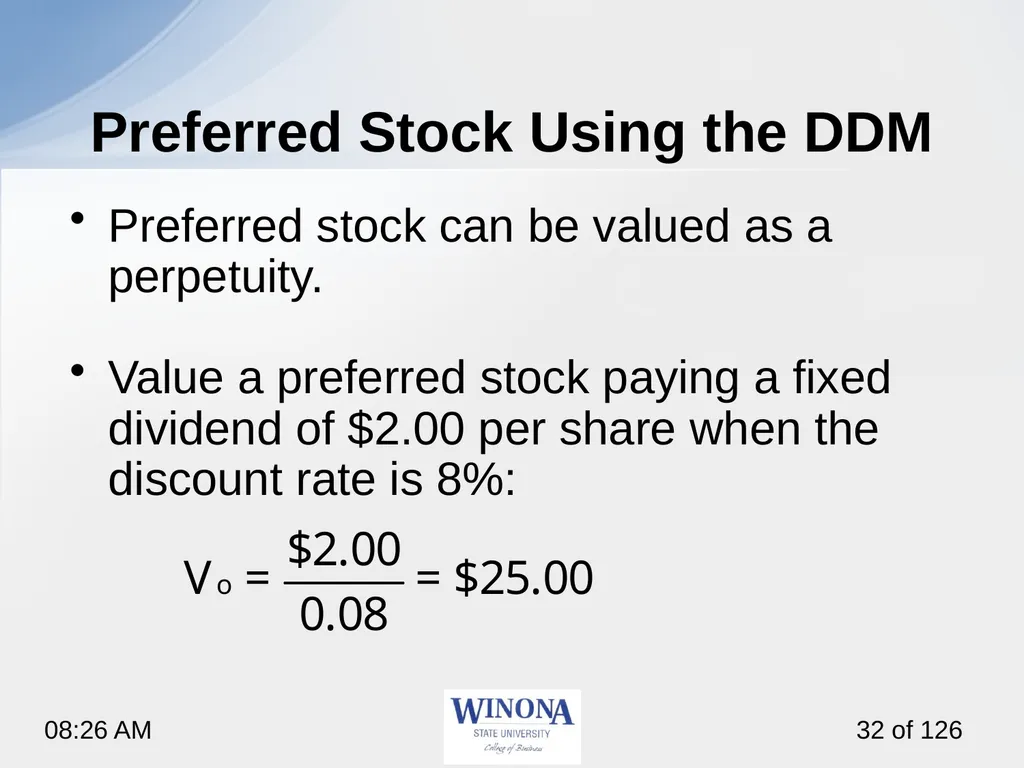
slide32. Preferred Stock Using the DDM Preferred stock can be valued as a perpetuity.
Value a preferred stock paying a fixed dividend of $2.00 per share when the discount rate is 8%:<br>
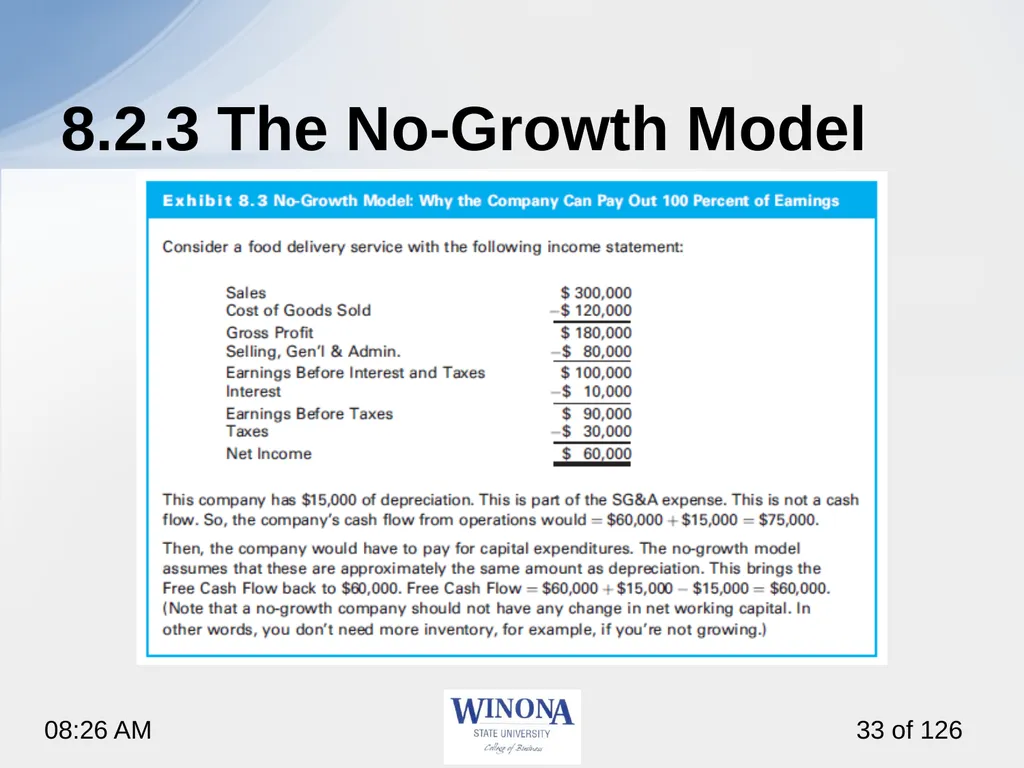
slide33. 8.2.3 The No-Growth Model<br>
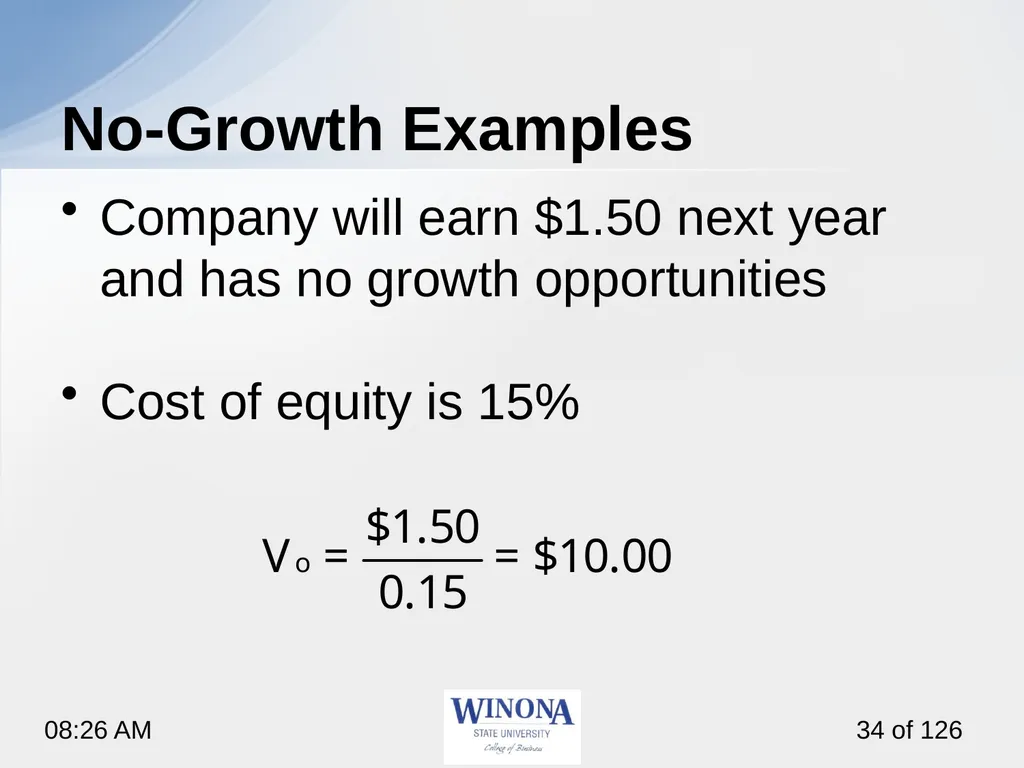
slide34. No-Growth Examples Company will earn $1.50 next year and has no growth opportunities
Cost of equity is 15%<br>
slide35. 8.2/3 Discounted Cash Flow Constant Growth Model<br>
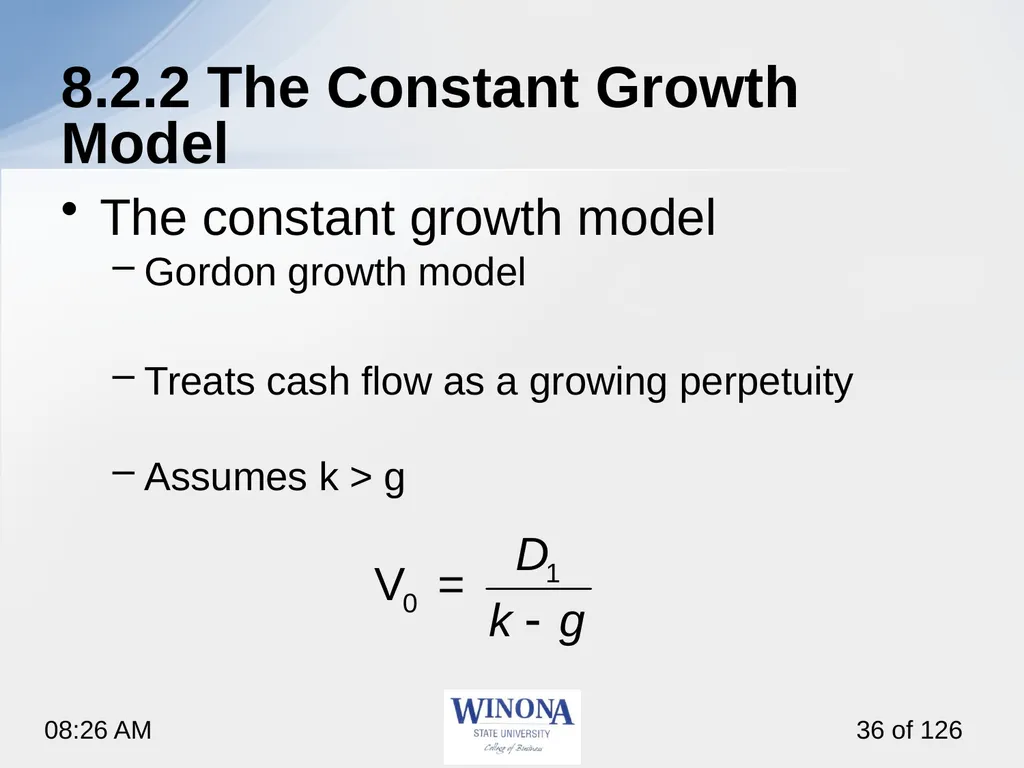
slide36. 8.2.2 The Constant Growth Model The constant growth model
Gordon growth model
Treats cash flow as a growing perpetuity
Assumes k > g<br>
slide37. 8.2.2 The Constant Growth Model Three uses:
General estimate of value
Basis for fundamental multiples
Terminal value of a model<br>
slide38. 8.2.2 The Constant Growth Model Growth rate (g) describes how CF increases each year and investment must grow each year
Required rate of return (k) is what investment earns each year
Cannot pay out entire k; must retain g to grow
Amount that can be paid out is k – g<br>
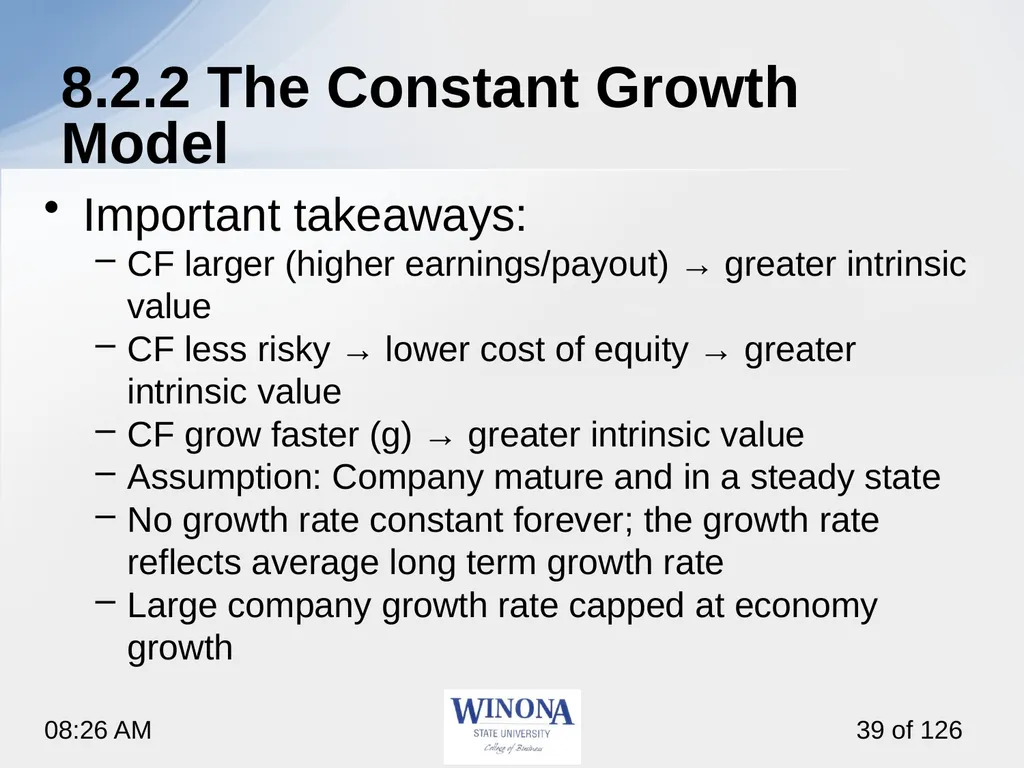
slide39. 8.2.2 The Constant Growth Model Important takeaways:
CF larger (higher earnings/payout) → greater intrinsic value
CF less risky → lower cost of equity → greater intrinsic value
CF grow faster (g) → greater intrinsic value
Assumption: Company mature and in a steady state
No growth rate constant forever; the growth rate reflects average long term growth rate
Large company growth rate capped at economy growth<br>
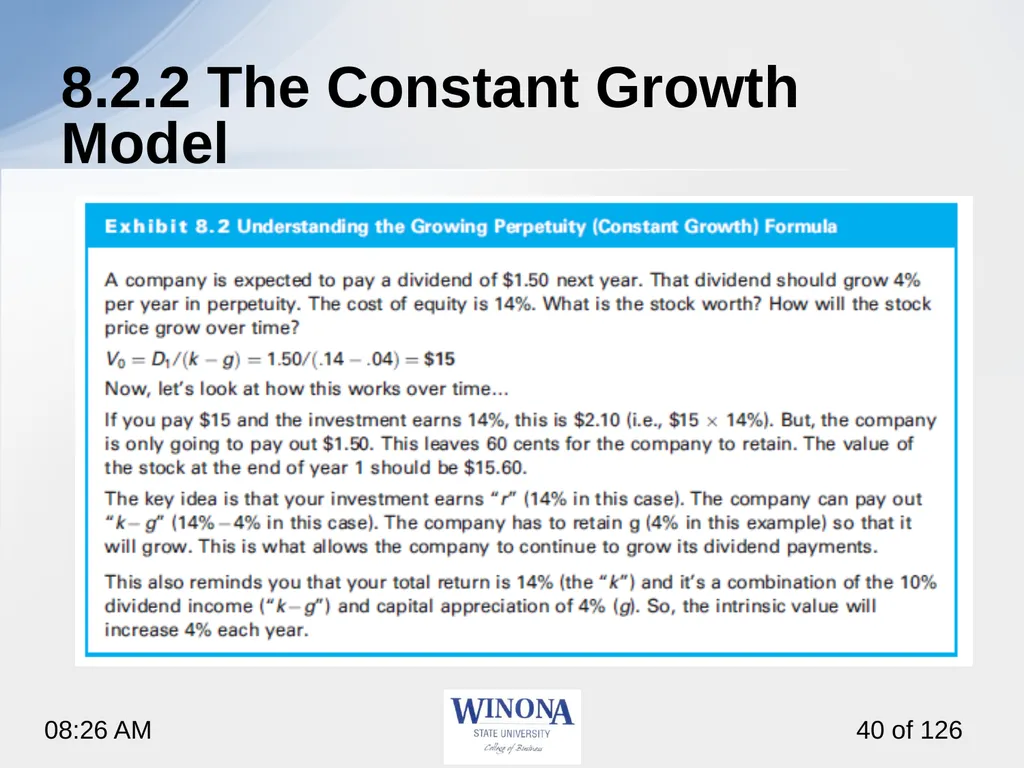
slide40. 8.2.2 The Constant Growth Model<br>
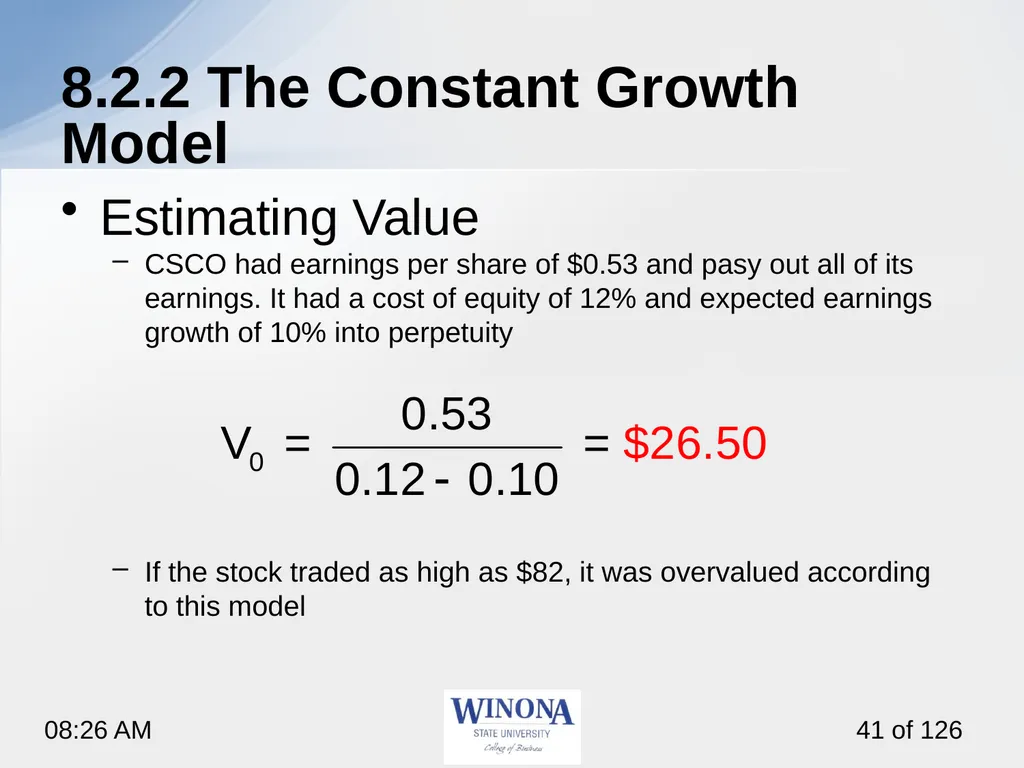
slide41. 8.2.2 The Constant Growth Model Estimating Value
CSCO had earnings per share of $0.53 and pasy out all of its earnings. It had a cost of equity of 12% and expected earnings growth of 10% into perpetuity
If the stock traded as high as $82, it was overvalued according to this model<br>
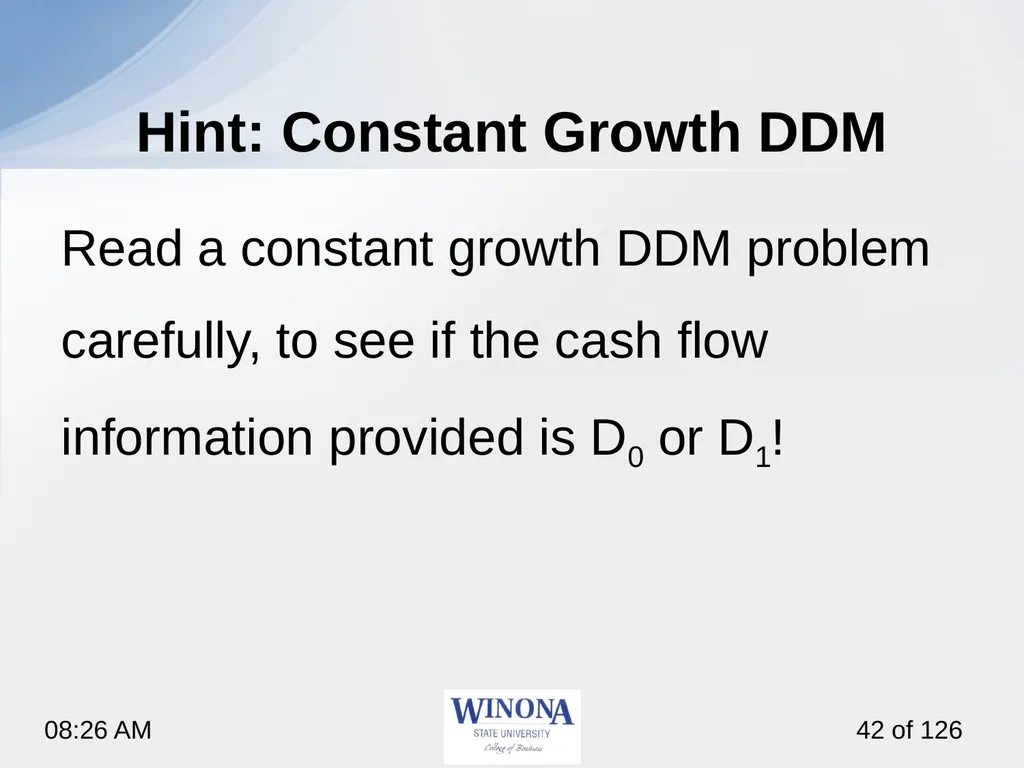
slide42. Read a constant growth DDM problem carefully, to see if the cash flow information provided is D0 or D1! Hint: Constant Growth DDM<br>
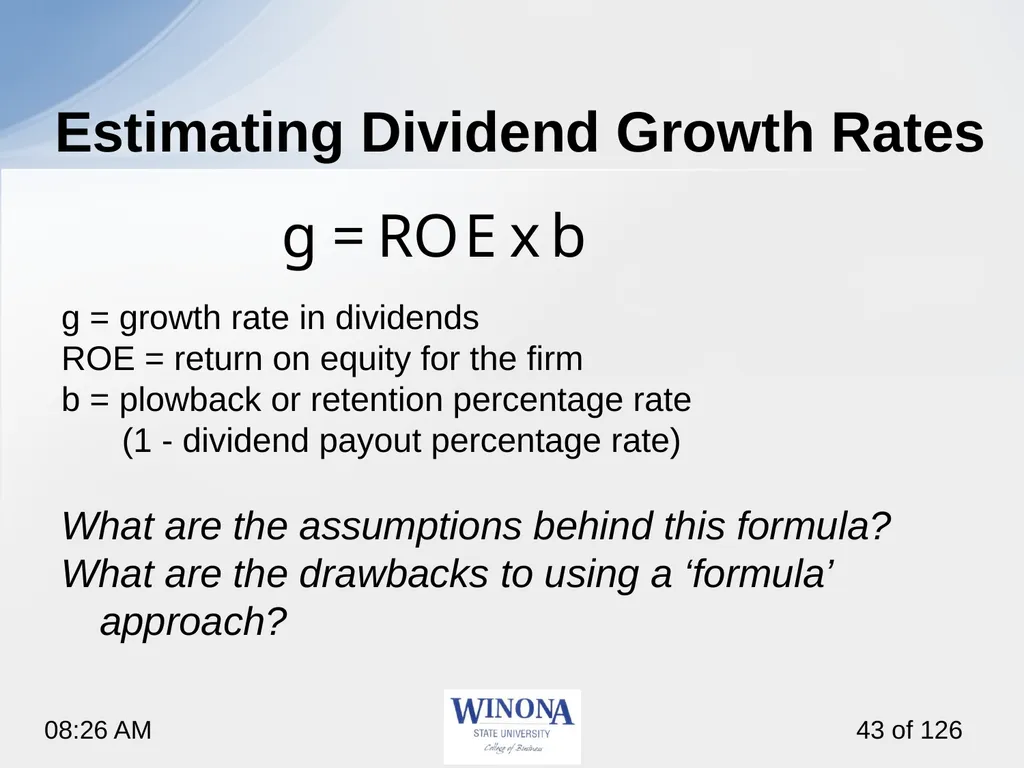
slide43. g = growth rate in dividends
ROE = return on equity for the firm
b = plowback or retention percentage rate
(1 - dividend payout percentage rate)
What are the assumptions behind this formula?
What are the drawbacks to using a ‘formula’ approach? Estimating Dividend Growth Rates<br>
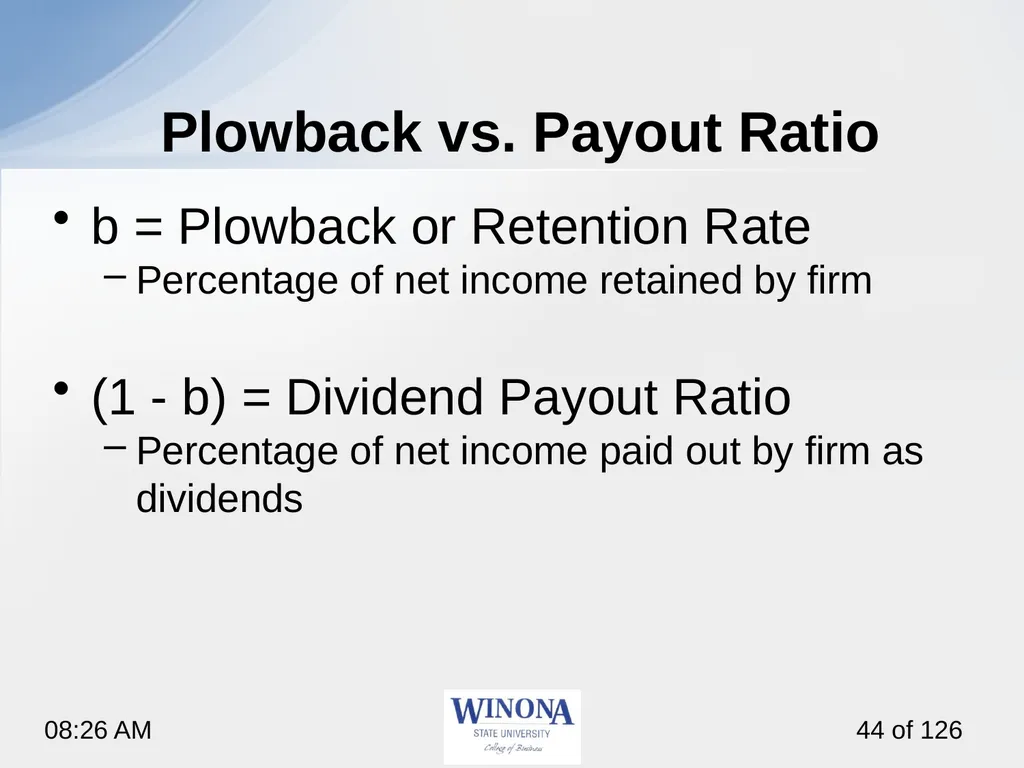
slide44. b = Plowback or Retention Rate
Percentage of net income retained by firm
(1 - b) = Dividend Payout Ratio
Percentage of net income paid out by firm as dividends Plowback vs. Payout Ratio<br>
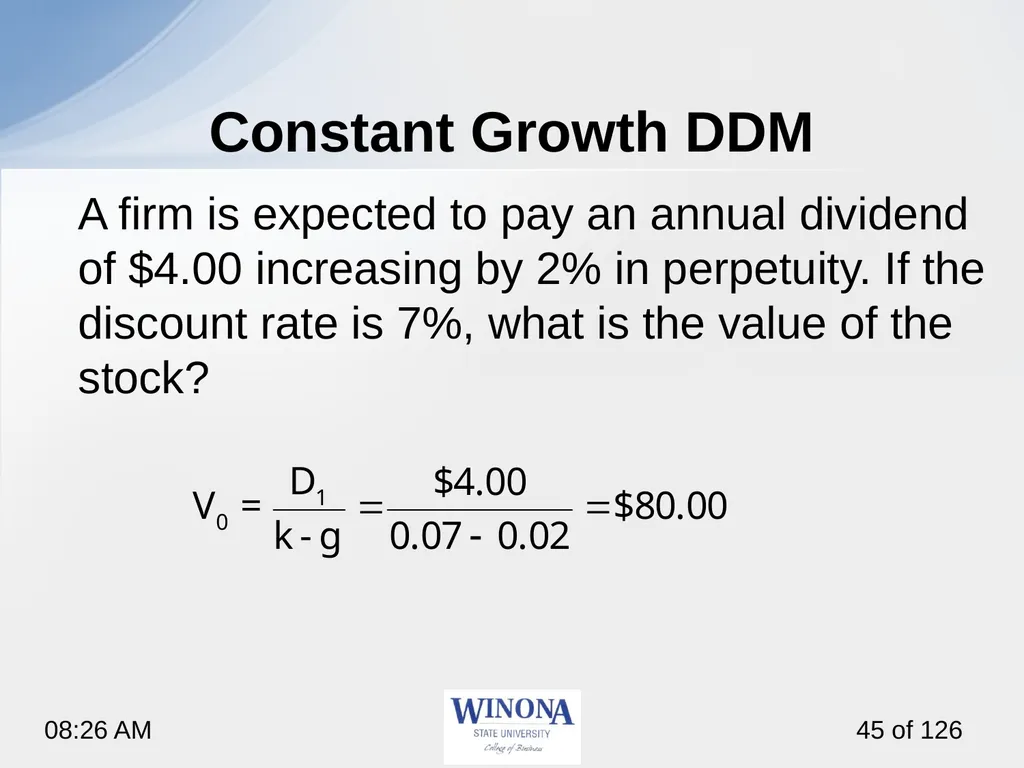
slide45. Constant Growth DDM A firm is expected to pay an annual dividend of $4.00 increasing by 2% in perpetuity. If the discount rate is 7%, what is the value of the stock?<br>
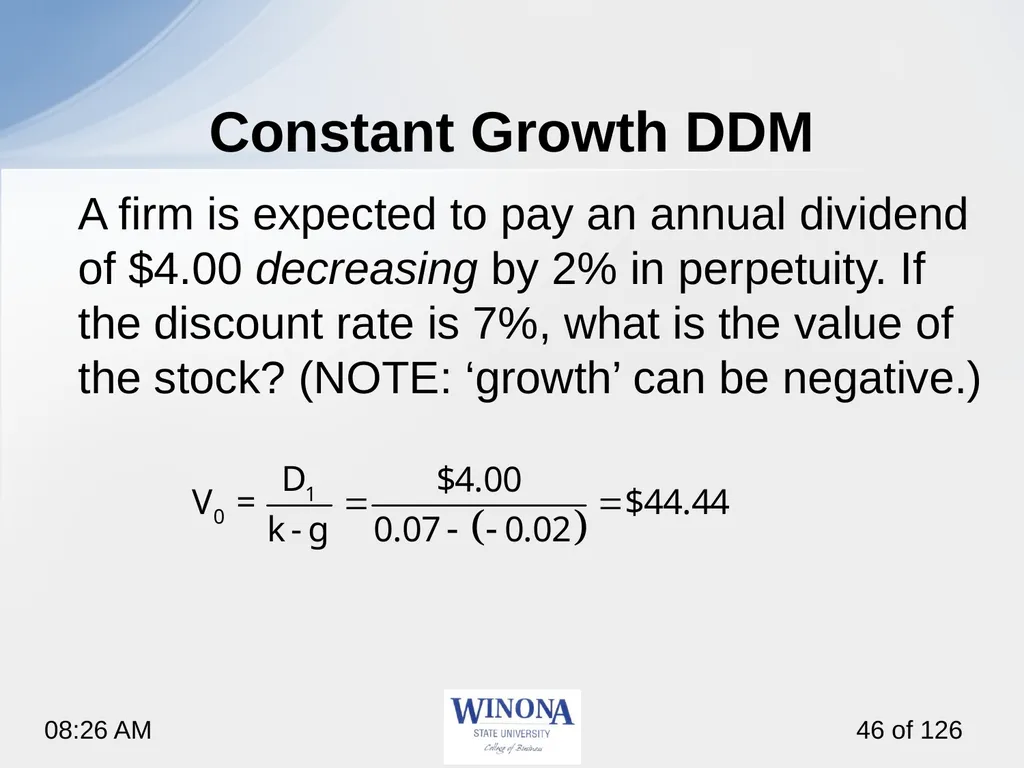
slide46. Constant Growth DDM A firm is expected to pay an annual dividend of $4.00 decreasing by 2% in perpetuity. If the discount rate is 7%, what is the value of the stock? (NOTE: ‘growth’ can be negative.)<br>
slide47. Firm Value = Assets-in-Place + PVGO
The value of the firm equals the value of the assets already in place, the no-growth value of the firm...
Plus the NPV of its future investments, the present value of growth opportunities (PVGO). Present Value of Growth Opportunities<br>
slide48. Present Value of the Growth Opportunity (PVGO) PVGO is the part of a stock’s intrinsic value attributable to growth
How much of the intrinsic value is derived from growth?
NOTE: PVGO can be negative.<br>
slide49. Present Value of Growth Opportunities PVGO is calculated in three steps:
Calculate the intrinsic value of the stock
Calculate the no-growth value of the stock
Calculate the PVGO by subtracting the no-growth value from the intrinsic value<br>
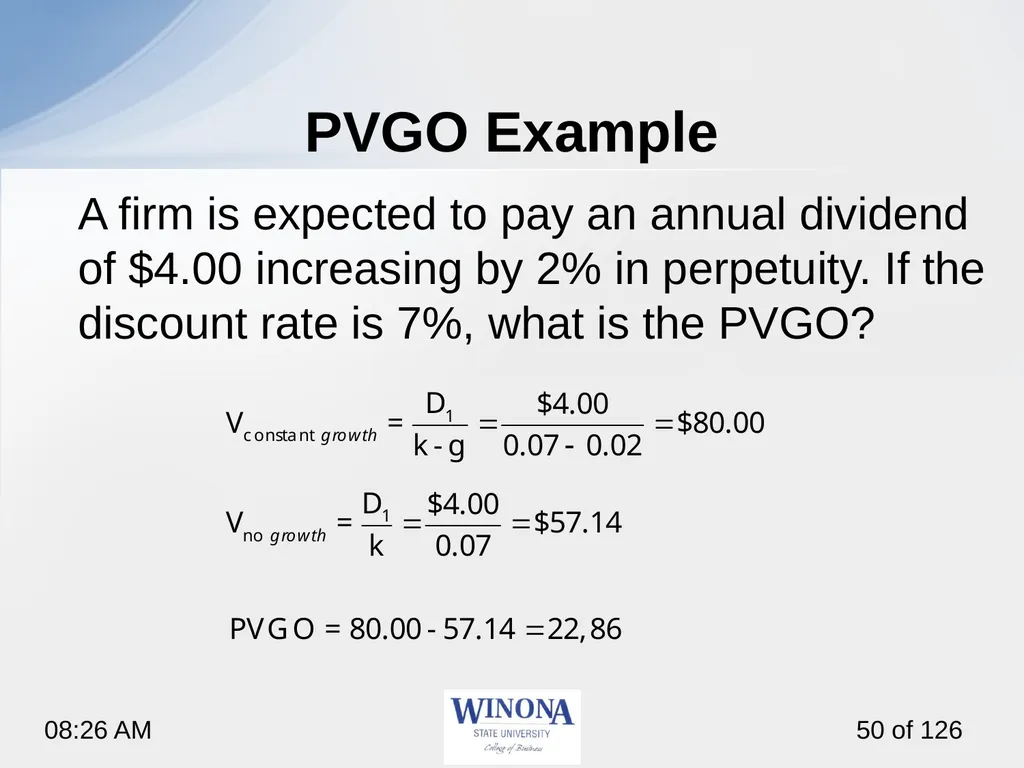
slide50. PVGO Example A firm is expected to pay an annual dividend of $4.00 increasing by 2% in perpetuity. If the discount rate is 7%, what is the PVGO?<br>
slide51. 8.2/3 Discounted Cash Flow Mixed/Multistage Model<br>
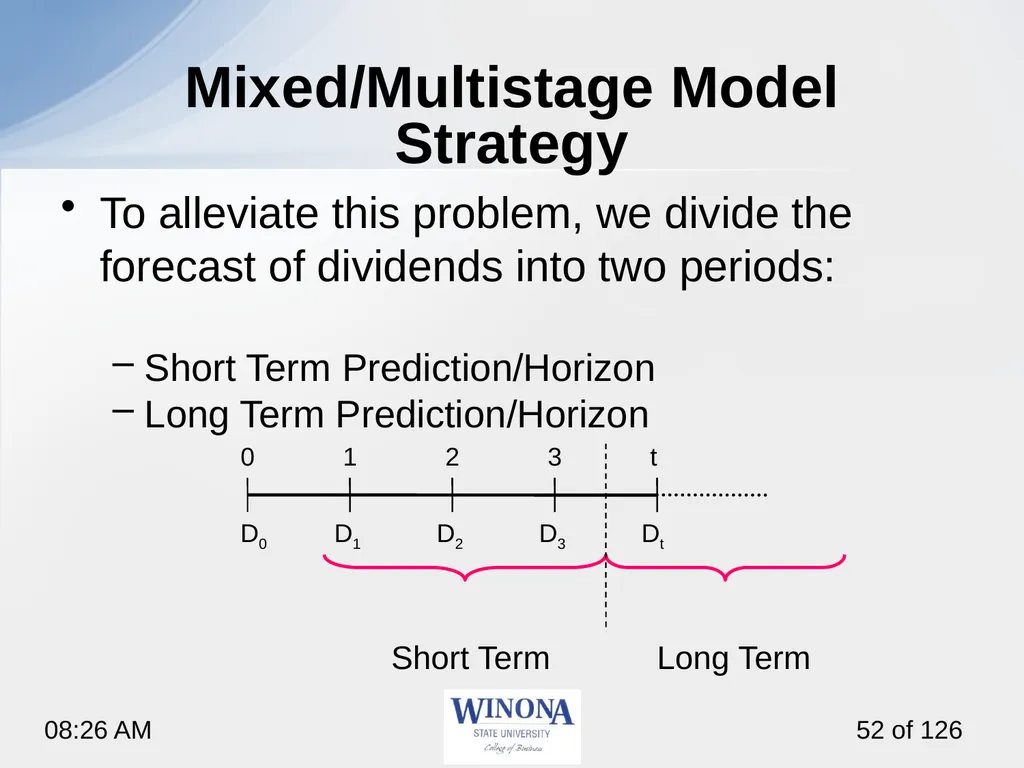
slide52. Mixed/Multistage Model Strategy To alleviate this problem, we divide the forecast of dividends into two periods:
Short Term Prediction/Horizon
Long Term Prediction/Horizon
Short Term Long Term 0 1 2 3 t D0 D1 D2 Dt D3<br>
slide53. Mixed/Multistage Model Problem Estimate year-by-year dividends for an extended period, e.g., ten years,
this would become a pure, unfounded guess at values.
What will the dividend be for IBM 8 years from now?<br>
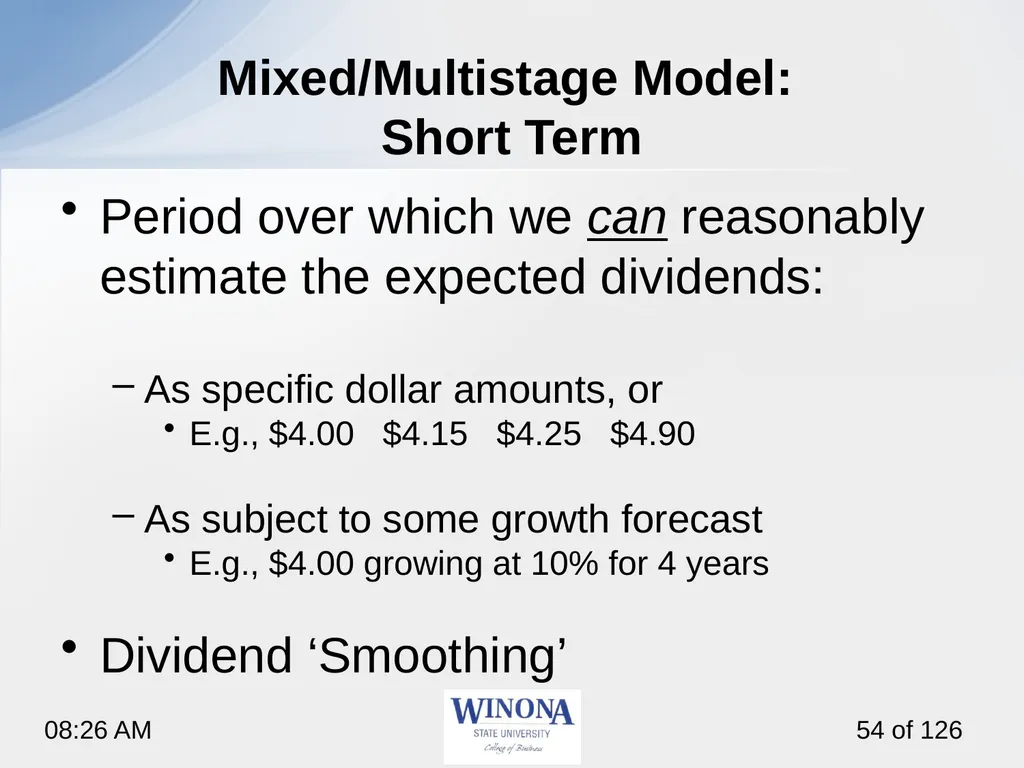
slide54. Mixed/Multistage Model: Short Term Period over which we can reasonably estimate the expected dividends:
As specific dollar amounts, or
E.g., $4.00 $4.15 $4.25 $4.90
As subject to some growth forecast
E.g., $4.00 growing at 10% for 4 years
Dividend ‘Smoothing’<br>
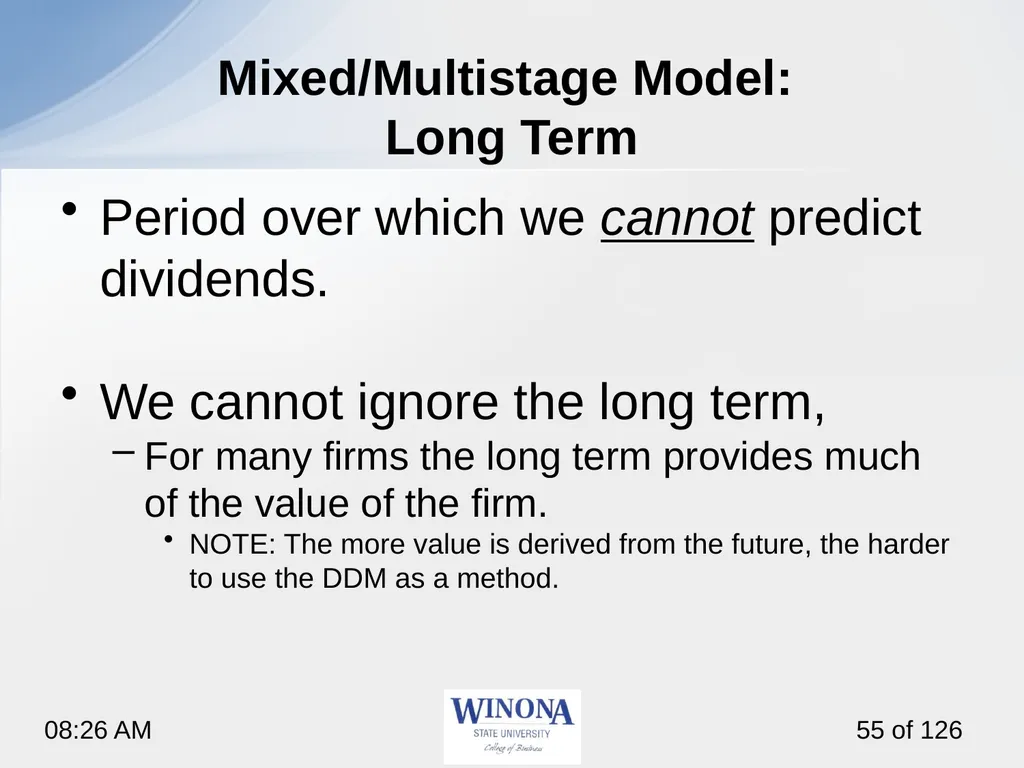
slide55. Mixed/Multistage Model: Long Term Period over which we cannot predict dividends.
We cannot ignore the long term,
For many firms the long term provides much of the value of the firm.
NOTE: The more value is derived from the future, the harder to use the DDM as a method.<br>
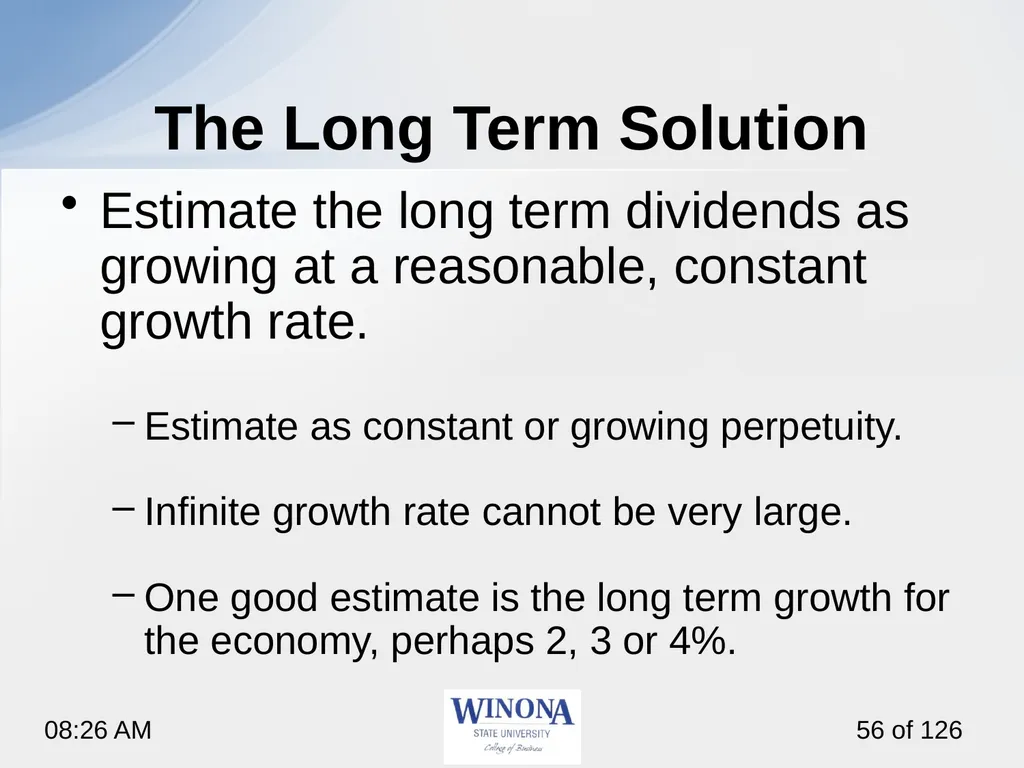
slide56. The Long Term Solution Estimate the long term dividends as growing at a reasonable, constant growth rate.
Estimate as constant or growing perpetuity.
Infinite growth rate cannot be very large.
One good estimate is the long term growth for the economy, perhaps 2, 3 or 4%.<br>
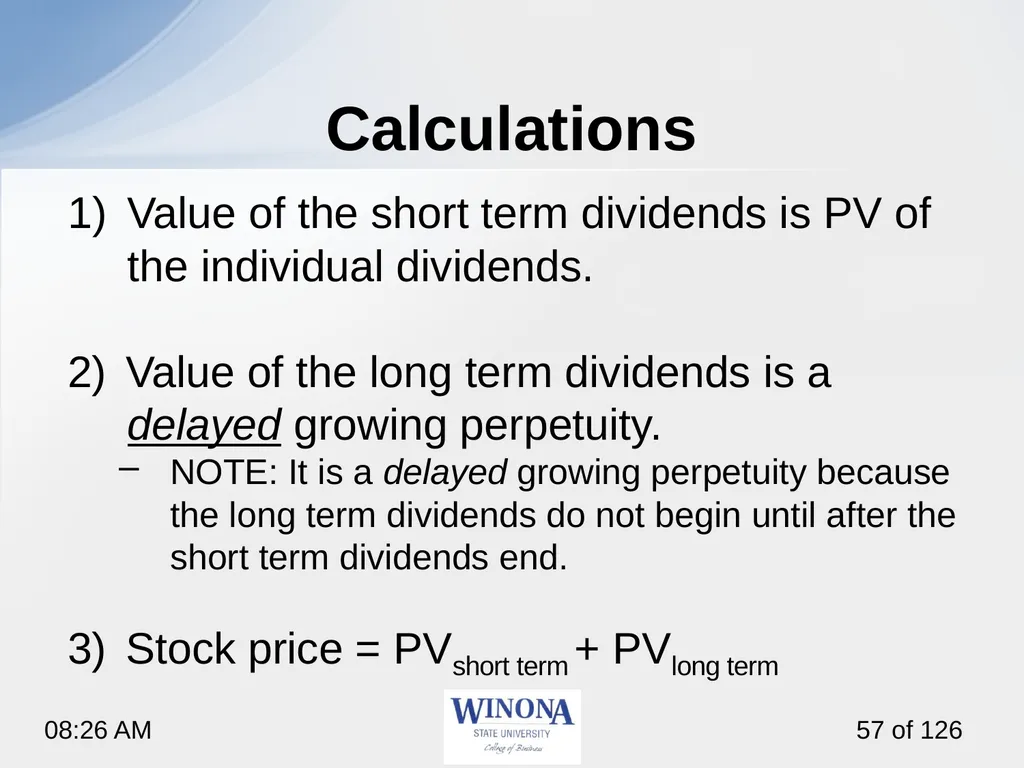
slide57. Calculations Value of the short term dividends is PV of the individual dividends.
2) Value of the long term dividends is a delayed growing perpetuity.
NOTE: It is a delayed growing perpetuity because the long term dividends do not begin until after the short term dividends end.
3) Stock price = PVshort term + PVlong term<br>
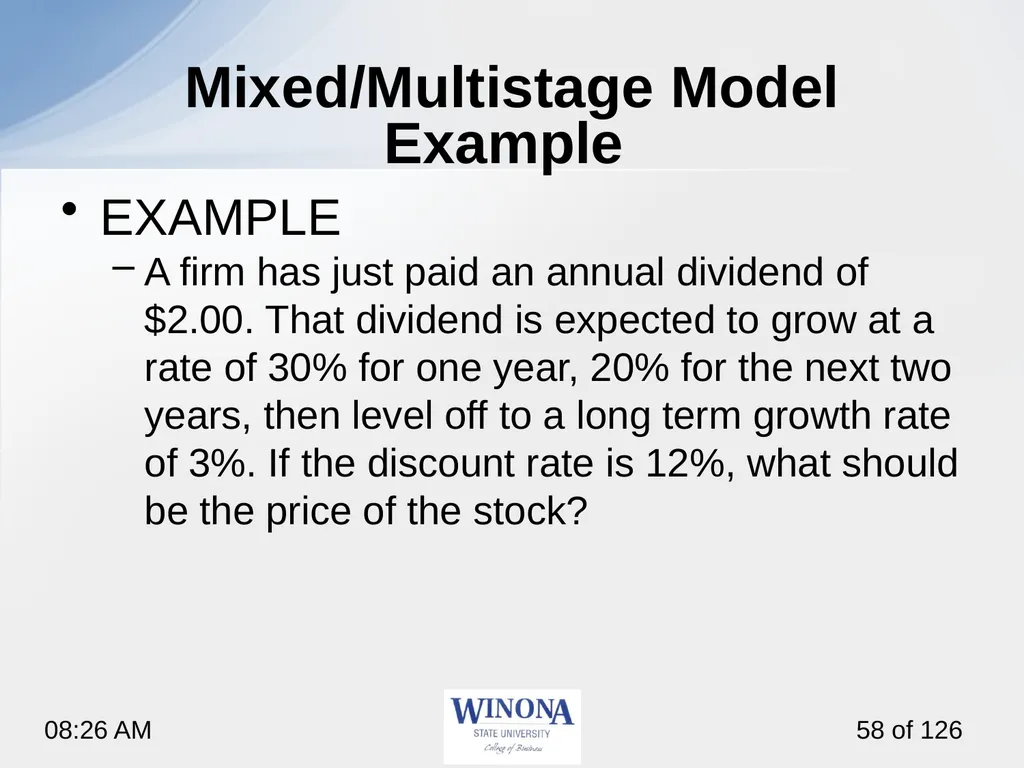
slide58. Mixed/Multistage Model Example EXAMPLE
A firm has just paid an annual dividend of $2.00. That dividend is expected to grow at a rate of 30% for one year, 20% for the next two years, then level off to a long term growth rate of 3%. If the discount rate is 12%, what should be the price of the stock?<br>
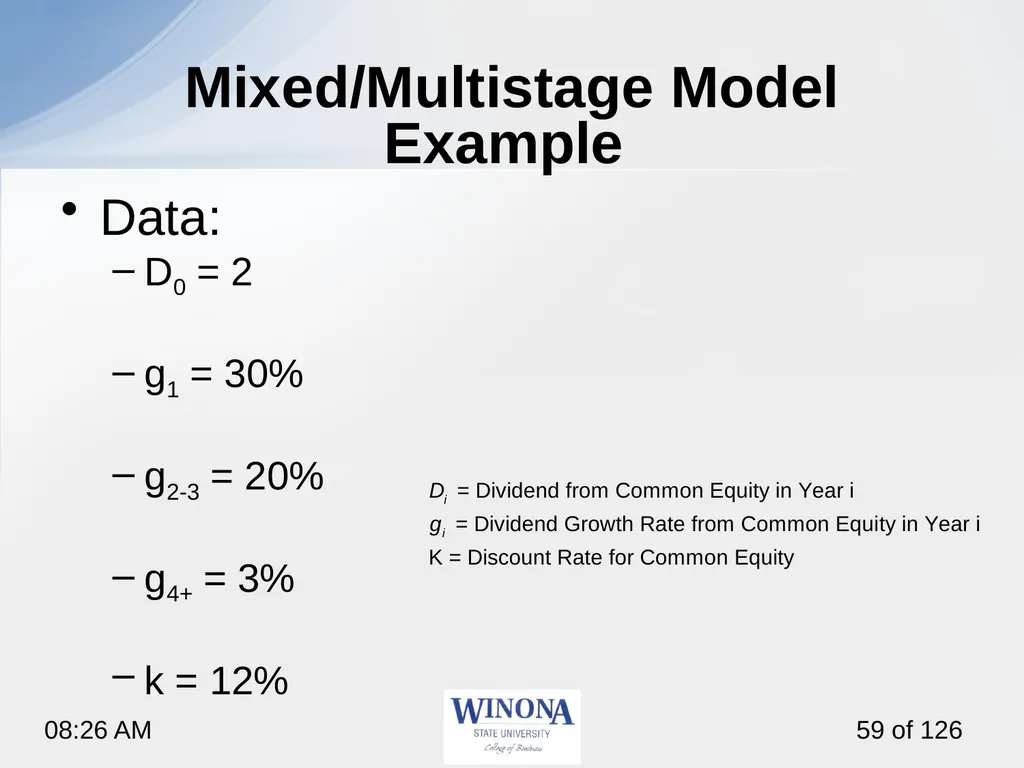
slide59. Mixed/Multistage Model Example Data:
D0 = 2
g1 = 30%
g2-3 = 20%
g4+ = 3%
k = 12%<br>
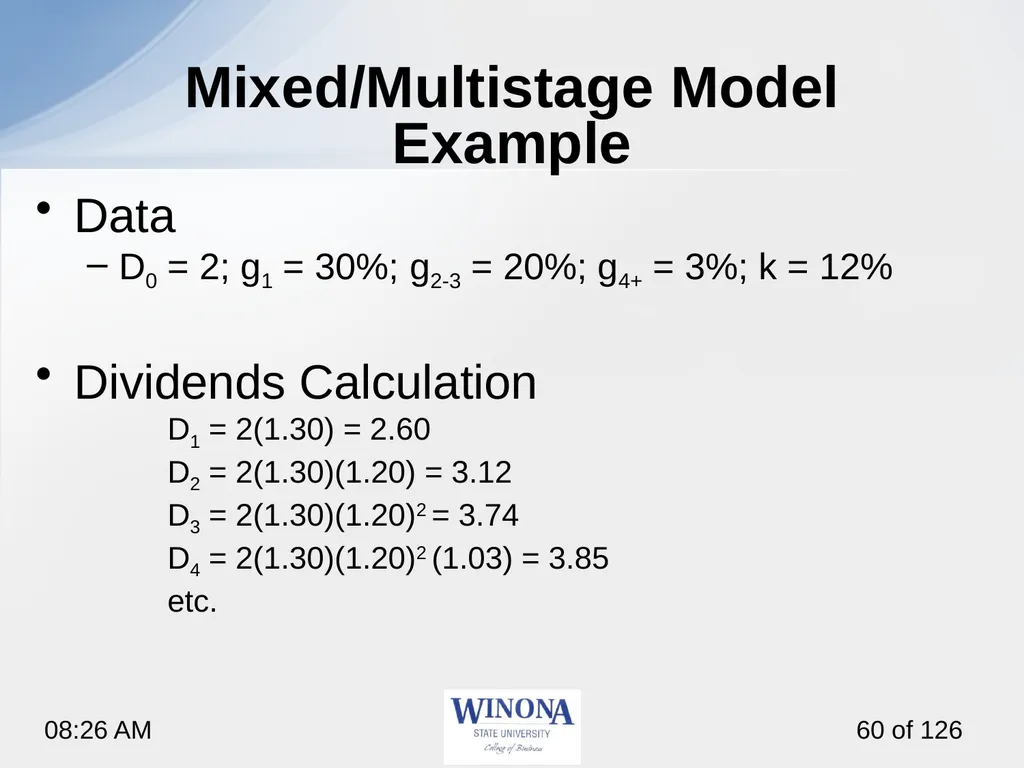
slide60. Mixed/Multistage Model Example Data
D0 = 2; g1 = 30%; g2-3 = 20%; g4+ = 3%; k = 12%
Dividends Calculation
D1 = 2(1.30) = 2.60
D2 = 2(1.30)(1.20) = 3.12
D3 = 2(1.30)(1.20)2 = 3.74
D4 = 2(1.30)(1.20)2 (1.03) = 3.85
etc.<br>
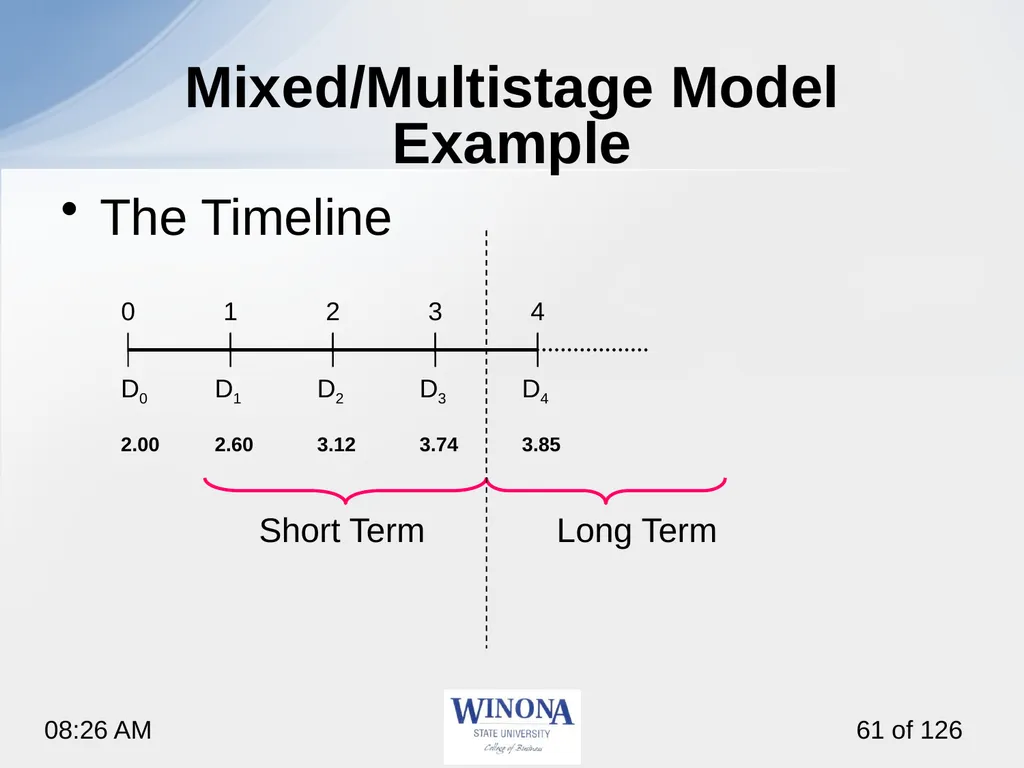
slide61. Mixed/Multistage Model Example The Timeline
Short Term Long Term 0 1 2 3 4 D0 D1 D2 D4 D3 2.00 2.60 3.12 3.85 3.74<br>
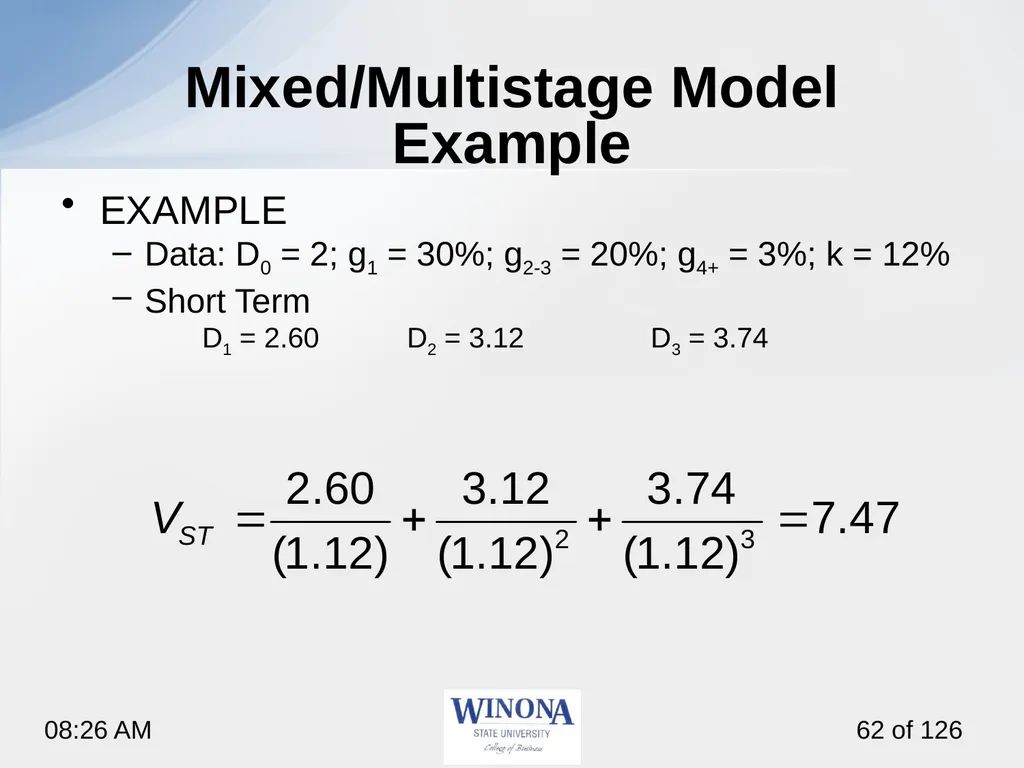
slide62. Mixed/Multistage Model Example EXAMPLE
Data: D0 = 2; g1 = 30%; g2-3 = 20%; g4+ = 3%; k = 12%
Short Term
D1 = 2.60 D2 = 3.12 D3 = 3.74<br>
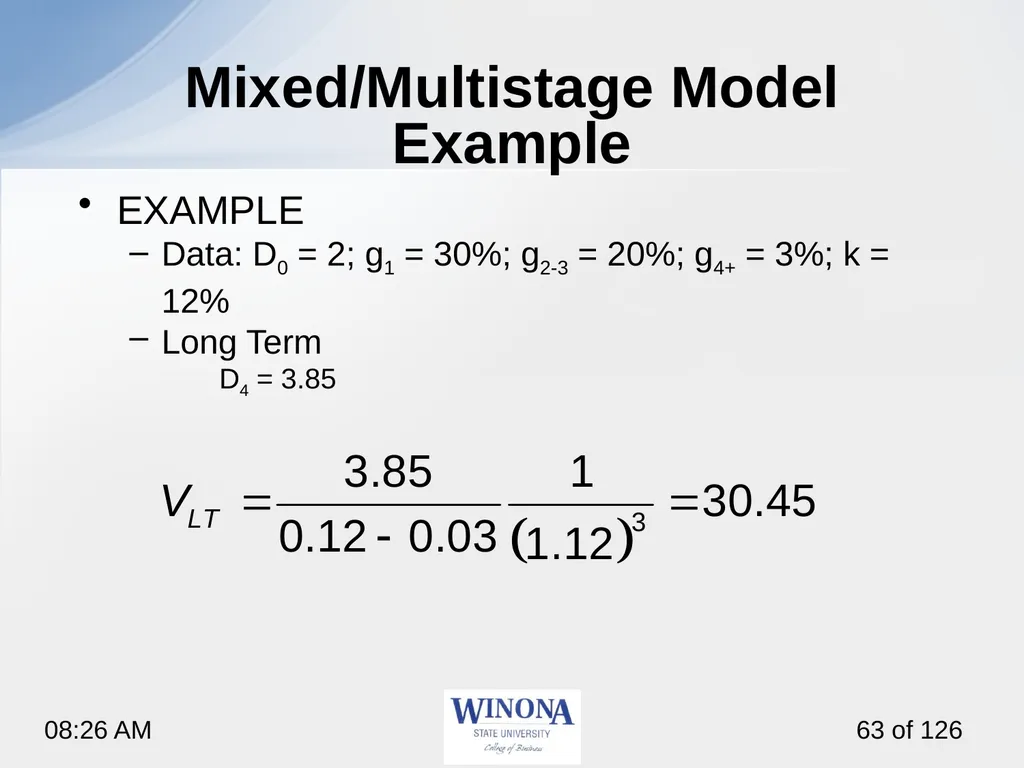
slide63. Mixed/Multistage Model Example EXAMPLE
Data: D0 = 2; g1 = 30%; g2-3 = 20%; g4+ = 3%; k = 12%
Long Term
D4 = 3.85<br>
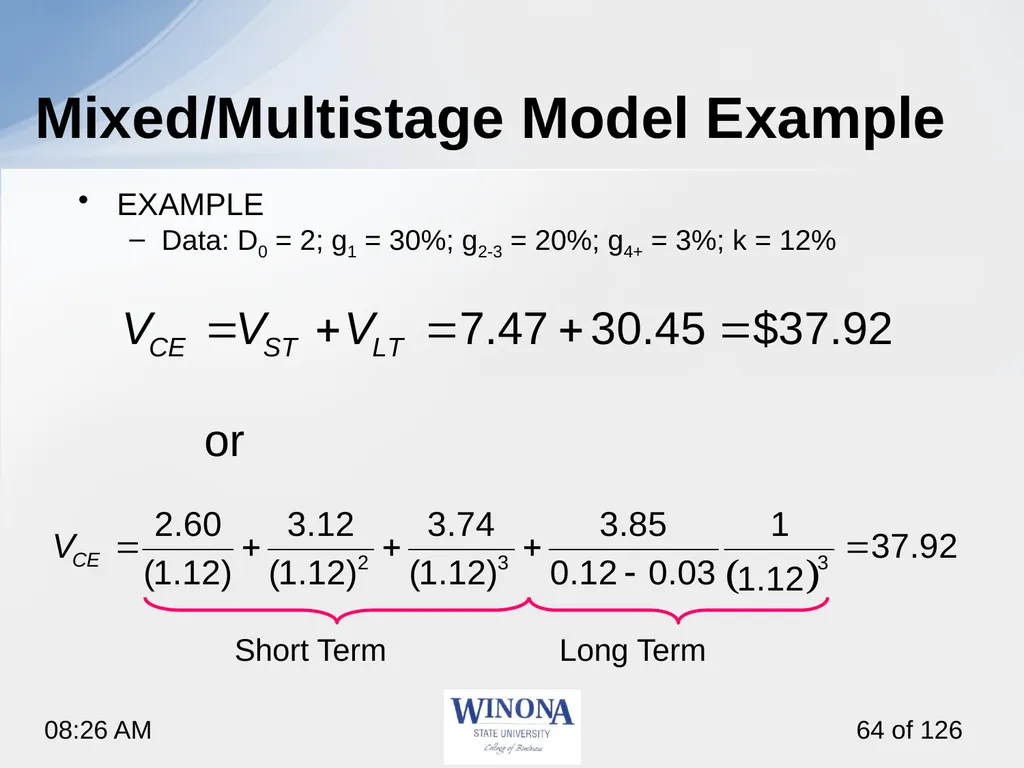
slide64. Mixed/Multistage Model Example EXAMPLE
Data: D0 = 2; g1 = 30%; g2-3 = 20%; g4+ = 3%; k = 12%
or
Short Term Long Term<br>
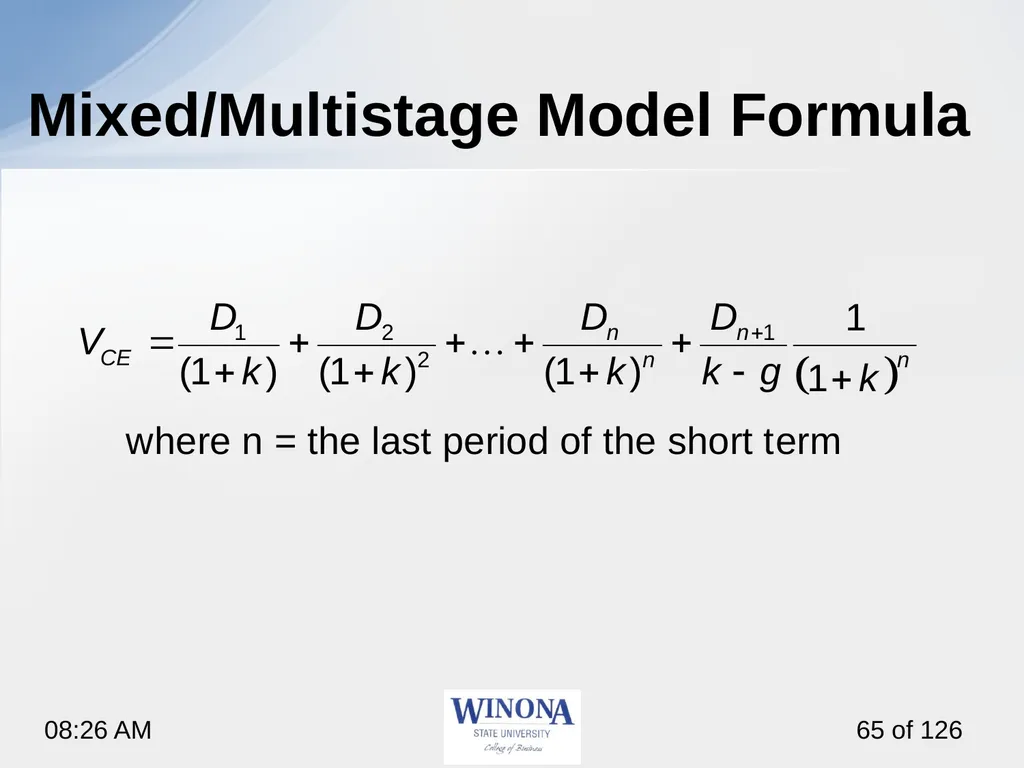
slide65. Mixed/Multistage Model Formula<br>
slide66. 8.2/3 Discounted Cash Flow Free Cash Flow to Equity (FCFE)<br>
slide67. Free Cash Flow to Equity (FCFE)
CFs available to distribute to equity investors
‘Potential’ Dividend Midel
Value: Total Equity of Firm
Discount rate: Cost of equity
Free Cash Flow to the Firm (FCFF)
CFs available to distribute to all investors
Value: Total Value of Firm
Discount rate: WACC FCFF and FCFE<br>
slide68. Free Cash Flow to Equity: The Improved DDM FCFE: Free cash flow available to stockholders after payments to all other capital suppliers and after providing for the continued growth of the firm
More general version of the dividend discount model<br>
slide69. Firm not dividend paying
Dividends differ significantly from capacity to pay dividends
Investor takes a control perspective FCFE Motivation<br>
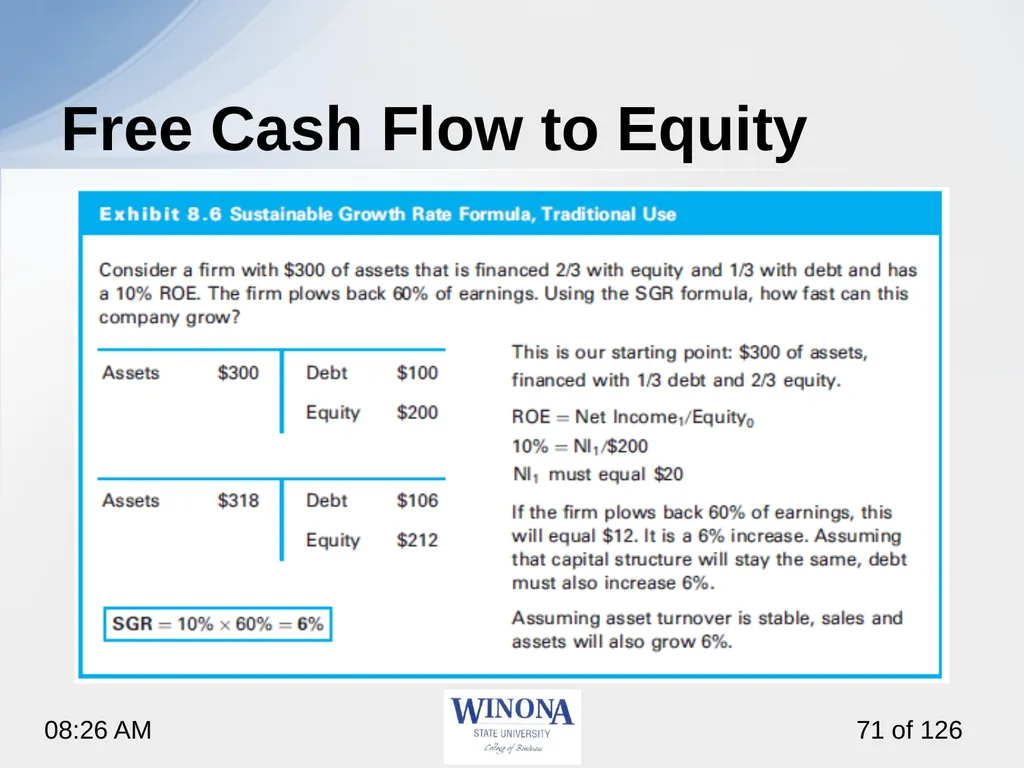
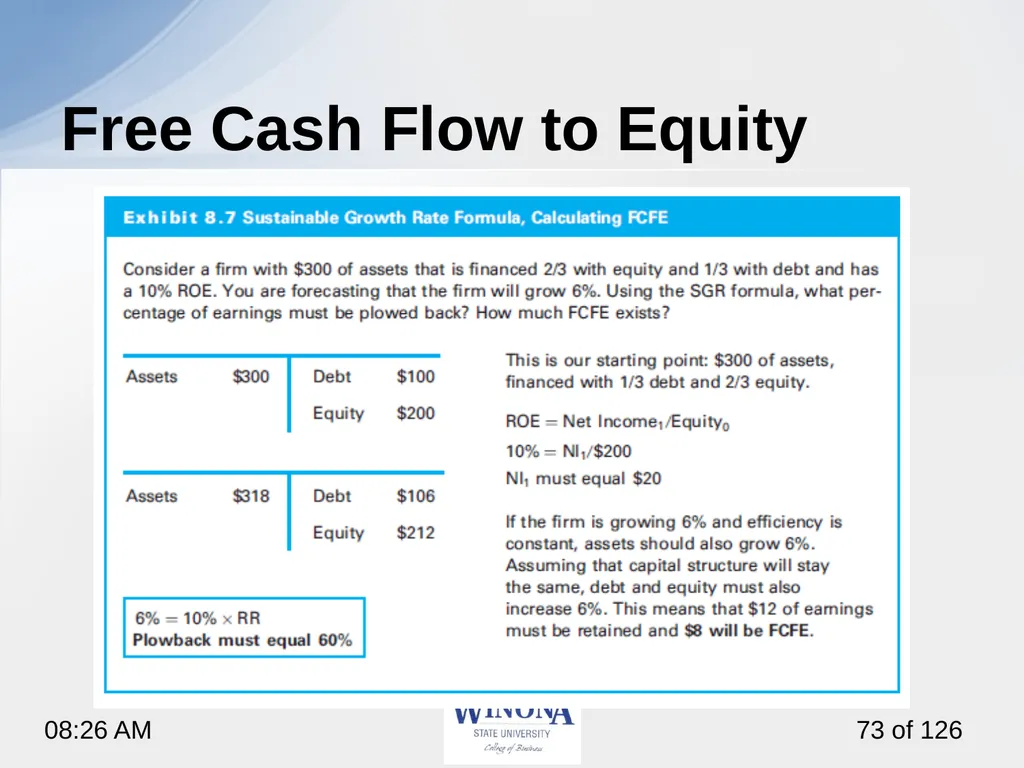
slide70. Free Cash Flow to Equity Retention rate (b) is the percentage of earnings that are retained or plowed back
The sustainable growth rate :
g = ROE x b
Assumptions:
Firm maintains ROE
Firm maintains b<br>
slide71. Free Cash Flow to Equity<br>
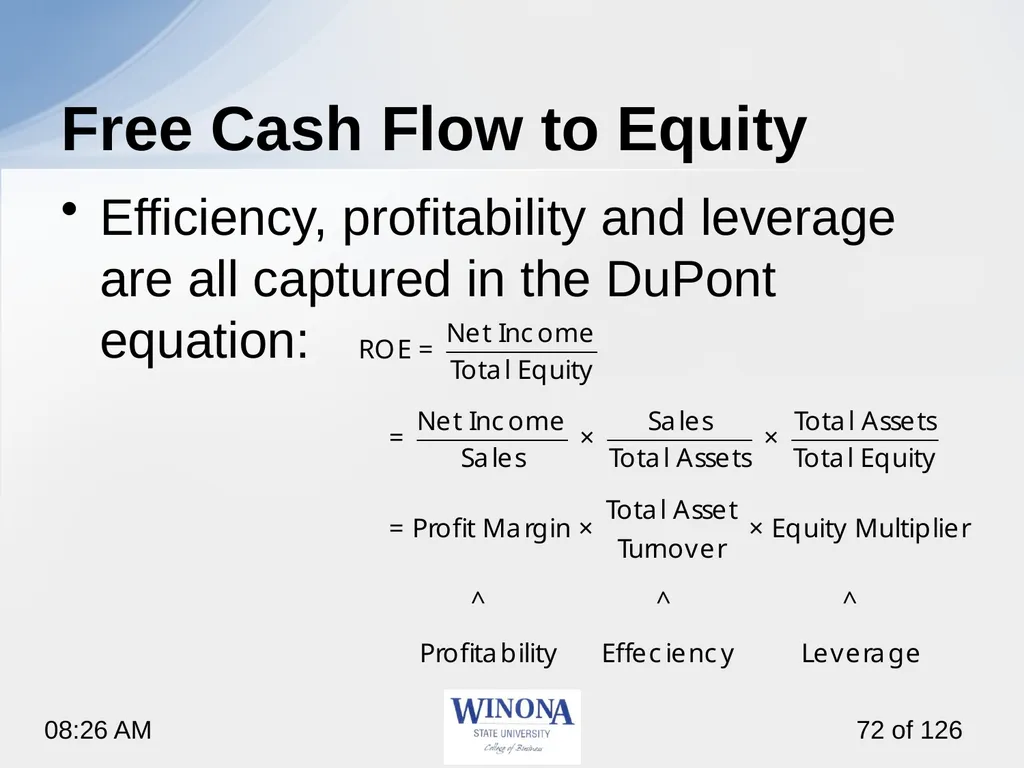
slide72. Free Cash Flow to Equity Efficiency, profitability and leverage are all captured in the DuPont equation:<br>
slide73. Free Cash Flow to Equity<br>
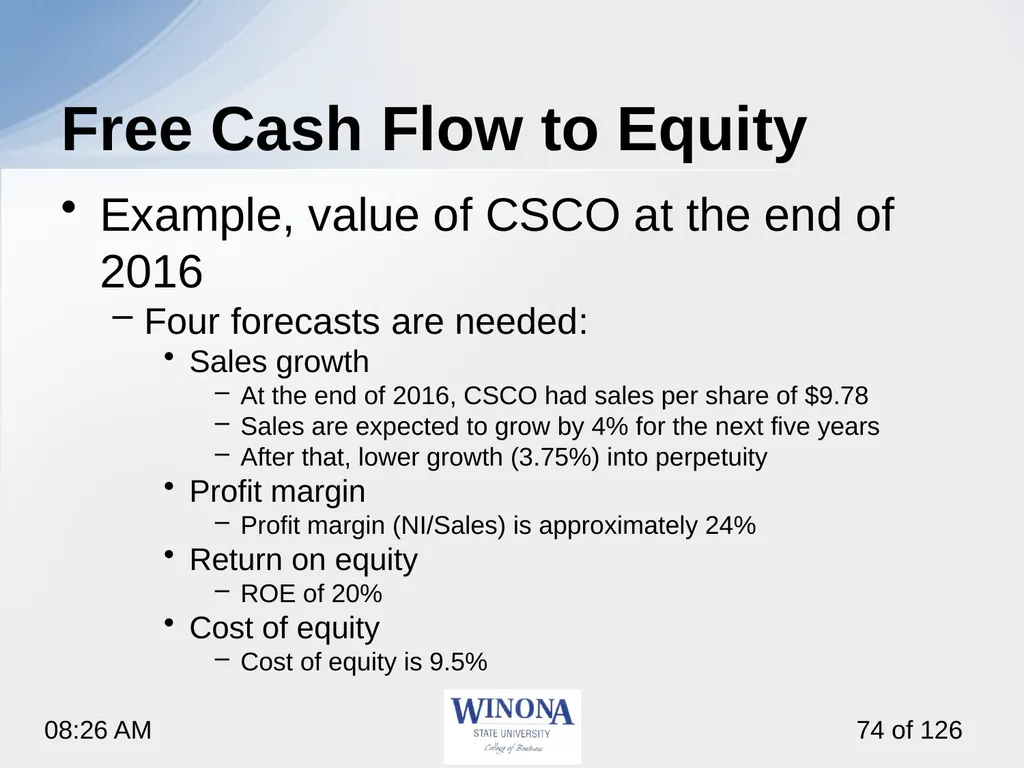
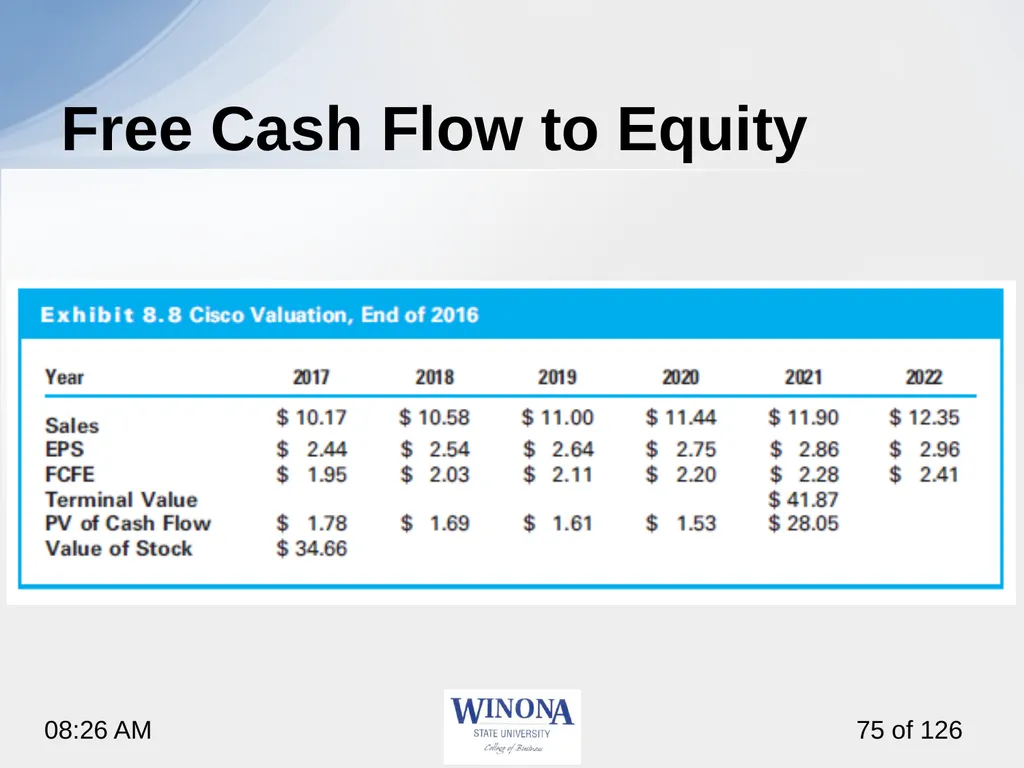
slide74. Free Cash Flow to Equity Example, value of CSCO at the end of 2016
Four forecasts are needed:
Sales growth
At the end of 2016, CSCO had sales per share of $9.78
Sales are expected to grow by 4% for the next five years
After that, lower growth (3.75%) into perpetuity
Profit margin
Profit margin (NI/Sales) is approximately 24%
Return on equity
ROE of 20%
Cost of equity
Cost of equity is 9.5%<br>
slide75. Free Cash Flow to Equity<br>
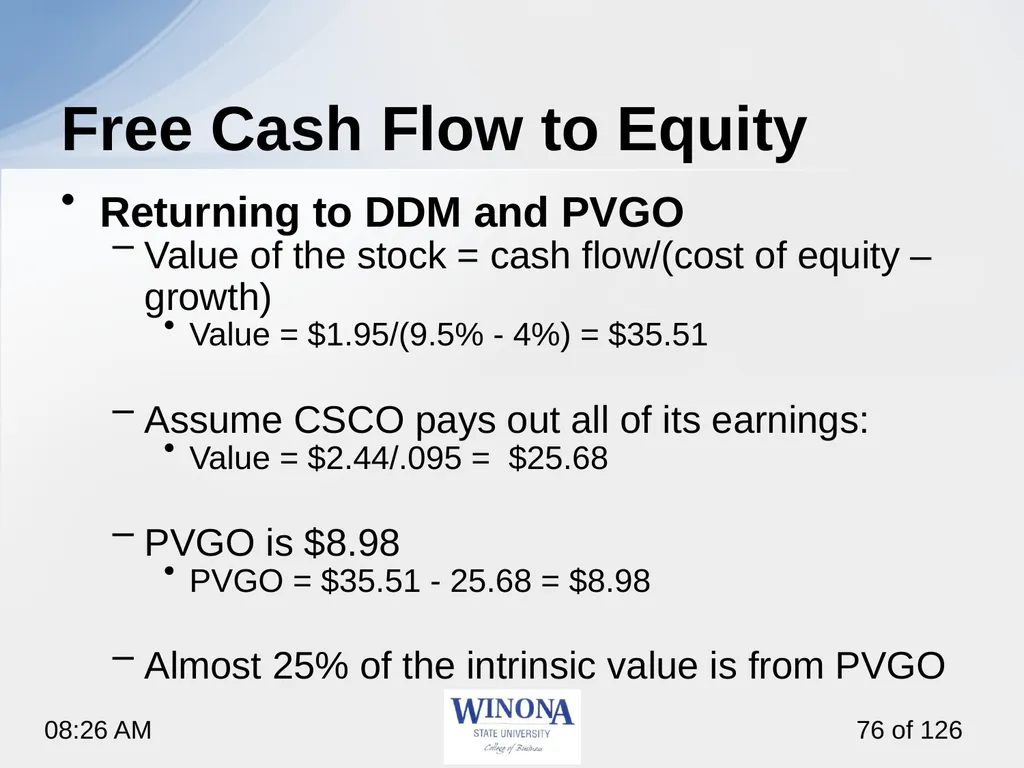
slide76. Free Cash Flow to Equity Returning to DDM and PVGO
Value of the stock = cash flow/(cost of equity – growth)
Value = $1.95/(9.5% - 4%) = $35.51
Assume CSCO pays out all of its earnings:
Value = $2.44/.095 = $25.68
PVGO is $8.98
PVGO = $35.51 - 25.68 = $8.98
Almost 25% of the intrinsic value is from PVGO<br>
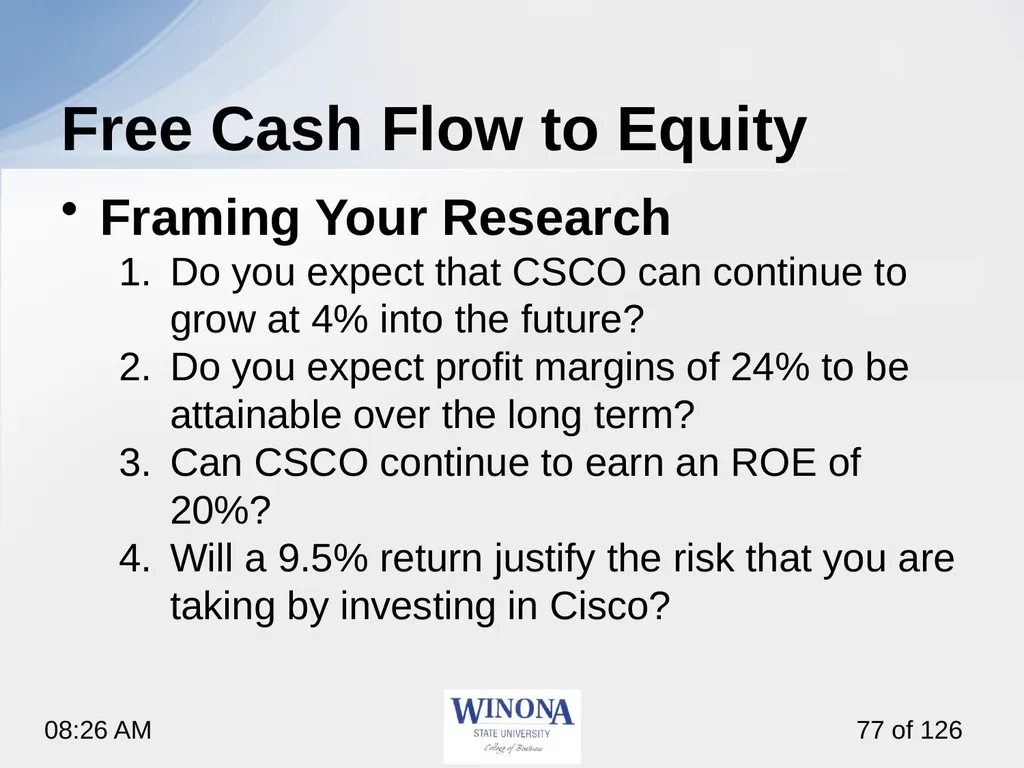
slide77. Free Cash Flow to Equity Framing Your Research
Do you expect that CSCO can continue to grow at 4% into the future?
Do you expect profit margins of 24% to be attainable over the long term?
Can CSCO continue to earn an ROE of 20%?
Will a 9.5% return justify the risk that you are taking by investing in Cisco?<br>
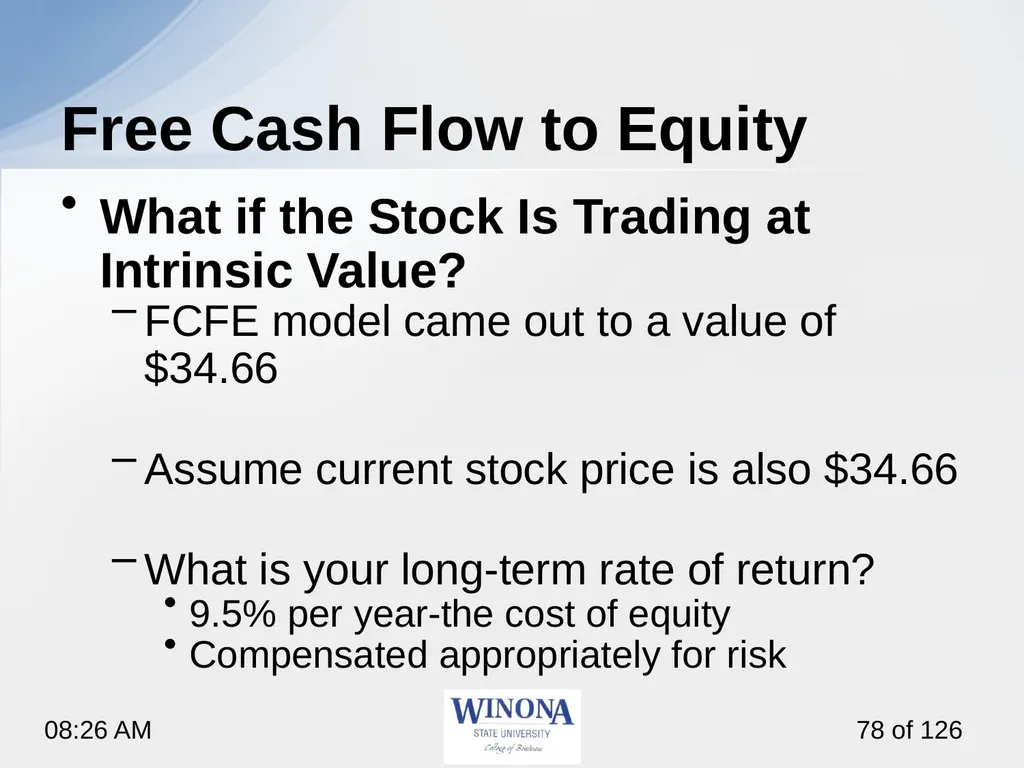
slide78. Free Cash Flow to Equity What if the Stock Is Trading at Intrinsic Value?
FCFE model came out to a value of $34.66
Assume current stock price is also $34.66
What is your long-term rate of return?
9.5% per year-the cost of equity
Compensated appropriately for risk<br>
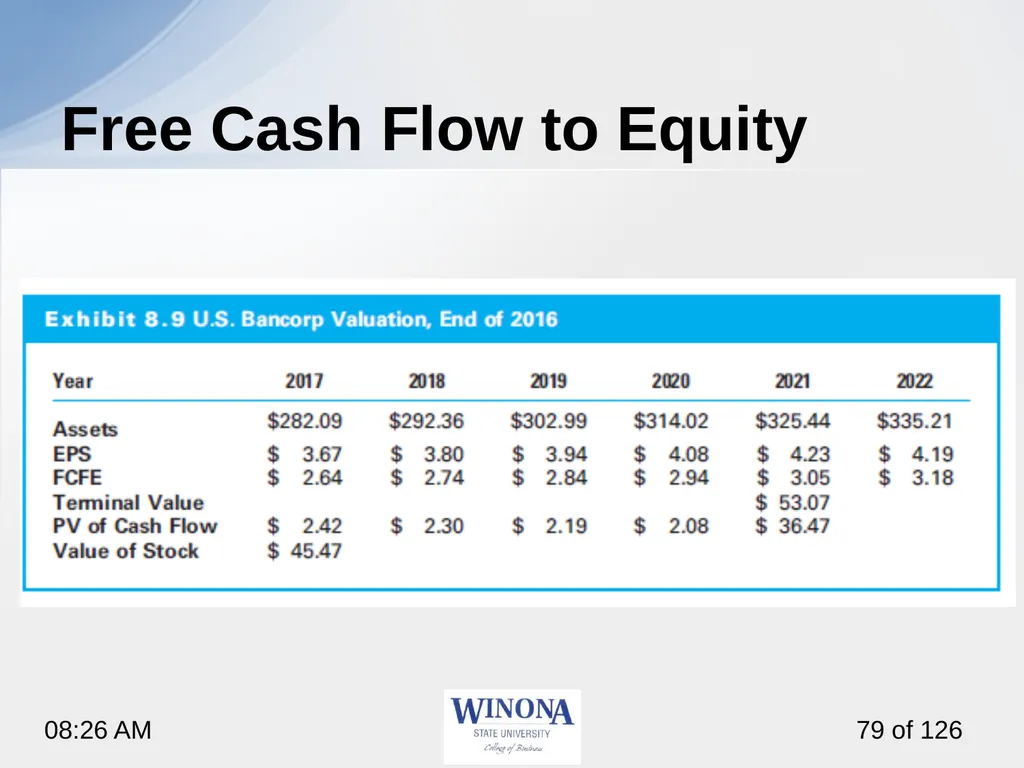
slide79. Free Cash Flow to Equity<br>
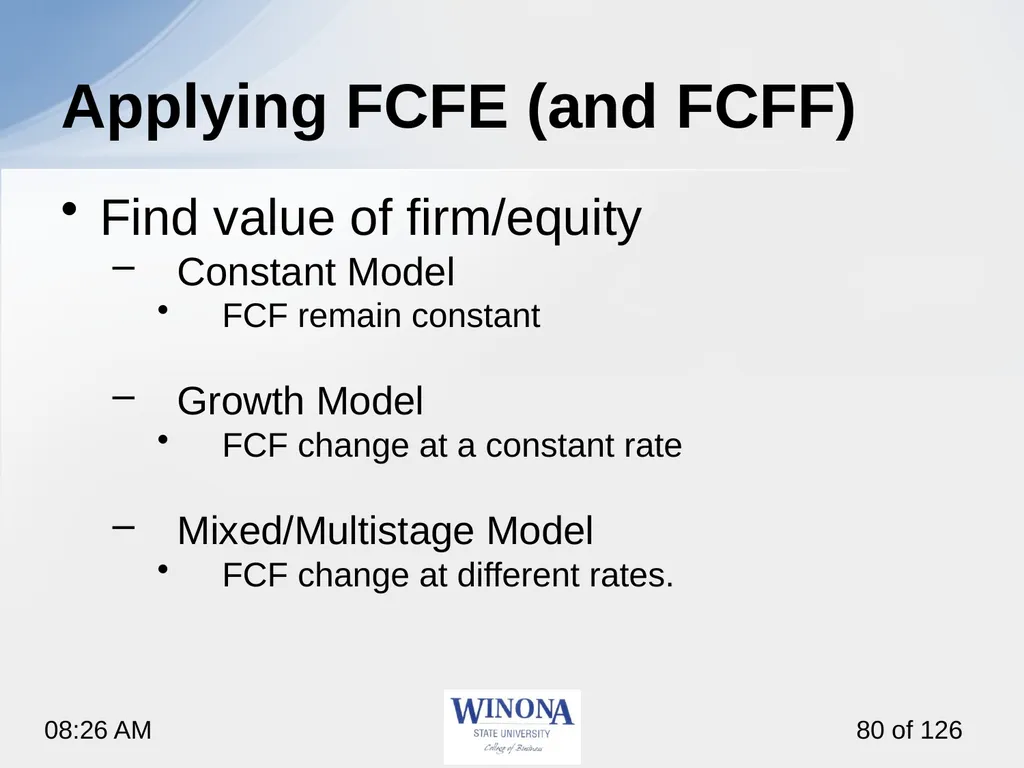
slide80. Find value of firm/equity
Constant Model
FCF remain constant
Growth Model
FCF change at a constant rate
Mixed/Multistage Model
FCF change at different rates. Applying FCFE (and FCFF)<br>
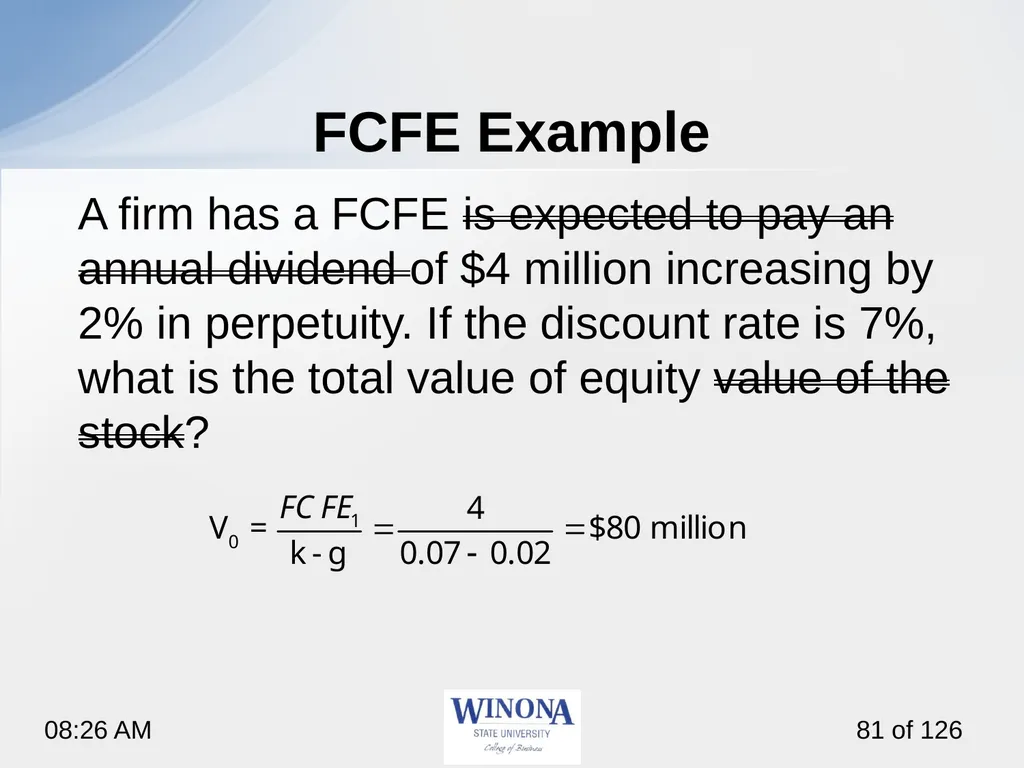
slide81. FCFE Example A firm has a FCFE is expected to pay an annual dividend of $4 million increasing by 2% in perpetuity. If the discount rate is 7%, what is the total value of equity value of the stock?<br>
slide82. 8.2/3 Discounted Cash Flow Free Cash Flow to Firm (FCFF)<br>
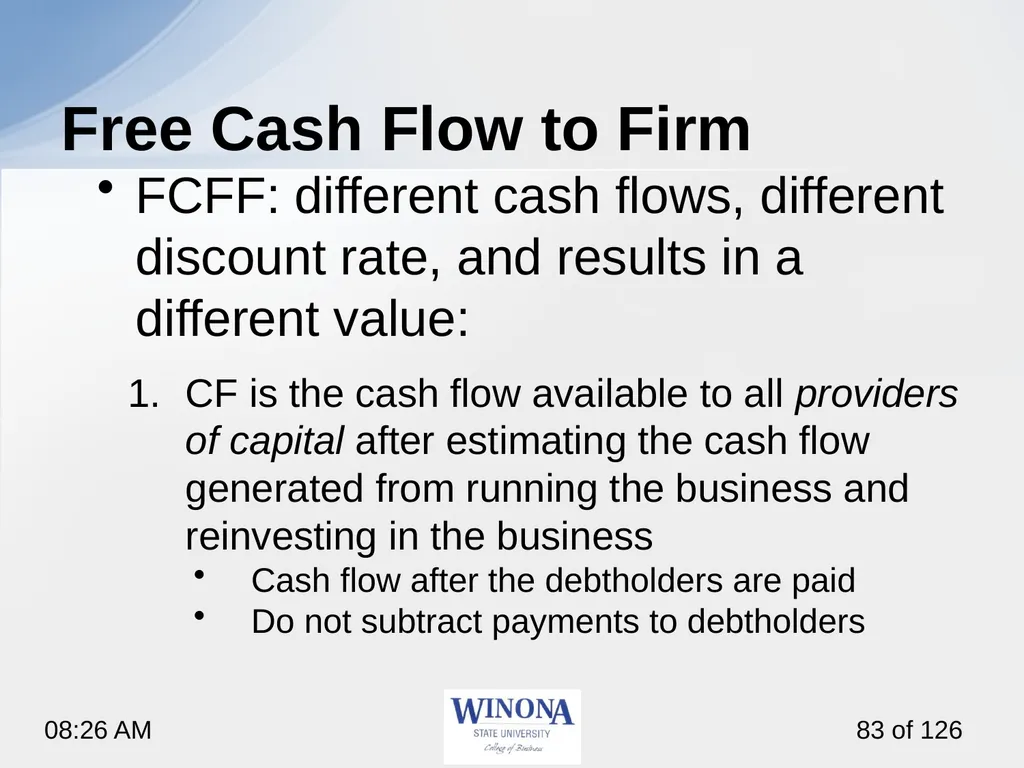
slide83. Free Cash Flow to Firm FCFF: different cash flows, different discount rate, and results in a different value:
CF is the cash flow available to all providers of capital after estimating the cash flow generated from running the business and reinvesting in the business
Cash flow after the debtholders are paid
Do not subtract payments to debtholders<br>
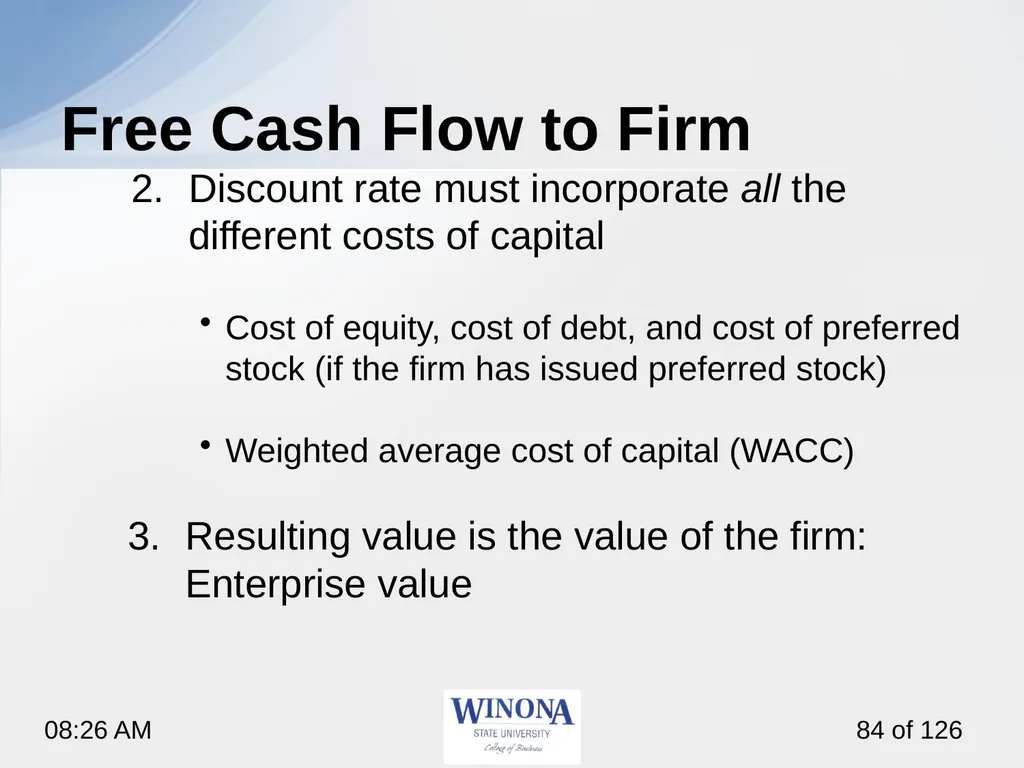
slide84. Free Cash Flow to Firm Discount rate must incorporate all the different costs of capital
Cost of equity, cost of debt, and cost of preferred stock (if the firm has issued preferred stock)
Weighted average cost of capital (WACC)
Resulting value is the value of the firm: Enterprise value<br>
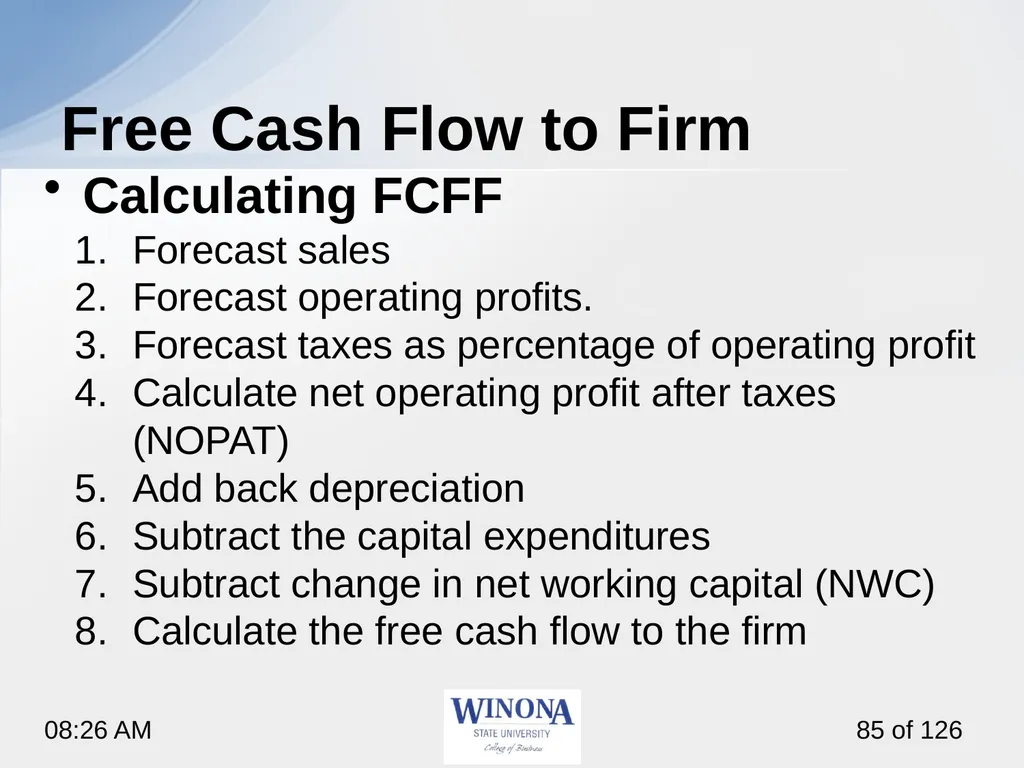
slide85. Free Cash Flow to Firm Calculating FCFF
Forecast sales
Forecast operating profits.
Forecast taxes as percentage of operating profit
Calculate net operating profit after taxes (NOPAT)
Add back depreciation
Subtract the capital expenditures
Subtract change in net working capital (NWC)
Calculate the free cash flow to the firm<br>
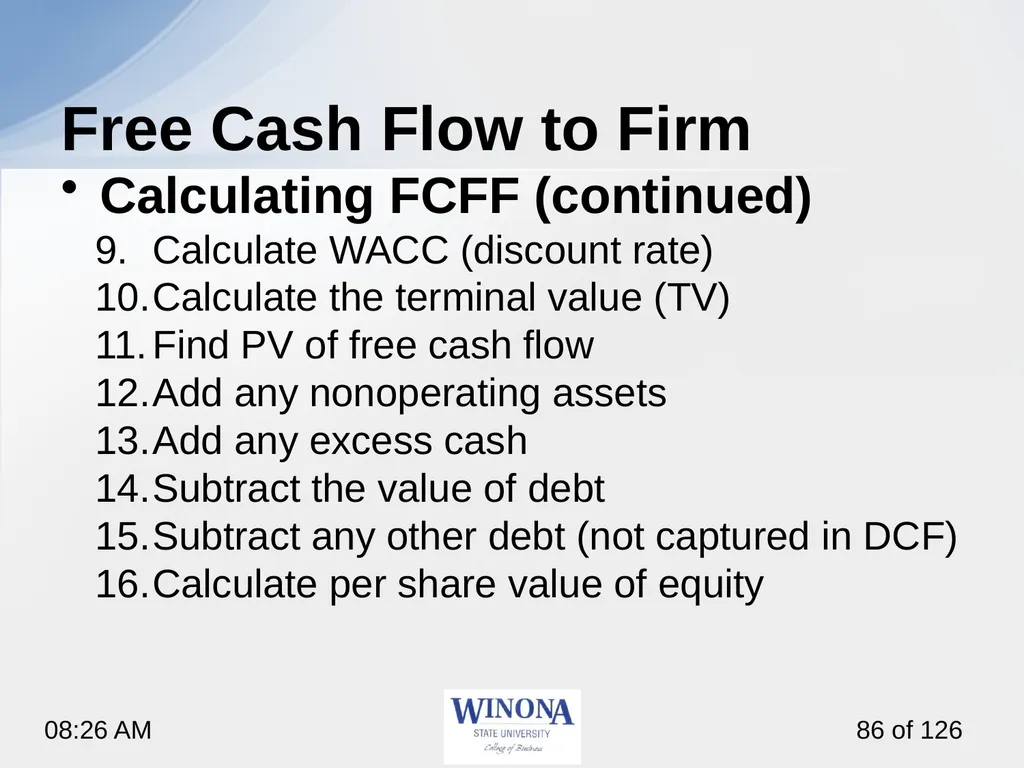
slide86. Free Cash Flow to Firm Calculating FCFF (continued)
Calculate WACC (discount rate)
Calculate the terminal value (TV)
Find PV of free cash flow
Add any nonoperating assets
Add any excess cash
Subtract the value of debt
Subtract any other debt (not captured in DCF)
Calculate per share value of equity<br>
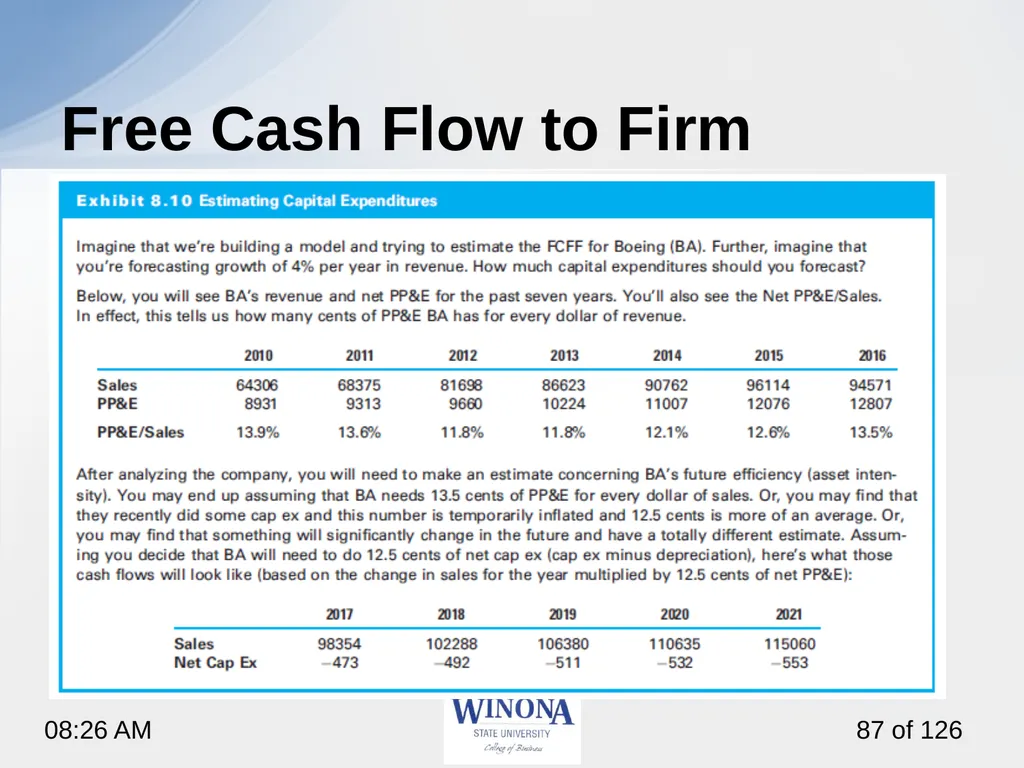
slide87. Free Cash Flow to Firm<br>
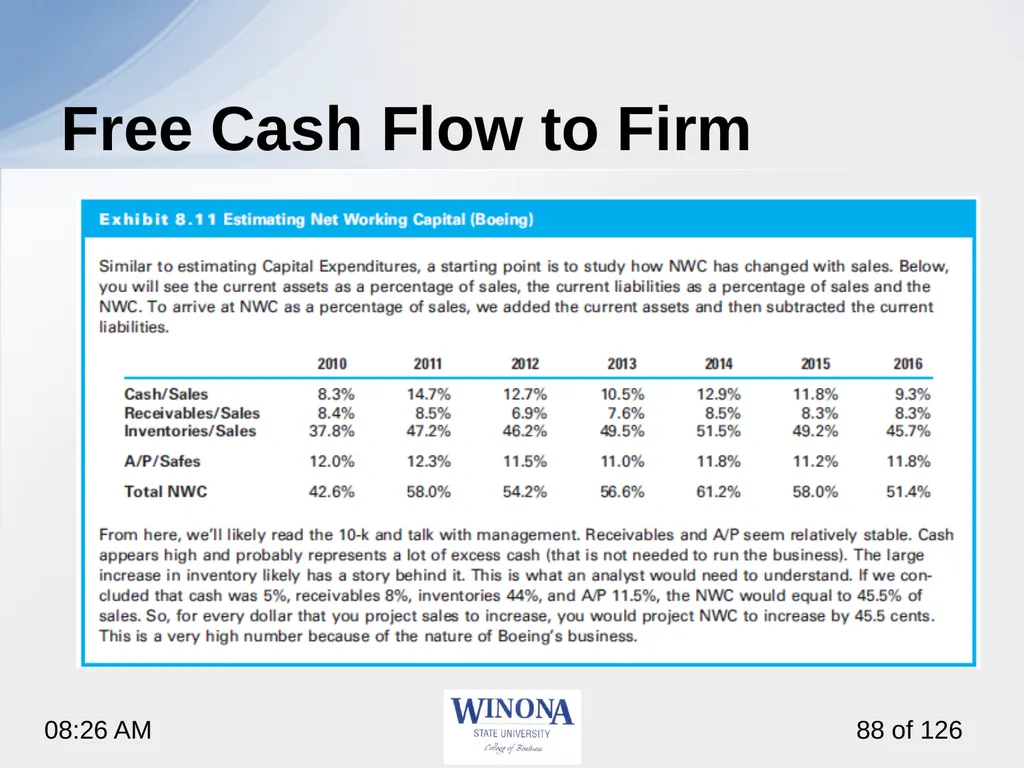
slide88. Free Cash Flow to Firm<br>
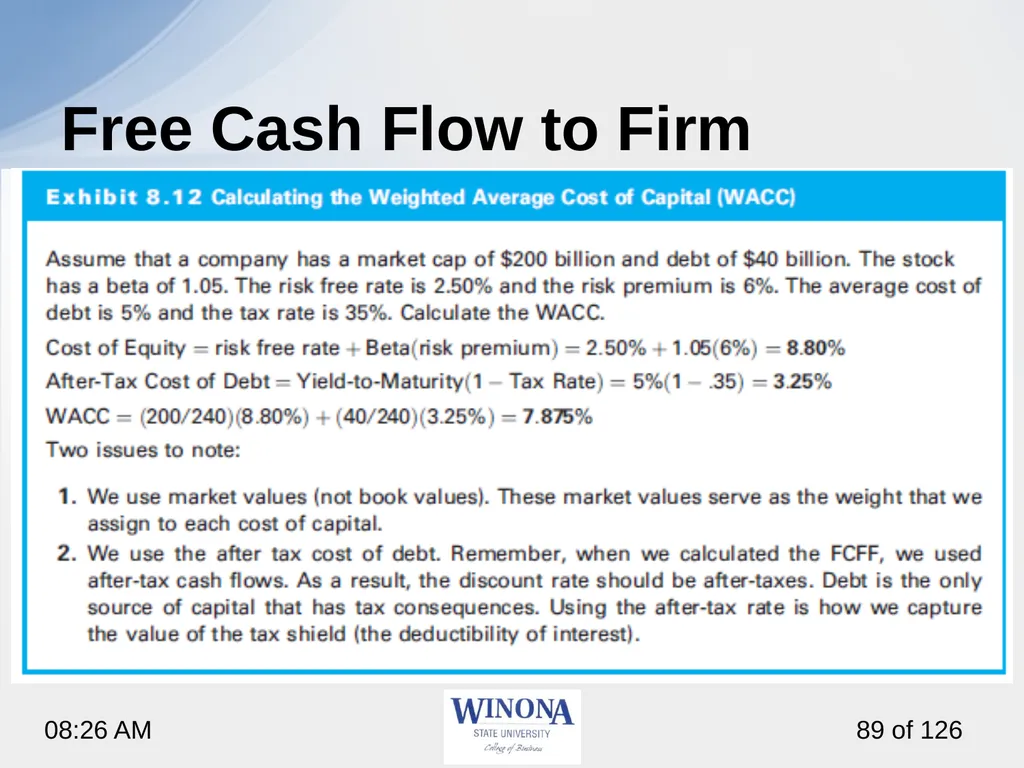
slide89. Free Cash Flow to Firm<br>
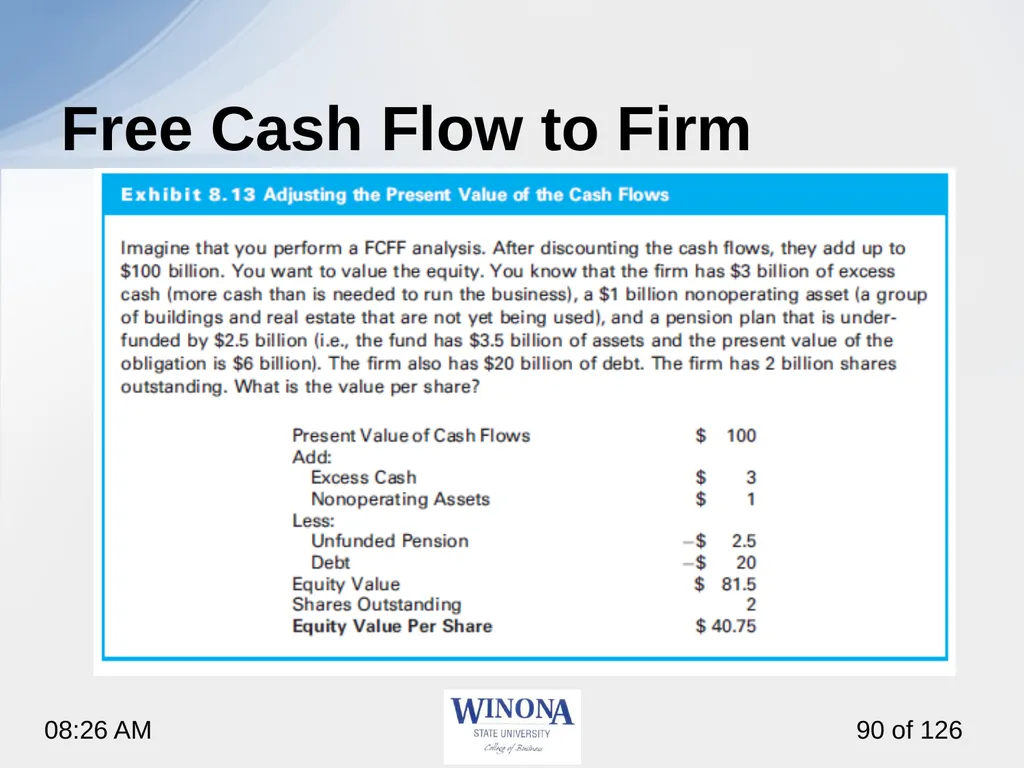
slide90. Free Cash Flow to Firm<br>
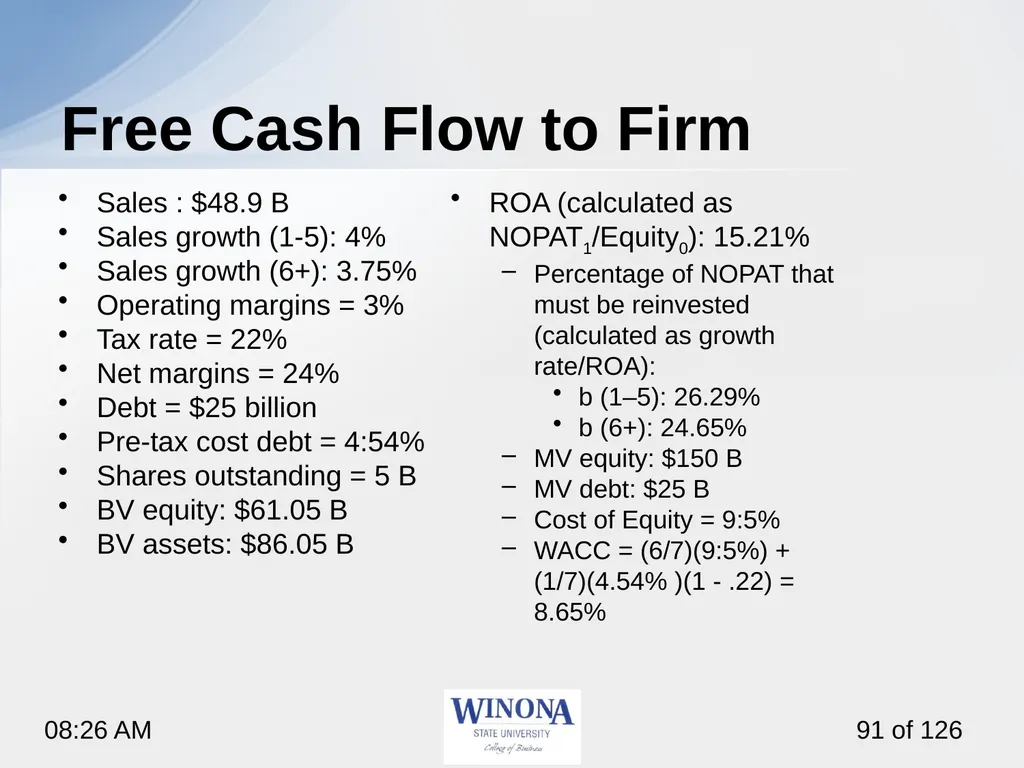
slide91. Free Cash Flow to Firm Sales : $48.9 B
Sales growth (1-5): 4%
Sales growth (6+): 3.75%
Operating margins = 3%
Tax rate = 22%
Net margins = 24%
Debt = $25 billion
Pre-tax cost debt = 4:54%
Shares outstanding = 5 B
BV equity: $61.05 B
BV assets: $86.05 B
ROA (calculated as NOPAT1/Equity0): 15.21%
Percentage of NOPAT that must be reinvested (calculated as growth rate/ROA):
b (1–5): 26.29%
b (6+): 24.65%
MV equity: $150 B
MV debt: $25 B
Cost of Equity = 9:5%
WACC = (6/7)(9:5%) + (1/7)(4.54% )(1 - .22) = 8.65%<br>
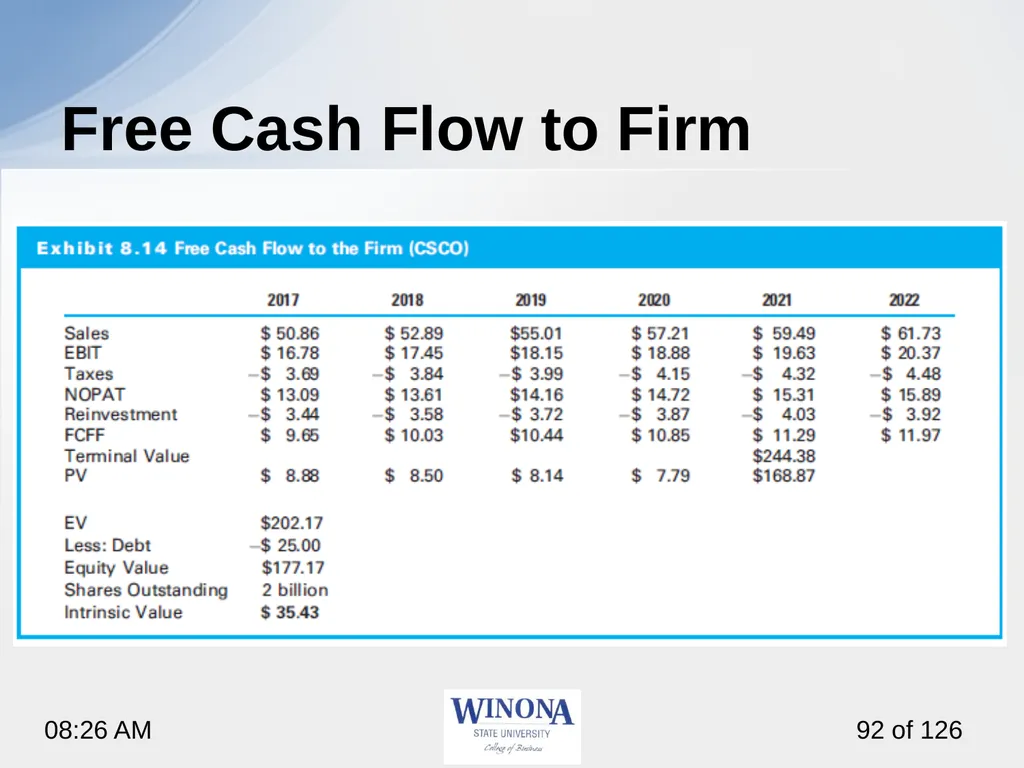
slide92. Free Cash Flow to Firm<br>
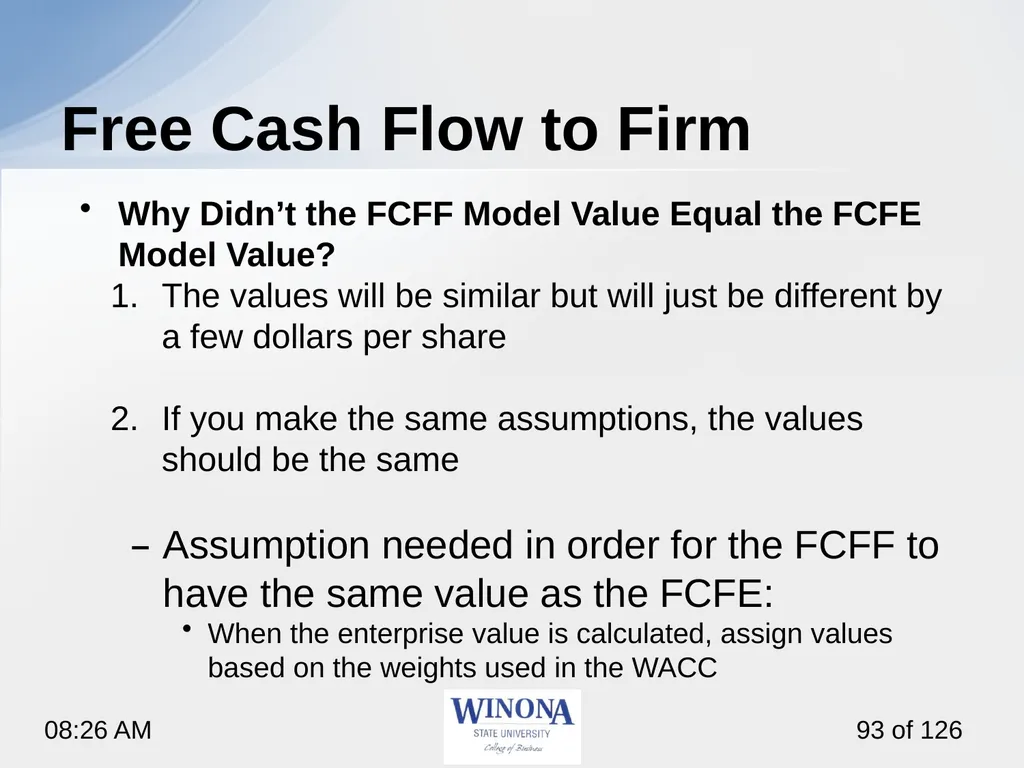
slide93. Free Cash Flow to Firm Why Didn’t the FCFF Model Value Equal the FCFE Model Value?
The values will be similar but will just be different by a few dollars per share
If you make the same assumptions, the values should be the same
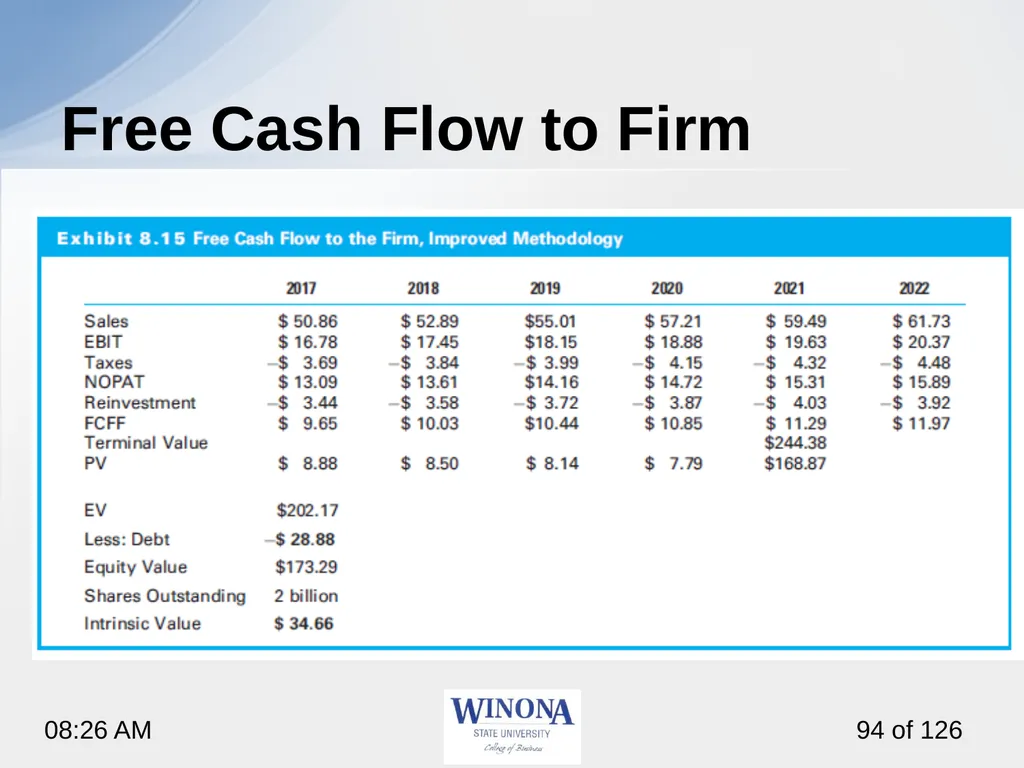
Assumption needed in order for the FCFF to have the same value as the FCFE:
When the enterprise value is calculated, assign values based on the weights used in the WACC<br>
slide94. Free Cash Flow to Firm<br>
slide95. 8.4 Relative Valuation<br>
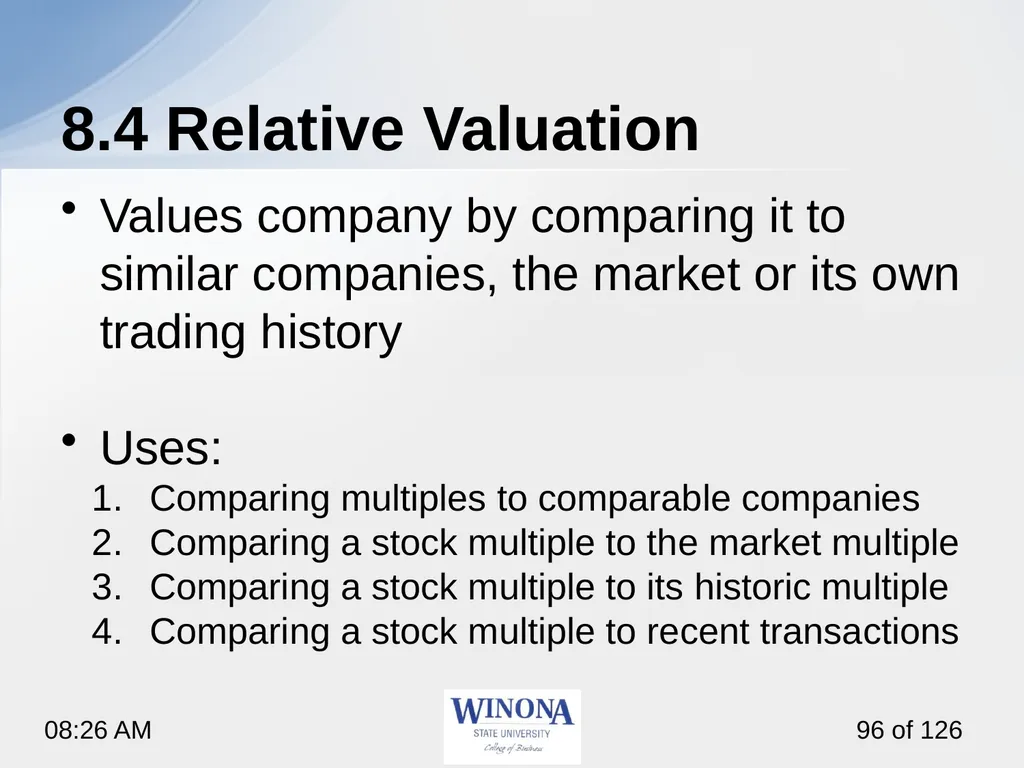
slide96. 8.4 Relative Valuation Values company by comparing it to similar companies, the market or its own trading history
Uses:
Comparing multiples to comparable companies
Comparing a stock multiple to the market multiple
Comparing a stock multiple to its historic multiple
Comparing a stock multiple to recent transactions<br>
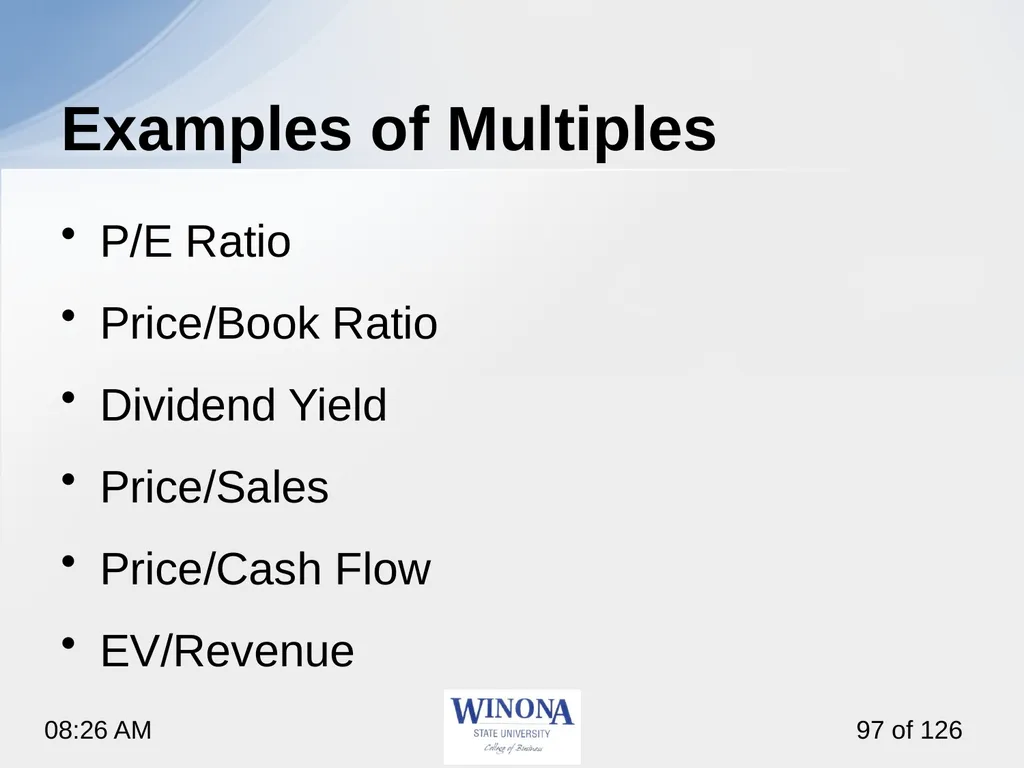
slide97. Examples of Multiples P/E Ratio
Price/Book Ratio
Dividend Yield
Price/Sales
Price/Cash Flow
EV/Revenue<br>
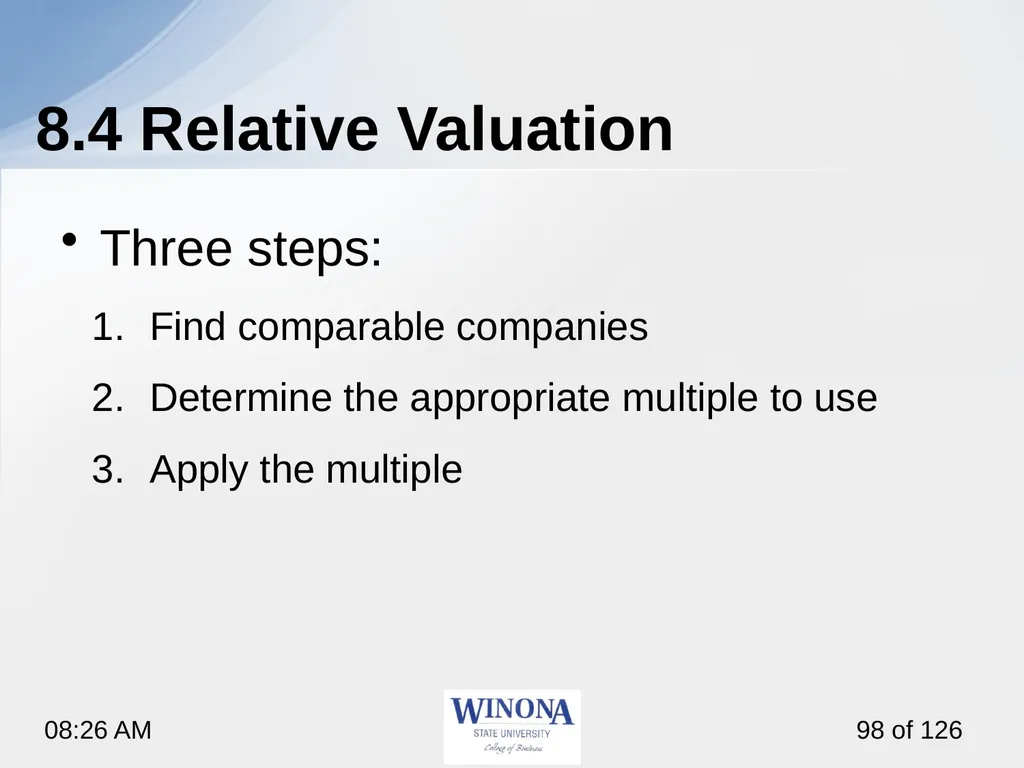
slide98. 8.4 Relative Valuation Three steps:
Find comparable companies
Determine the appropriate multiple to use
Apply the multiple<br>
slide99. 8.4.1 Implementing Relative Valuation Step 1: Find Comparable Companies
Factors that make the business similar or different
Business risk perspective or financial risk perspective<br>
slide100. 8.4.1 Implementing Relative Valuation Step 2: Determine the Appropriate Multiple
Determine which multiple to use
Understand what multiples other analysts use
What underlying metric seems to move a stock
Step 3: Apply the Multiple
An analyst must understand the fundamentals that drive multiples: fundamental multiples
Price-earnings, price-sales, and price-book value<br>
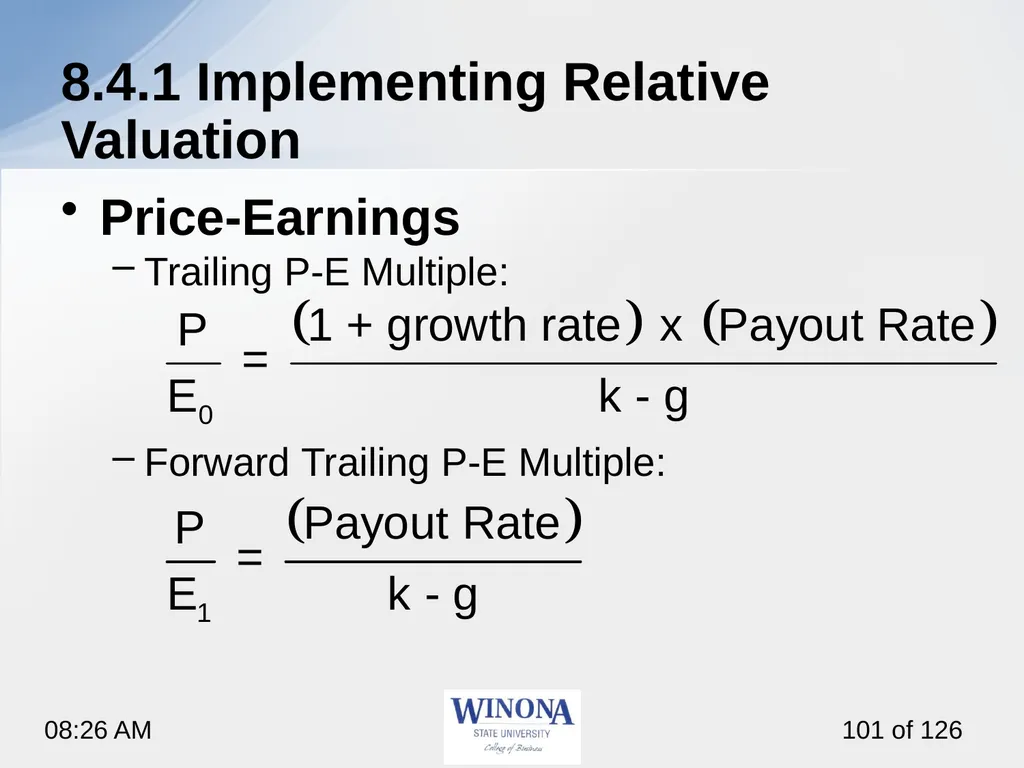
slide101. 8.4.1 Implementing Relative Valuation Price-Earnings
Trailing P-E Multiple:
Forward Trailing P-E Multiple:<br>
slide102. 8.4.1 Implementing Relative Valuation Price-Earnings (continued)
Pay more for a dollar of earnings if:
Those earnings will grow at a higher rate
The company is more efficient
The cash flows are lower risk
P-E multiple should be higher
if growth (g) is higher,
If payout ratio is higher, or
If cost of equity (r) is lower<br>
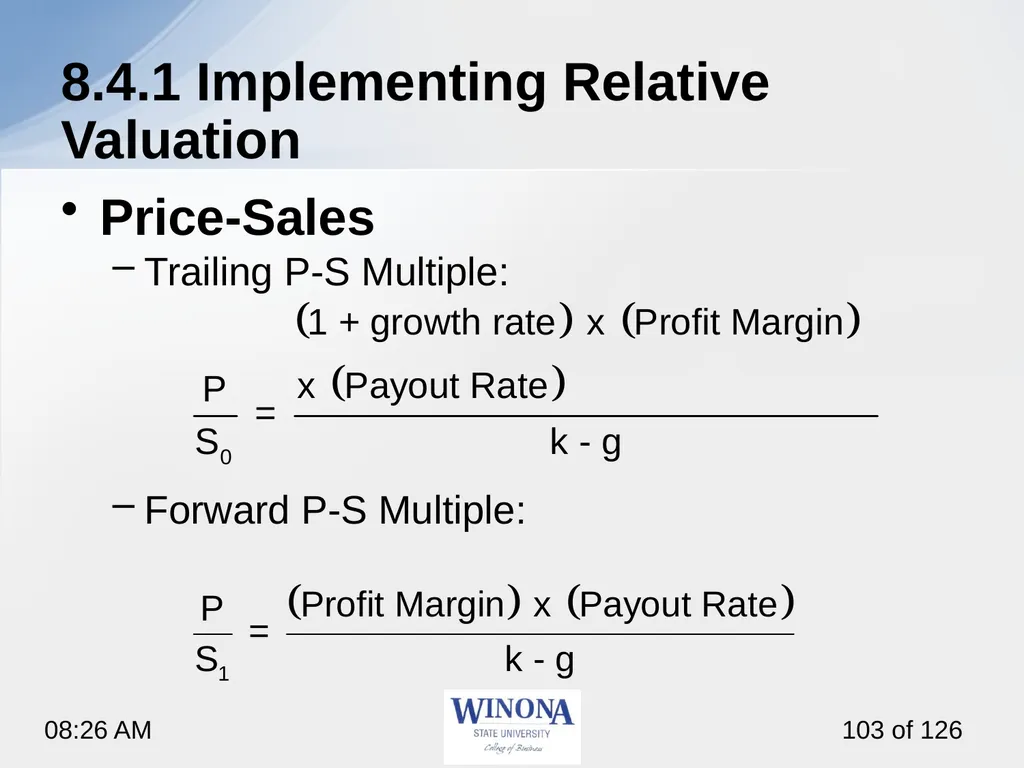
slide103. 8.4.1 Implementing Relative Valuation Price-Sales
Trailing P-S Multiple:
Forward P-S Multiple:<br>
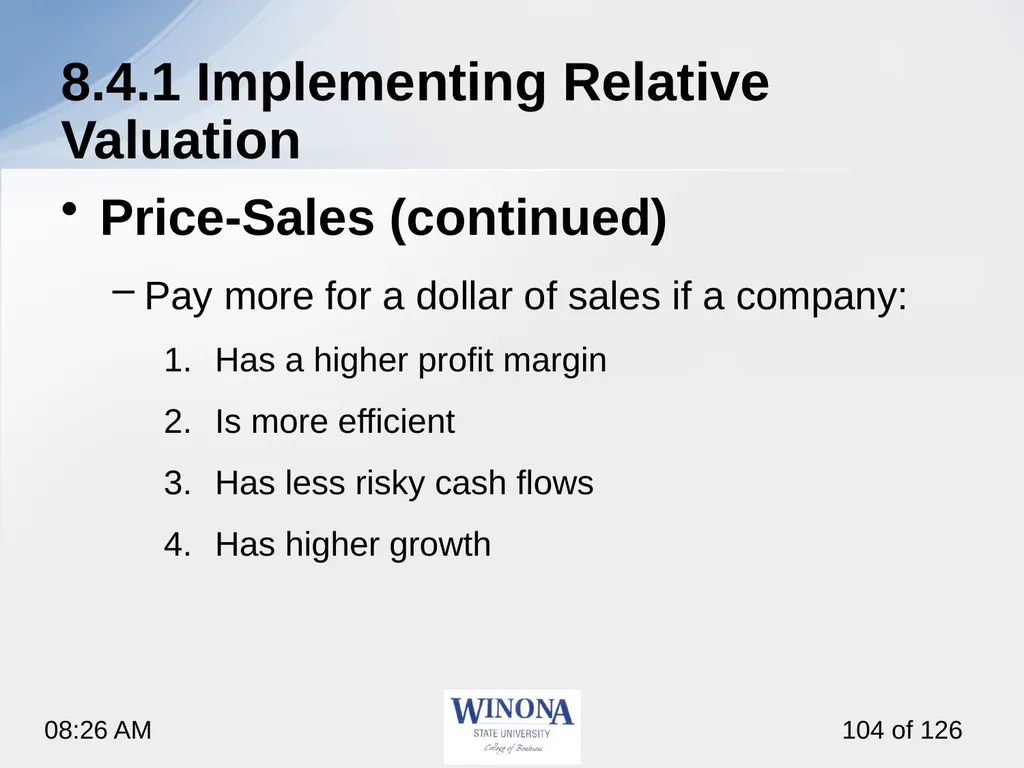
slide104. 8.4.1 Implementing Relative Valuation Price-Sales (continued)
Pay more for a dollar of sales if a company:
Has a higher profit margin
Is more efficient
Has less risky cash flows
Has higher growth<br>
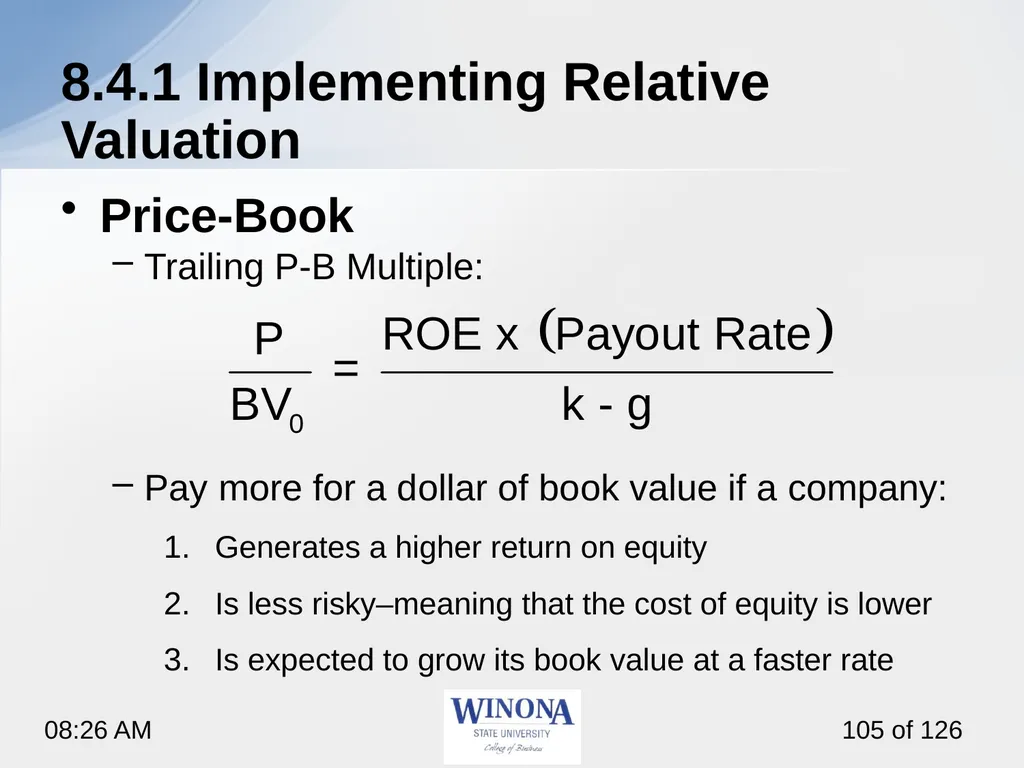
slide105. 8.4.1 Implementing Relative Valuation Price-Book
Trailing P-B Multiple:
Pay more for a dollar of book value if a company:
Generates a higher return on equity
Is less risky‒meaning that the cost of equity is lower
Is expected to grow its book value at a faster rate<br>
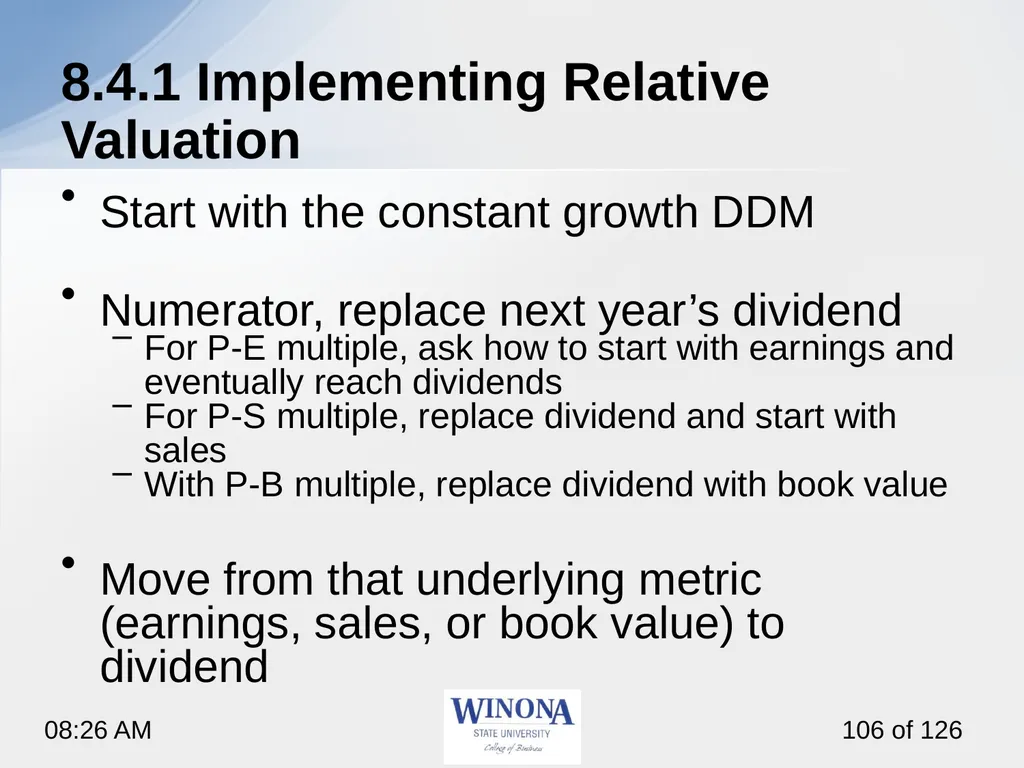
slide106. 8.4.1 Implementing Relative Valuation Start with the constant growth DDM
Numerator, replace next year’s dividend
For P-E multiple, ask how to start with earnings and eventually reach dividends
For P-S multiple, replace dividend and start with sales
With P-B multiple, replace dividend with book value
Move from that underlying metric (earnings, sales, or book value) to dividend<br>
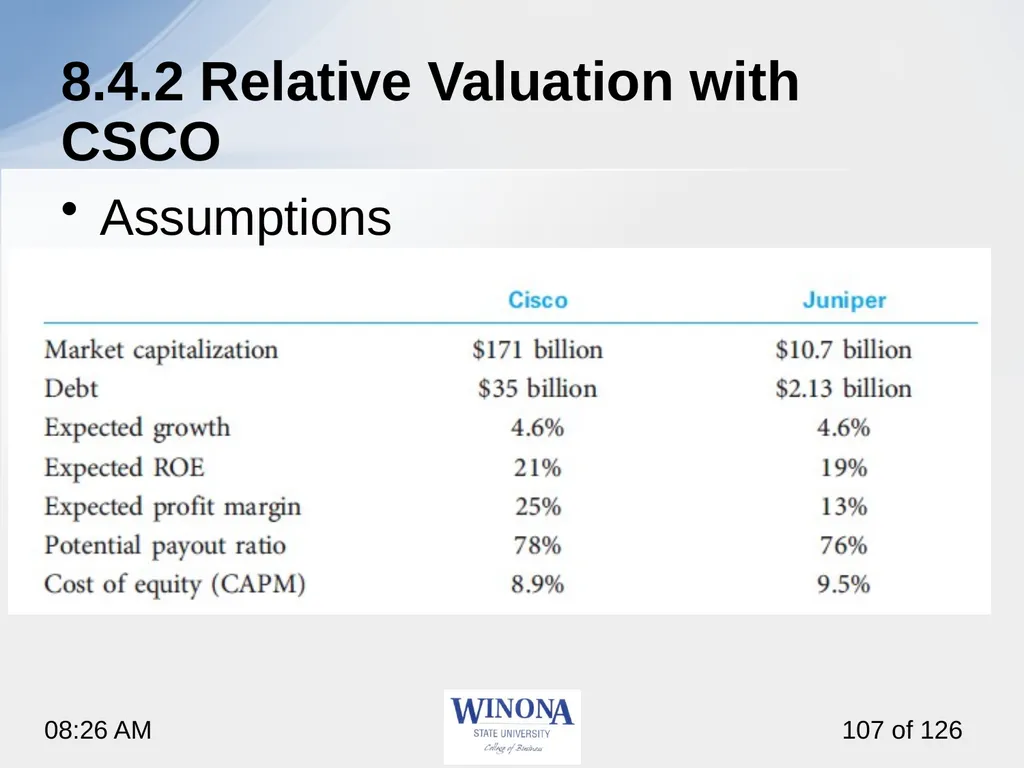
slide107. 8.4.2 Relative Valuation with CSCO Assumptions<br>
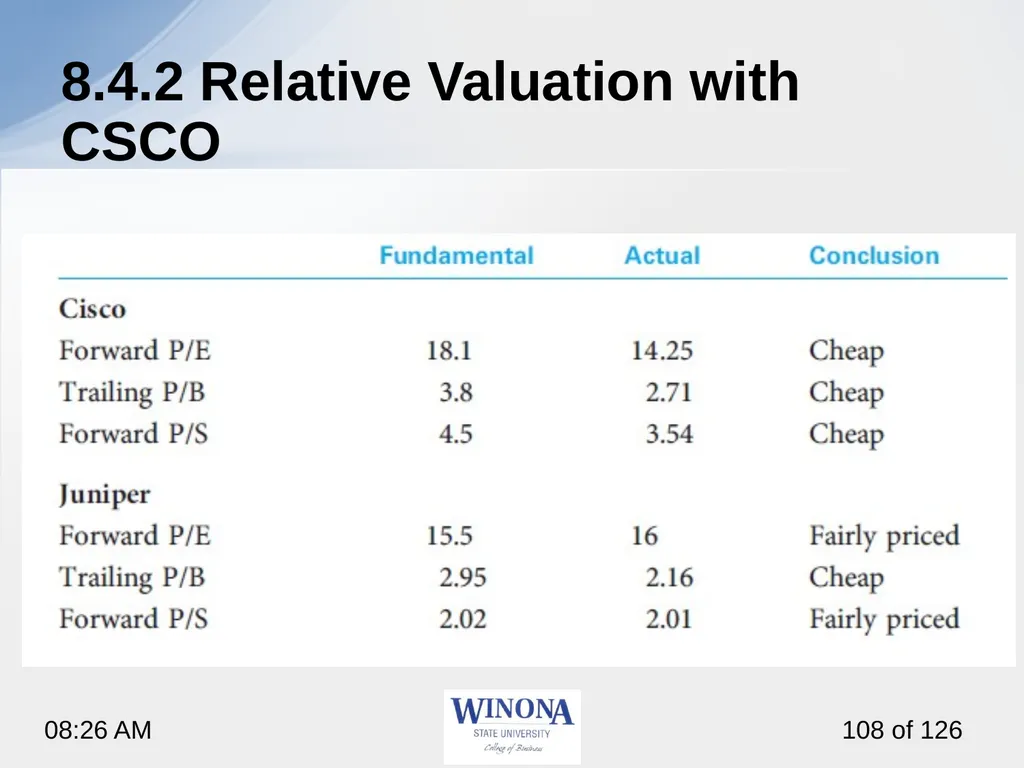
slide108. 8.4.2 Relative Valuation with CSCO<br>
slide109. 8.4.3 Advantages of Multiples Easy to use
Relative value is what matters
Widely used
Can confirm DCF value<br>
slide110. 8.4.4 Disadvantages of Multiples Difficult to use correctly
Can’t use multiples to purchase a security because it is “less overvalued” than some others
Significant assumption that the one stock is incorrectly priced
Other stocks may be mispriced<br>
slide111. 8.5 Ratio Analysis<br>
slide112. 8.5 Ratio Analysis Ratio analysis:
Helps make better estimates for the discounted cash flow model and better understand the business
May also help to ask better questions<br>
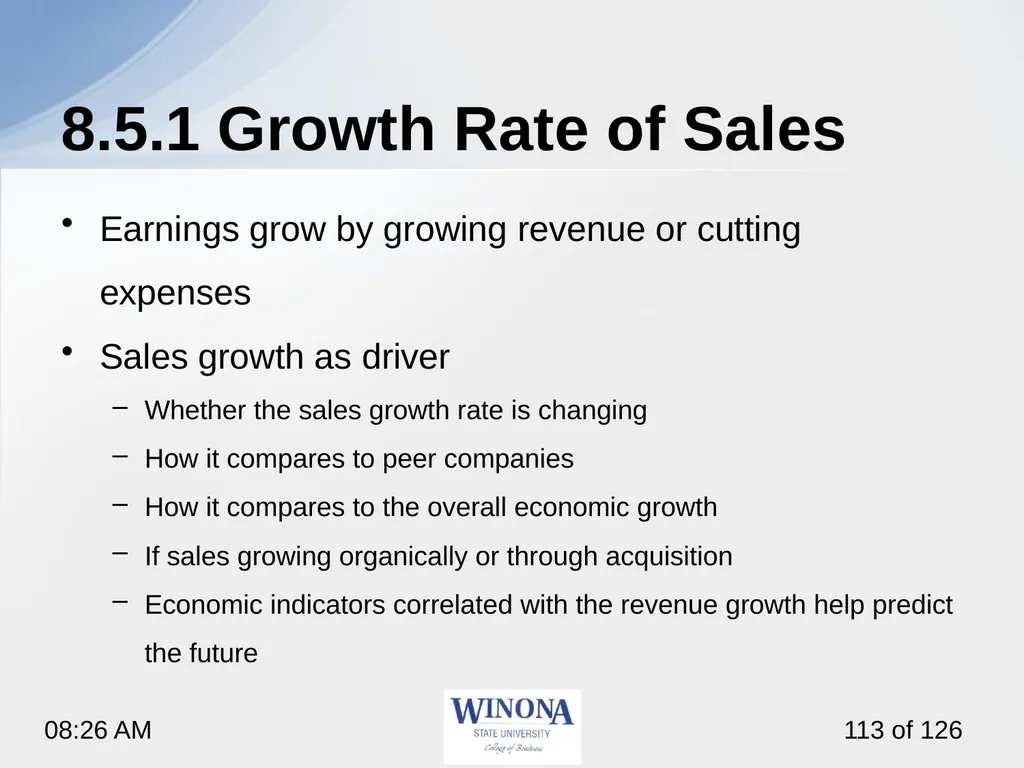
slide113. 8.5.1 Growth Rate of Sales Earnings grow by growing revenue or cutting expenses
Sales growth as driver
Whether the sales growth rate is changing
How it compares to peer companies
How it compares to the overall economic growth
If sales growing organically or through acquisition
Economic indicators correlated with the revenue growth help predict the future<br>
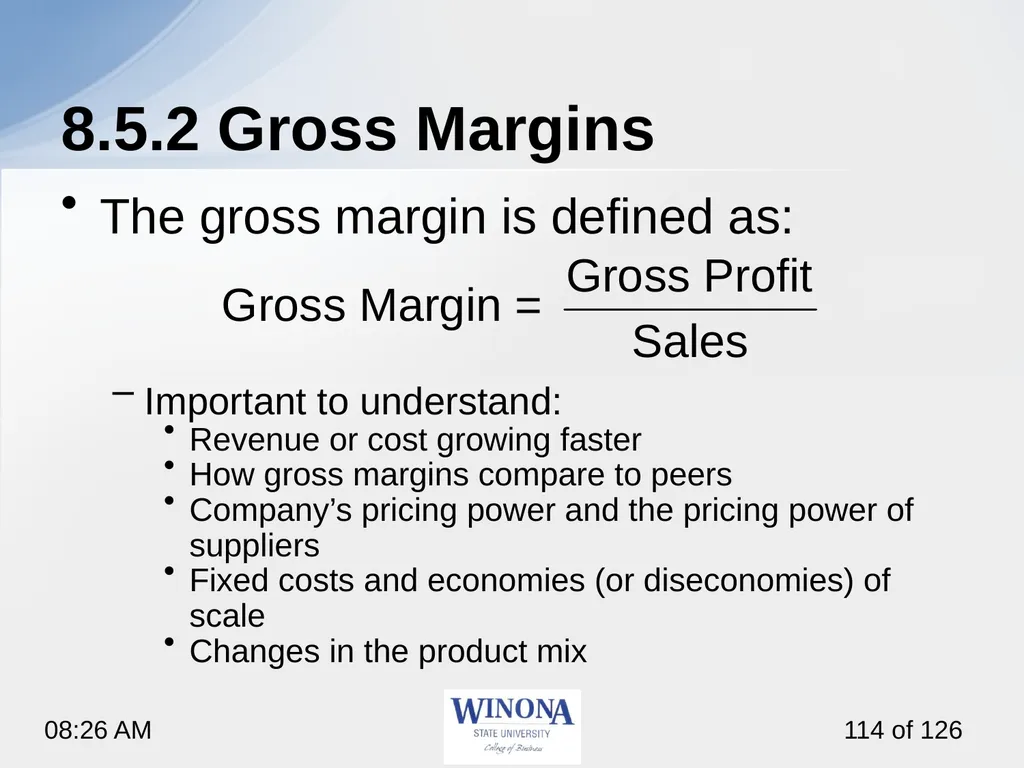
slide114. 8.5.2 Gross Margins The gross margin is defined as:
Important to understand:
Revenue or cost growing faster
How gross margins compare to peers
Company’s pricing power and the pricing power of suppliers
Fixed costs and economies (or diseconomies) of scale
Changes in the product mix<br>
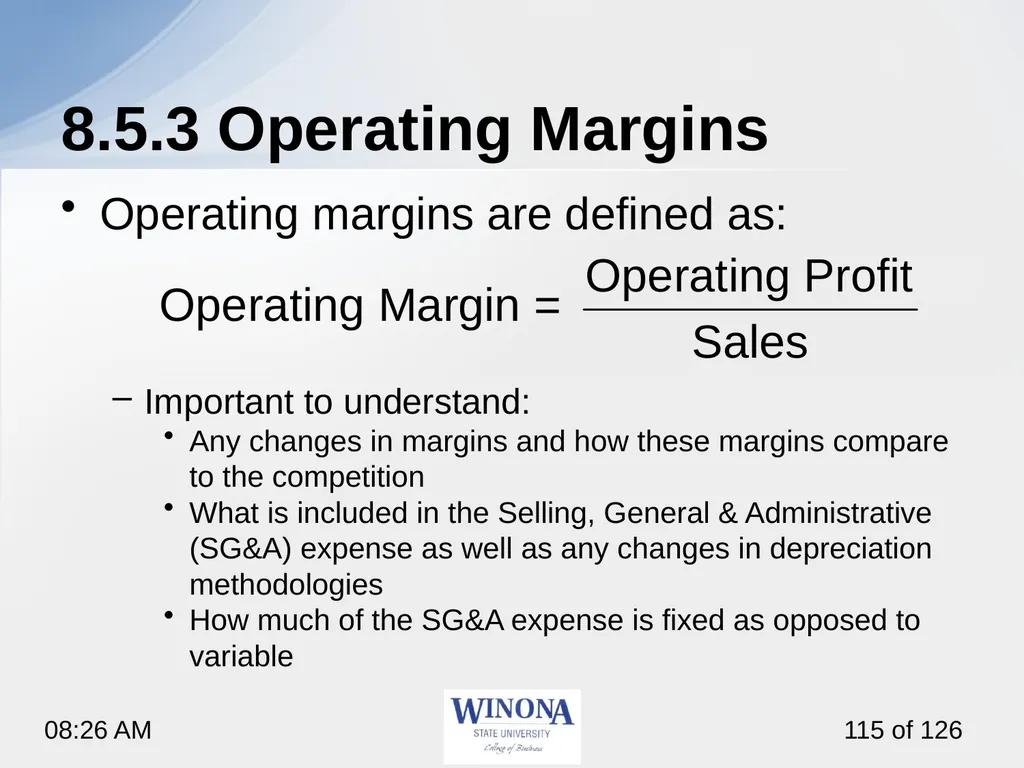
slide115. 8.5.3 Operating Margins Operating margins are defined as:
Important to understand:
Any changes in margins and how these margins compare to the competition
What is included in the Selling, General & Administrative (SG&A) expense as well as any changes in depreciation methodologies
How much of the SG&A expense is fixed as opposed to variable<br>
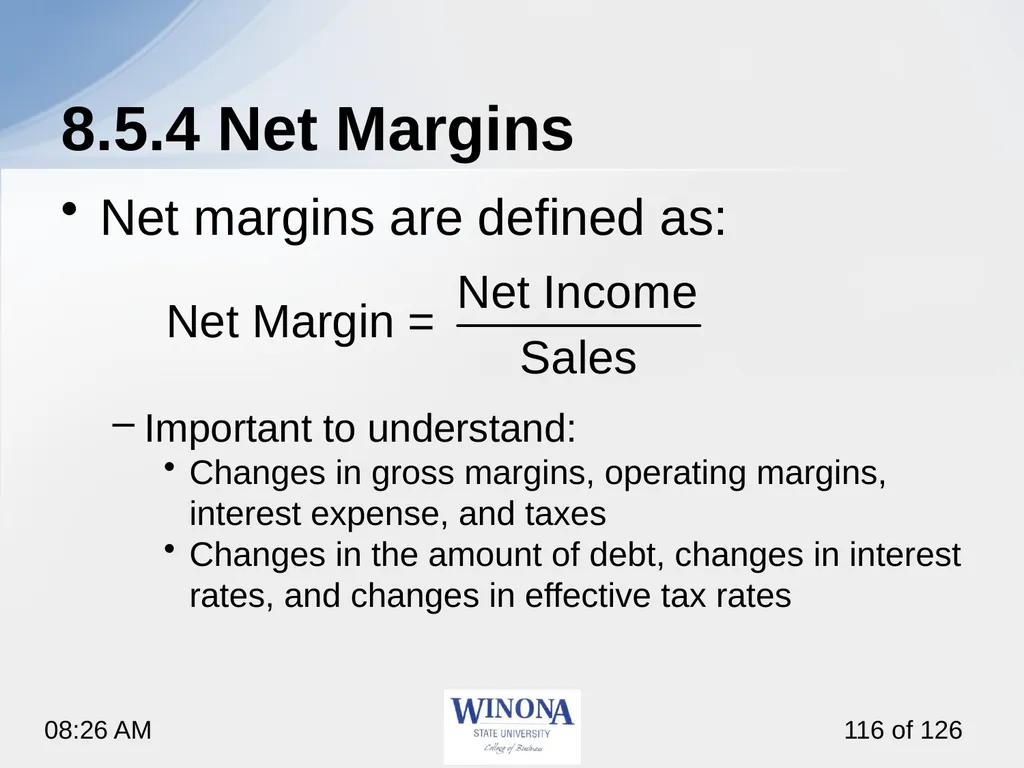
slide116. 8.5.4 Net Margins Net margins are defined as:
Important to understand:
Changes in gross margins, operating margins, interest expense, and taxes
Changes in the amount of debt, changes in interest rates, and changes in effective tax rates<br>
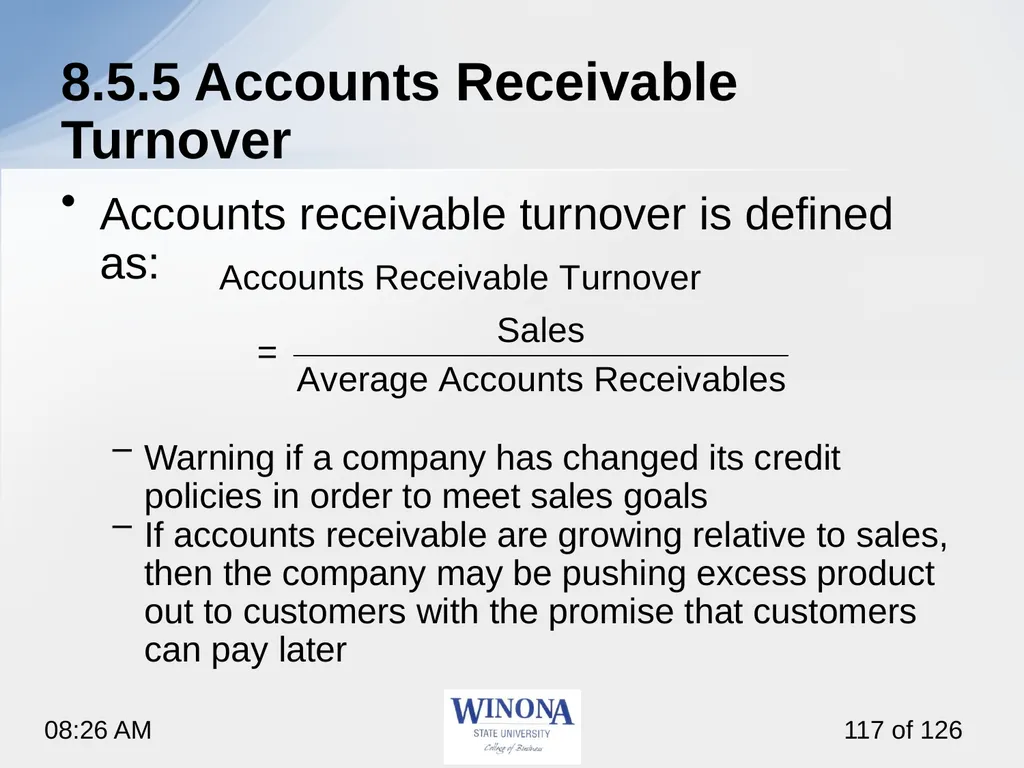
slide117. 8.5.5 Accounts Receivable Turnover Accounts receivable turnover is defined as:
Warning if a company has changed its credit policies in order to meet sales goals
If accounts receivable are growing relative to sales, then the company may be pushing excess product out to customers with the promise that customers can pay later<br>
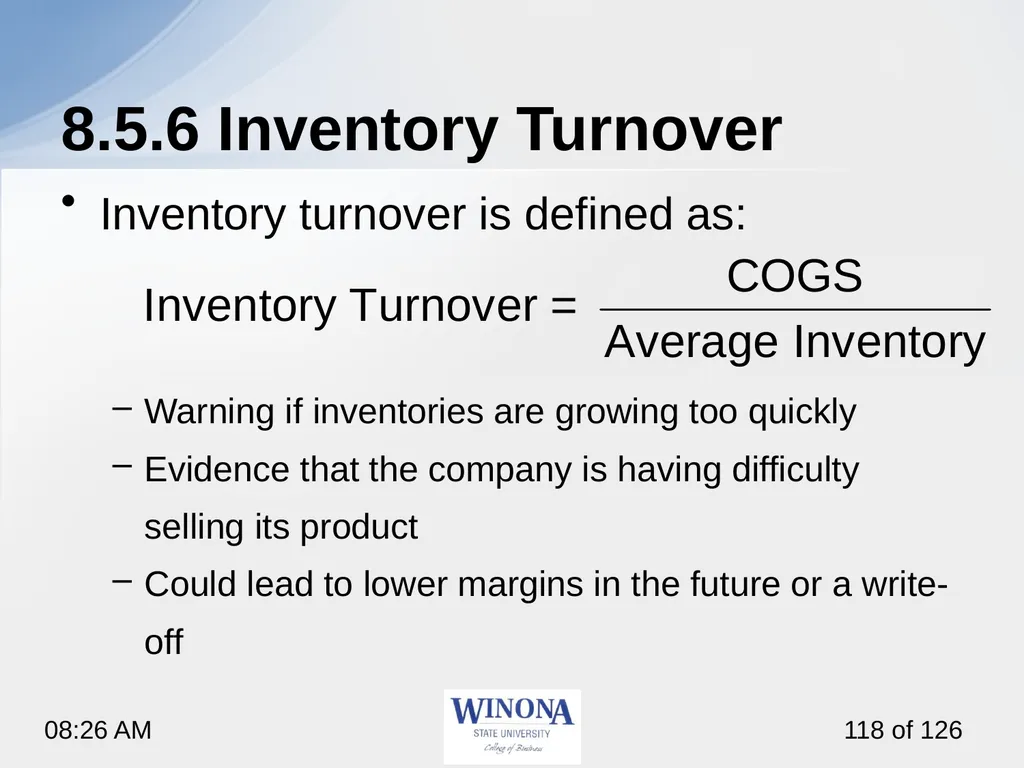
slide118. 8.5.6 Inventory Turnover Inventory turnover is defined as:
Warning if inventories are growing too quickly
Evidence that the company is having difficulty selling its product
Could lead to lower margins in the future or a write-off<br>
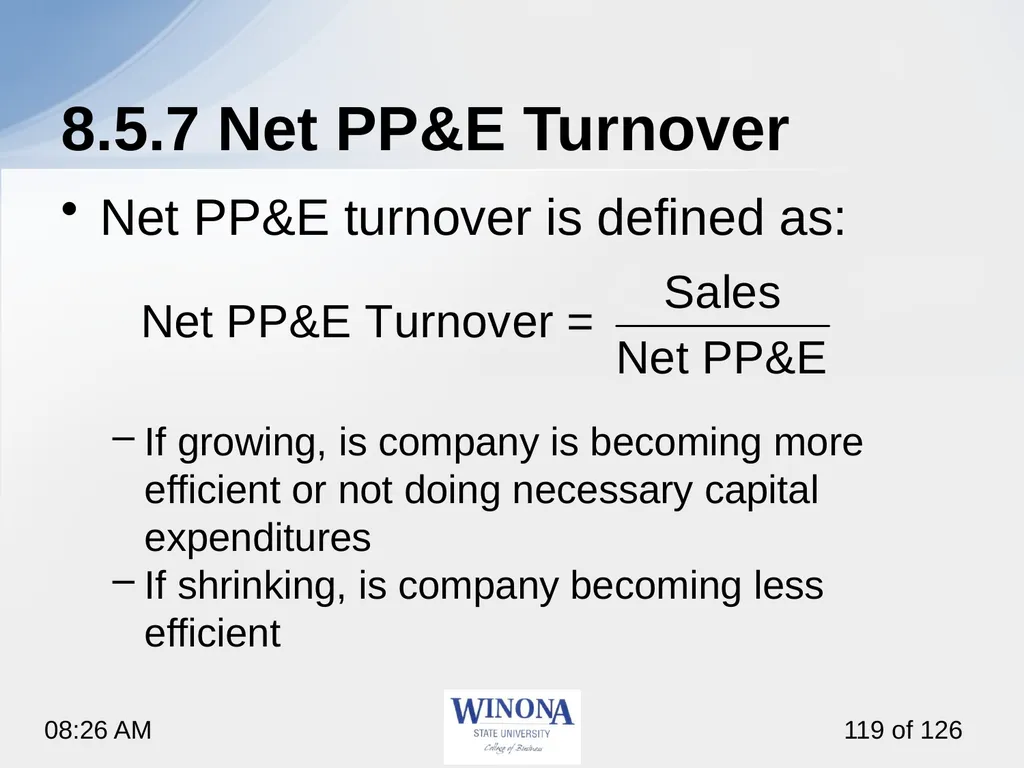
slide119. 8.5.7 Net PP&E Turnover Net PP&E turnover is defined as:
If growing, is company is becoming more efficient or not doing necessary capital expenditures
If shrinking, is company becoming less efficient<br>
slide120. 8.5.8 Debt as a Percentage of Long-Term Capital Debt as a Percentage of Long-Term Capital is defined as:
A company with too much debt is said to have financial risk
Financial risk increases the sensitivity of a stock’s performance to changes in the economy<br>
slide121. 8.5.9 Changes in Reserve Accounts Significant changes in reserve accounts, e.g., allowances for bad debts
Reserves can ‘manage’ earnings
“Under-reserve” in order to meet earnings expectations or “over-reserve” in order to smooth future earnings
Reserves must match the underlying fundamentals of the business and the business cycle<br>
slide122. 8.5.10 Operating Earnings/GAAP Earnings Companies want to report the highest earnings possible
Watch companies with recurring “non-recurring” expenses!
Easy to appear profitable if all expenses non-recurring or if writing down its assets so future expenses low
More in financial statements than just ratios
Management’s Discussion and Analysis (MD&A)
Proxy statement in order to understand the compensation structure
How forthcoming management is in the financial reports as well as the earnings conference call<br>
slide123. 8.6 The Quality of Financial Statements<br>
slide124. 8.6.1 Balance Sheet A high-quality balance sheet:
Typically has limited use of debt or leverage
Contains assets with market values greater than their book value
Off-balance-sheet liabilities also harms the quality, but offset by capitalizing operating leases<br>
slide125. 8.6.2 Income Statement High-quality earnings :
Repeatable earnings
Use of conservative accounting principles
The closer the earnings are to cash earnings, the higher the quality of the income statement<br>
slide126. 8.6.3 Footnotes Read the footnotes!
Many analysts recommend that you should read an annual report backward, that is, you would read the footnotes first!<br>
Larry Schrenk, Instructor FIN 377: Investments<br>
slide2. 8.1 Important Distinctions
8.2/3 Discounted Cash Flow
Discounted Dividend Model (DDM)
Free Cash Flow to Equity (FCFE)
Free Cash Flow to Firm (FCFF)
8.4 Relative Valuation
8.5 Ratio Analysis
8.6 The Quality of Financial Statements Overview<br>
slide3. What does it mean to say that an investment is fairly priced versus overvalued versus undervalued?
What is the difference between a constant-growth model, a no-growth model, and a multistage model?
What is free cash flow?
What is the intrinsic value of a business?
What is the difference between a free cash flow to the firm (FCFF) model and a free cash flow to equity (FCFE) model? How are the cash flows different? How are the discount rates different?
Should the FCFE model and the FCFF model result in the same value? What adjustments will allow this to happen?
What is the difference between the free cash flow to equity model and the dividend discount model?
What is the sustainable growth rate? How is the sustainable growth rate used to calculate the free cash flow that belongs to the equityholder?
How can the FCFE model be applied to a bank stock?
How do you calculate the present value of the growth opportunity? What does it represent?
What is relative valuation?
What are the underlying fundamentals that drive the price–earnings ratio? The price–sales ratio? The price–book ratio?
What are the advantages and disadvantages of relative valuation?
What is the purpose of ratio analysis? Learning Objectives<br>
slide4. Reilley, et al., Investment Analysis and Portfolio Management, Chap. 8 Readings<br>
slide5. 8.1 Important Distinctions<br>
slide6. 8.1 Fairly Valued, Overvalued, and Undervalued Fairly Valued
Overvalued
Undervalued<br>
slide7. 8.1.1 Fairly Valued, Overvalued, and Undervalued Two approaches to valuation:
Absolute valuation
Discounted cash flow (DCF) valuation
Relative valuation<br>
slide8. 8.1.2 Top-Down Approach versus Bottom-Up Approach Two approaches:
Top-down, three-step approach
Bottom-up, stock valuation, stock picking approach
Difference: Importance of economic and industry influence on individual firms and stocks
Both can be implemented by fundamentalists or technicians<br>
slide9. 8.1.2 Top-Down Approach versus Bottom-Up Approach Top-down approach:
The overall market and economy
The industry
The individual company<br>
slide10. 8.1.2 Top-Down Approach versus Bottom-Up Approach<br>
slide11. 8.1.2 Top-Down Approach versus Bottom-Up Approach Top-down analysts:
Value of overall market(s)
Best industries within specific market
Best companies within the best industries
Best companies may be overvalued<br>
slide12. 8.1.2 Top-Down Approach versus Bottom-Up Approach Does the Three-Step Process Work?
Studies show economic environment has significant effect on firm earnings
Relationship between aggregate stock prices and various economic series
Most changes in stock returns explained by changes in market or industry returns<br>
slide13. 8.1.2 Top-Down Approach versus Bottom-Up Approach Top-Down consistent with most important decision being asset allocation decision
Asset allocation specifies:
How much of portfolio in various economies
How assets will among stocks, bonds, or other assets
Industry/sector selections<br>
slide14. 8.2/3 Discounted Cash Flow<br>
slide15. 8.2 An Introduction to DCF and Relative Valuation Asset value calculated using discounted cash flow and relative valuation
Intrinsic value:
The present value of cash flows is the value that we ascribe to the business<br>
slide16. 8.3 Discounted Cash Flow Present value of cash flow, such as dividends, operating cash flow, or free cash flow:<br>
slide17. 8.2 An Introduction to DCF and Relative Valuation Discounted cash flow analysis can be done in several different ways:
Free cash flow to the firm (FCFF) valuation or weighted average cost of capital (WACC) analysis
Free cash flow to equity (FCFE) model
Dividend discount model (DDM)<br>
slide18. 8.2.1 The Foundations of Discounted Cash Flow Valuation Two steps:
Identify cash flows
Discount cash
Value of a stock (or other asset):<br>
slide19. 8.2.1 The Foundations of Discounted Cash Flow Valuation<br>
slide20. 8.2/3 Discounted Cash Flow Discounted Dividend Model (DDM)<br>
slide21. DDM Issues Motivation
Dividends are cash flows from common stock.
Price is the present value of cash flows.
Thus, price of a common share should be the present value of its dividends
Some Problems
Dividends (especially far future ones) are not easily estimated.
Dividends can be manipulated.
Dividends may not represent available cash flow.<br>
slide22. The Dividend Discount Model Key ideas:
The numerator is next year’s dividend
The discount rate is the cost of equity
Capital asset pricing model:<br>
slide23. stock price equals present value of expected future dividends
V0 = current value
Dt = dividend at t
k = required rate of return Dividend Discount Models (DDM)<br>
slide24. Capital Gains vs. Dividends<br>
slide25. DDM Patterns Constant/No Growth Model
Dividends remain constant<br>
slide26. DDM Patterns Constant Growth Model
Dividends grow at a constant rate<br>
slide27. DDM Patterns Mixed/Multistage Model
Dividends grow at different rates.
Short-Term Long-Term<br>
slide28. 8.2/3 Discounted Cash Flow Constant/No Growth Model<br>
slide29. 8.2.3 The No-Growth Model Cash flows not growing
Special case of constant growth
Constant Perpetuity<br>
slide30. 8.2.3 The No-Growth Model Important takeaways:
Larger cash flow → greater value of firm/equity
Less risky cash flow requires lower discount rate
Best model when no growth opportunities (PVGO)
Assumption: Company pays out all earnings<br>
slide31. No-Growth DDM A firm is expected to pay an annual dividend of $4.00 in perpetuity. If the discount rate is 7%, what is the value of the stock?<br>
slide32. Preferred Stock Using the DDM Preferred stock can be valued as a perpetuity.
Value a preferred stock paying a fixed dividend of $2.00 per share when the discount rate is 8%:<br>
slide33. 8.2.3 The No-Growth Model<br>
slide34. No-Growth Examples Company will earn $1.50 next year and has no growth opportunities
Cost of equity is 15%<br>
slide35. 8.2/3 Discounted Cash Flow Constant Growth Model<br>
slide36. 8.2.2 The Constant Growth Model The constant growth model
Gordon growth model
Treats cash flow as a growing perpetuity
Assumes k > g<br>
slide37. 8.2.2 The Constant Growth Model Three uses:
General estimate of value
Basis for fundamental multiples
Terminal value of a model<br>
slide38. 8.2.2 The Constant Growth Model Growth rate (g) describes how CF increases each year and investment must grow each year
Required rate of return (k) is what investment earns each year
Cannot pay out entire k; must retain g to grow
Amount that can be paid out is k – g<br>
slide39. 8.2.2 The Constant Growth Model Important takeaways:
CF larger (higher earnings/payout) → greater intrinsic value
CF less risky → lower cost of equity → greater intrinsic value
CF grow faster (g) → greater intrinsic value
Assumption: Company mature and in a steady state
No growth rate constant forever; the growth rate reflects average long term growth rate
Large company growth rate capped at economy growth<br>
slide40. 8.2.2 The Constant Growth Model<br>
slide41. 8.2.2 The Constant Growth Model Estimating Value
CSCO had earnings per share of $0.53 and pasy out all of its earnings. It had a cost of equity of 12% and expected earnings growth of 10% into perpetuity
If the stock traded as high as $82, it was overvalued according to this model<br>
slide42. Read a constant growth DDM problem carefully, to see if the cash flow information provided is D0 or D1! Hint: Constant Growth DDM<br>
slide43. g = growth rate in dividends
ROE = return on equity for the firm
b = plowback or retention percentage rate
(1 - dividend payout percentage rate)
What are the assumptions behind this formula?
What are the drawbacks to using a ‘formula’ approach? Estimating Dividend Growth Rates<br>
slide44. b = Plowback or Retention Rate
Percentage of net income retained by firm
(1 - b) = Dividend Payout Ratio
Percentage of net income paid out by firm as dividends Plowback vs. Payout Ratio<br>
slide45. Constant Growth DDM A firm is expected to pay an annual dividend of $4.00 increasing by 2% in perpetuity. If the discount rate is 7%, what is the value of the stock?<br>
slide46. Constant Growth DDM A firm is expected to pay an annual dividend of $4.00 decreasing by 2% in perpetuity. If the discount rate is 7%, what is the value of the stock? (NOTE: ‘growth’ can be negative.)<br>
slide47. Firm Value = Assets-in-Place + PVGO
The value of the firm equals the value of the assets already in place, the no-growth value of the firm...
Plus the NPV of its future investments, the present value of growth opportunities (PVGO). Present Value of Growth Opportunities<br>
slide48. Present Value of the Growth Opportunity (PVGO) PVGO is the part of a stock’s intrinsic value attributable to growth
How much of the intrinsic value is derived from growth?
NOTE: PVGO can be negative.<br>
slide49. Present Value of Growth Opportunities PVGO is calculated in three steps:
Calculate the intrinsic value of the stock
Calculate the no-growth value of the stock
Calculate the PVGO by subtracting the no-growth value from the intrinsic value<br>
slide50. PVGO Example A firm is expected to pay an annual dividend of $4.00 increasing by 2% in perpetuity. If the discount rate is 7%, what is the PVGO?<br>
slide51. 8.2/3 Discounted Cash Flow Mixed/Multistage Model<br>
slide52. Mixed/Multistage Model Strategy To alleviate this problem, we divide the forecast of dividends into two periods:
Short Term Prediction/Horizon
Long Term Prediction/Horizon
Short Term Long Term 0 1 2 3 t D0 D1 D2 Dt D3<br>
slide53. Mixed/Multistage Model Problem Estimate year-by-year dividends for an extended period, e.g., ten years,
this would become a pure, unfounded guess at values.
What will the dividend be for IBM 8 years from now?<br>
slide54. Mixed/Multistage Model: Short Term Period over which we can reasonably estimate the expected dividends:
As specific dollar amounts, or
E.g., $4.00 $4.15 $4.25 $4.90
As subject to some growth forecast
E.g., $4.00 growing at 10% for 4 years
Dividend ‘Smoothing’<br>
slide55. Mixed/Multistage Model: Long Term Period over which we cannot predict dividends.
We cannot ignore the long term,
For many firms the long term provides much of the value of the firm.
NOTE: The more value is derived from the future, the harder to use the DDM as a method.<br>
slide56. The Long Term Solution Estimate the long term dividends as growing at a reasonable, constant growth rate.
Estimate as constant or growing perpetuity.
Infinite growth rate cannot be very large.
One good estimate is the long term growth for the economy, perhaps 2, 3 or 4%.<br>
slide57. Calculations Value of the short term dividends is PV of the individual dividends.
2) Value of the long term dividends is a delayed growing perpetuity.
NOTE: It is a delayed growing perpetuity because the long term dividends do not begin until after the short term dividends end.
3) Stock price = PVshort term + PVlong term<br>
slide58. Mixed/Multistage Model Example EXAMPLE
A firm has just paid an annual dividend of $2.00. That dividend is expected to grow at a rate of 30% for one year, 20% for the next two years, then level off to a long term growth rate of 3%. If the discount rate is 12%, what should be the price of the stock?<br>
slide59. Mixed/Multistage Model Example Data:
D0 = 2
g1 = 30%
g2-3 = 20%
g4+ = 3%
k = 12%<br>
slide60. Mixed/Multistage Model Example Data
D0 = 2; g1 = 30%; g2-3 = 20%; g4+ = 3%; k = 12%
Dividends Calculation
D1 = 2(1.30) = 2.60
D2 = 2(1.30)(1.20) = 3.12
D3 = 2(1.30)(1.20)2 = 3.74
D4 = 2(1.30)(1.20)2 (1.03) = 3.85
etc.<br>
slide61. Mixed/Multistage Model Example The Timeline
Short Term Long Term 0 1 2 3 4 D0 D1 D2 D4 D3 2.00 2.60 3.12 3.85 3.74<br>
slide62. Mixed/Multistage Model Example EXAMPLE
Data: D0 = 2; g1 = 30%; g2-3 = 20%; g4+ = 3%; k = 12%
Short Term
D1 = 2.60 D2 = 3.12 D3 = 3.74<br>
slide63. Mixed/Multistage Model Example EXAMPLE
Data: D0 = 2; g1 = 30%; g2-3 = 20%; g4+ = 3%; k = 12%
Long Term
D4 = 3.85<br>
slide64. Mixed/Multistage Model Example EXAMPLE
Data: D0 = 2; g1 = 30%; g2-3 = 20%; g4+ = 3%; k = 12%
or
Short Term Long Term<br>
slide65. Mixed/Multistage Model Formula<br>
slide66. 8.2/3 Discounted Cash Flow Free Cash Flow to Equity (FCFE)<br>
slide67. Free Cash Flow to Equity (FCFE)
CFs available to distribute to equity investors
‘Potential’ Dividend Midel
Value: Total Equity of Firm
Discount rate: Cost of equity
Free Cash Flow to the Firm (FCFF)
CFs available to distribute to all investors
Value: Total Value of Firm
Discount rate: WACC FCFF and FCFE<br>
slide68. Free Cash Flow to Equity: The Improved DDM FCFE: Free cash flow available to stockholders after payments to all other capital suppliers and after providing for the continued growth of the firm
More general version of the dividend discount model<br>
slide69. Firm not dividend paying
Dividends differ significantly from capacity to pay dividends
Investor takes a control perspective FCFE Motivation<br>
slide70. Free Cash Flow to Equity Retention rate (b) is the percentage of earnings that are retained or plowed back
The sustainable growth rate :
g = ROE x b
Assumptions:
Firm maintains ROE
Firm maintains b<br>
slide71. Free Cash Flow to Equity<br>
slide72. Free Cash Flow to Equity Efficiency, profitability and leverage are all captured in the DuPont equation:<br>
slide73. Free Cash Flow to Equity<br>
slide74. Free Cash Flow to Equity Example, value of CSCO at the end of 2016
Four forecasts are needed:
Sales growth
At the end of 2016, CSCO had sales per share of $9.78
Sales are expected to grow by 4% for the next five years
After that, lower growth (3.75%) into perpetuity
Profit margin
Profit margin (NI/Sales) is approximately 24%
Return on equity
ROE of 20%
Cost of equity
Cost of equity is 9.5%<br>
slide75. Free Cash Flow to Equity<br>
slide76. Free Cash Flow to Equity Returning to DDM and PVGO
Value of the stock = cash flow/(cost of equity – growth)
Value = $1.95/(9.5% - 4%) = $35.51
Assume CSCO pays out all of its earnings:
Value = $2.44/.095 = $25.68
PVGO is $8.98
PVGO = $35.51 - 25.68 = $8.98
Almost 25% of the intrinsic value is from PVGO<br>
slide77. Free Cash Flow to Equity Framing Your Research
Do you expect that CSCO can continue to grow at 4% into the future?
Do you expect profit margins of 24% to be attainable over the long term?
Can CSCO continue to earn an ROE of 20%?
Will a 9.5% return justify the risk that you are taking by investing in Cisco?<br>
slide78. Free Cash Flow to Equity What if the Stock Is Trading at Intrinsic Value?
FCFE model came out to a value of $34.66
Assume current stock price is also $34.66
What is your long-term rate of return?
9.5% per year-the cost of equity
Compensated appropriately for risk<br>
slide79. Free Cash Flow to Equity<br>
slide80. Find value of firm/equity
Constant Model
FCF remain constant
Growth Model
FCF change at a constant rate
Mixed/Multistage Model
FCF change at different rates. Applying FCFE (and FCFF)<br>
slide81. FCFE Example A firm has a FCFE is expected to pay an annual dividend of $4 million increasing by 2% in perpetuity. If the discount rate is 7%, what is the total value of equity value of the stock?<br>
slide82. 8.2/3 Discounted Cash Flow Free Cash Flow to Firm (FCFF)<br>
slide83. Free Cash Flow to Firm FCFF: different cash flows, different discount rate, and results in a different value:
CF is the cash flow available to all providers of capital after estimating the cash flow generated from running the business and reinvesting in the business
Cash flow after the debtholders are paid
Do not subtract payments to debtholders<br>
slide84. Free Cash Flow to Firm Discount rate must incorporate all the different costs of capital
Cost of equity, cost of debt, and cost of preferred stock (if the firm has issued preferred stock)
Weighted average cost of capital (WACC)
Resulting value is the value of the firm: Enterprise value<br>
slide85. Free Cash Flow to Firm Calculating FCFF
Forecast sales
Forecast operating profits.
Forecast taxes as percentage of operating profit
Calculate net operating profit after taxes (NOPAT)
Add back depreciation
Subtract the capital expenditures
Subtract change in net working capital (NWC)
Calculate the free cash flow to the firm<br>
slide86. Free Cash Flow to Firm Calculating FCFF (continued)
Calculate WACC (discount rate)
Calculate the terminal value (TV)
Find PV of free cash flow
Add any nonoperating assets
Add any excess cash
Subtract the value of debt
Subtract any other debt (not captured in DCF)
Calculate per share value of equity<br>
slide87. Free Cash Flow to Firm<br>
slide88. Free Cash Flow to Firm<br>
slide89. Free Cash Flow to Firm<br>
slide90. Free Cash Flow to Firm<br>
slide91. Free Cash Flow to Firm Sales : $48.9 B
Sales growth (1-5): 4%
Sales growth (6+): 3.75%
Operating margins = 3%
Tax rate = 22%
Net margins = 24%
Debt = $25 billion
Pre-tax cost debt = 4:54%
Shares outstanding = 5 B
BV equity: $61.05 B
BV assets: $86.05 B
ROA (calculated as NOPAT1/Equity0): 15.21%
Percentage of NOPAT that must be reinvested (calculated as growth rate/ROA):
b (1–5): 26.29%
b (6+): 24.65%
MV equity: $150 B
MV debt: $25 B
Cost of Equity = 9:5%
WACC = (6/7)(9:5%) + (1/7)(4.54% )(1 - .22) = 8.65%<br>
slide92. Free Cash Flow to Firm<br>
slide93. Free Cash Flow to Firm Why Didn’t the FCFF Model Value Equal the FCFE Model Value?
The values will be similar but will just be different by a few dollars per share
If you make the same assumptions, the values should be the same
Assumption needed in order for the FCFF to have the same value as the FCFE:
When the enterprise value is calculated, assign values based on the weights used in the WACC<br>
slide94. Free Cash Flow to Firm<br>
slide95. 8.4 Relative Valuation<br>
slide96. 8.4 Relative Valuation Values company by comparing it to similar companies, the market or its own trading history
Uses:
Comparing multiples to comparable companies
Comparing a stock multiple to the market multiple
Comparing a stock multiple to its historic multiple
Comparing a stock multiple to recent transactions<br>
slide97. Examples of Multiples P/E Ratio
Price/Book Ratio
Dividend Yield
Price/Sales
Price/Cash Flow
EV/Revenue<br>
slide98. 8.4 Relative Valuation Three steps:
Find comparable companies
Determine the appropriate multiple to use
Apply the multiple<br>
slide99. 8.4.1 Implementing Relative Valuation Step 1: Find Comparable Companies
Factors that make the business similar or different
Business risk perspective or financial risk perspective<br>
slide100. 8.4.1 Implementing Relative Valuation Step 2: Determine the Appropriate Multiple
Determine which multiple to use
Understand what multiples other analysts use
What underlying metric seems to move a stock
Step 3: Apply the Multiple
An analyst must understand the fundamentals that drive multiples: fundamental multiples
Price-earnings, price-sales, and price-book value<br>
slide101. 8.4.1 Implementing Relative Valuation Price-Earnings
Trailing P-E Multiple:
Forward Trailing P-E Multiple:<br>
slide102. 8.4.1 Implementing Relative Valuation Price-Earnings (continued)
Pay more for a dollar of earnings if:
Those earnings will grow at a higher rate
The company is more efficient
The cash flows are lower risk
P-E multiple should be higher
if growth (g) is higher,
If payout ratio is higher, or
If cost of equity (r) is lower<br>
slide103. 8.4.1 Implementing Relative Valuation Price-Sales
Trailing P-S Multiple:
Forward P-S Multiple:<br>
slide104. 8.4.1 Implementing Relative Valuation Price-Sales (continued)
Pay more for a dollar of sales if a company:
Has a higher profit margin
Is more efficient
Has less risky cash flows
Has higher growth<br>
slide105. 8.4.1 Implementing Relative Valuation Price-Book
Trailing P-B Multiple:
Pay more for a dollar of book value if a company:
Generates a higher return on equity
Is less risky‒meaning that the cost of equity is lower
Is expected to grow its book value at a faster rate<br>
slide106. 8.4.1 Implementing Relative Valuation Start with the constant growth DDM
Numerator, replace next year’s dividend
For P-E multiple, ask how to start with earnings and eventually reach dividends
For P-S multiple, replace dividend and start with sales
With P-B multiple, replace dividend with book value
Move from that underlying metric (earnings, sales, or book value) to dividend<br>
slide107. 8.4.2 Relative Valuation with CSCO Assumptions<br>
slide108. 8.4.2 Relative Valuation with CSCO<br>
slide109. 8.4.3 Advantages of Multiples Easy to use
Relative value is what matters
Widely used
Can confirm DCF value<br>
slide110. 8.4.4 Disadvantages of Multiples Difficult to use correctly
Can’t use multiples to purchase a security because it is “less overvalued” than some others
Significant assumption that the one stock is incorrectly priced
Other stocks may be mispriced<br>
slide111. 8.5 Ratio Analysis<br>
slide112. 8.5 Ratio Analysis Ratio analysis:
Helps make better estimates for the discounted cash flow model and better understand the business
May also help to ask better questions<br>
slide113. 8.5.1 Growth Rate of Sales Earnings grow by growing revenue or cutting expenses
Sales growth as driver
Whether the sales growth rate is changing
How it compares to peer companies
How it compares to the overall economic growth
If sales growing organically or through acquisition
Economic indicators correlated with the revenue growth help predict the future<br>
slide114. 8.5.2 Gross Margins The gross margin is defined as:
Important to understand:
Revenue or cost growing faster
How gross margins compare to peers
Company’s pricing power and the pricing power of suppliers
Fixed costs and economies (or diseconomies) of scale
Changes in the product mix<br>
slide115. 8.5.3 Operating Margins Operating margins are defined as:
Important to understand:
Any changes in margins and how these margins compare to the competition
What is included in the Selling, General & Administrative (SG&A) expense as well as any changes in depreciation methodologies
How much of the SG&A expense is fixed as opposed to variable<br>
slide116. 8.5.4 Net Margins Net margins are defined as:
Important to understand:
Changes in gross margins, operating margins, interest expense, and taxes
Changes in the amount of debt, changes in interest rates, and changes in effective tax rates<br>
slide117. 8.5.5 Accounts Receivable Turnover Accounts receivable turnover is defined as:
Warning if a company has changed its credit policies in order to meet sales goals
If accounts receivable are growing relative to sales, then the company may be pushing excess product out to customers with the promise that customers can pay later<br>
slide118. 8.5.6 Inventory Turnover Inventory turnover is defined as:
Warning if inventories are growing too quickly
Evidence that the company is having difficulty selling its product
Could lead to lower margins in the future or a write-off<br>
slide119. 8.5.7 Net PP&E Turnover Net PP&E turnover is defined as:
If growing, is company is becoming more efficient or not doing necessary capital expenditures
If shrinking, is company becoming less efficient<br>
slide120. 8.5.8 Debt as a Percentage of Long-Term Capital Debt as a Percentage of Long-Term Capital is defined as:
A company with too much debt is said to have financial risk
Financial risk increases the sensitivity of a stock’s performance to changes in the economy<br>
slide121. 8.5.9 Changes in Reserve Accounts Significant changes in reserve accounts, e.g., allowances for bad debts
Reserves can ‘manage’ earnings
“Under-reserve” in order to meet earnings expectations or “over-reserve” in order to smooth future earnings
Reserves must match the underlying fundamentals of the business and the business cycle<br>
slide122. 8.5.10 Operating Earnings/GAAP Earnings Companies want to report the highest earnings possible
Watch companies with recurring “non-recurring” expenses!
Easy to appear profitable if all expenses non-recurring or if writing down its assets so future expenses low
More in financial statements than just ratios
Management’s Discussion and Analysis (MD&A)
Proxy statement in order to understand the compensation structure
How forthcoming management is in the financial reports as well as the earnings conference call<br>
slide123. 8.6 The Quality of Financial Statements<br>
slide124. 8.6.1 Balance Sheet A high-quality balance sheet:
Typically has limited use of debt or leverage
Contains assets with market values greater than their book value
Off-balance-sheet liabilities also harms the quality, but offset by capitalizing operating leases<br>
slide125. 8.6.2 Income Statement High-quality earnings :
Repeatable earnings
Use of conservative accounting principles
The closer the earnings are to cash earnings, the higher the quality of the income statement<br>
slide126. 8.6.3 Footnotes Read the footnotes!
Many analysts recommend that you should read an annual report backward, that is, you would read the footnotes first!<br>