
Total Quality Management and Quality Management

Description: Total Quality Management and Quality Management Philosophies Dr. Raghu Nandan Sengupta Professor Department of Industrial and Management Engineering All figures are taken from(unless otherwise mentioned): Introduction to Statistical process
Related Topics
Download Presentation
"Total Quality Management and Quality Management" is the property of its rightful owner. Permission is granted to download and print the materials on this website for personal, non-commercial use only, and to display it on your personal computer provided you do not modify the materials and that you retain all copyright notices contained in the materials. By downloading content from our website, you accept the terms of this agreement.
Presentation Transcript
slide1. Total Quality Management and Quality Management Philosophies Dr. Raghu Nandan Sengupta
Professor
Department of Industrial and Management Engineering
All figures are taken from(unless otherwise mentioned):
Introduction to Statistical process Control
Douglas. C Montgomery
6th Edition<br>
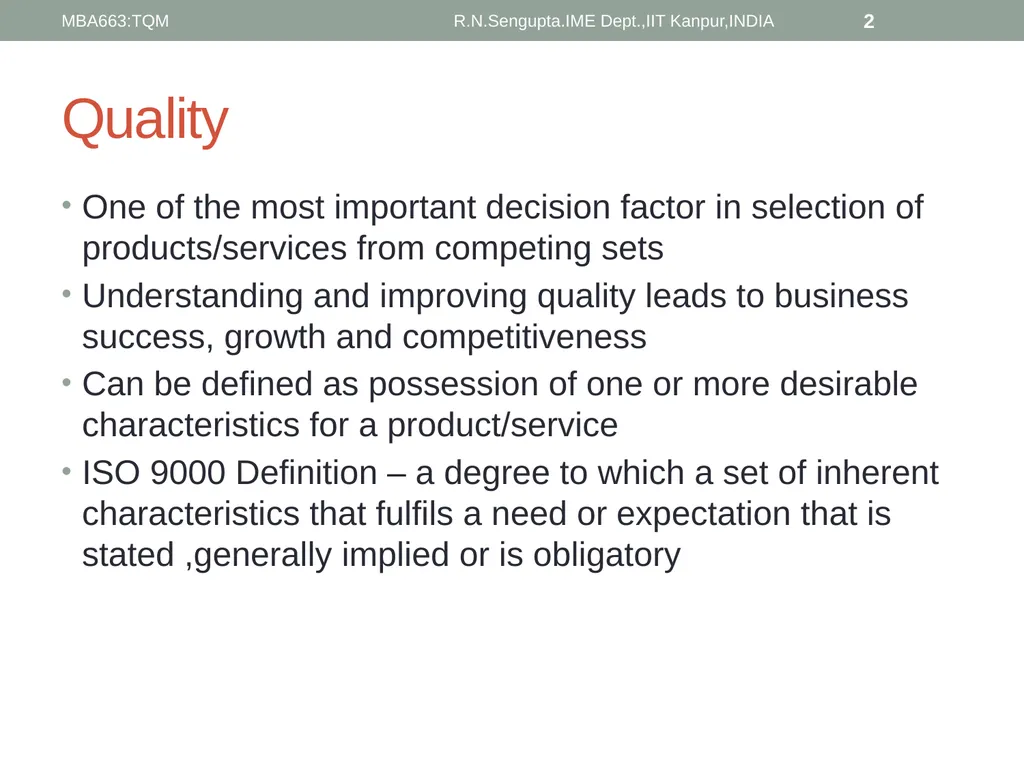
slide2. Quality One of the most important decision factor in selection of products/services from competing sets
Understanding and improving quality leads to business success, growth and competitiveness
Can be defined as possession of one or more desirable characteristics for a product/service
ISO 9000 Definition – a degree to which a set of inherent characteristics that fulfils a need or expectation that is stated ,generally implied or is obligatory R.N.Sengupta.IME Dept.,IIT Kanpur,INDIA 2 MBA663:TQM<br>
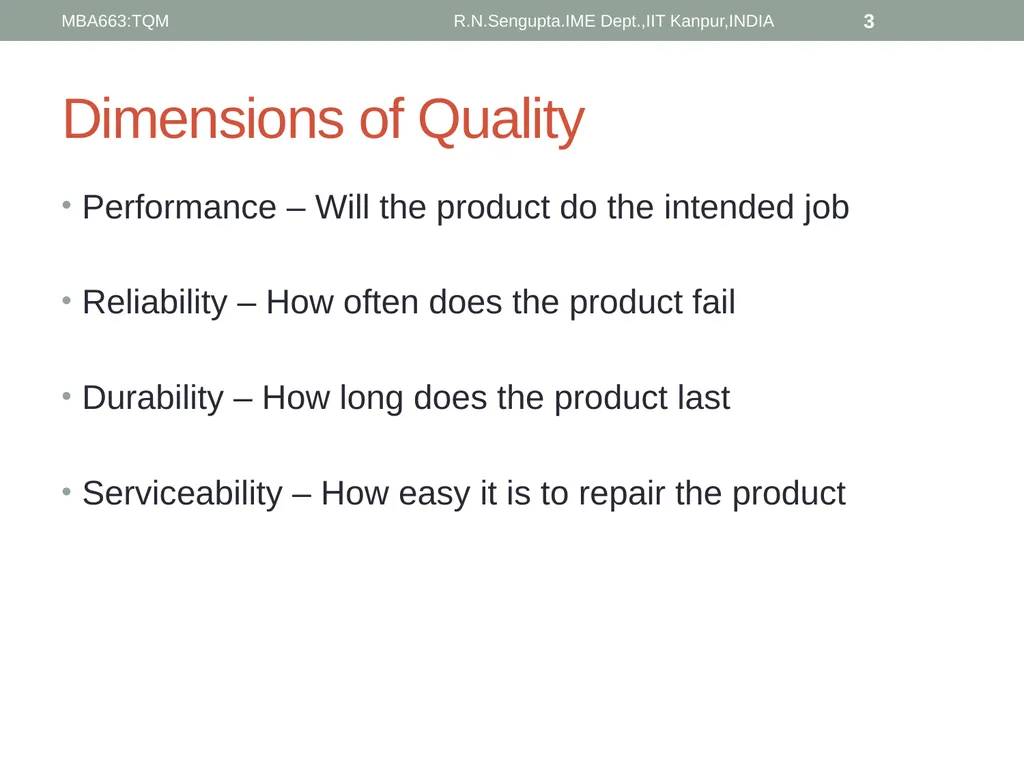
slide3. Dimensions of Quality Performance – Will the product do the intended job
Reliability – How often does the product fail
Durability – How long does the product last
Serviceability – How easy it is to repair the product R.N.Sengupta.IME Dept.,IIT Kanpur,INDIA 3 MBA663:TQM<br>
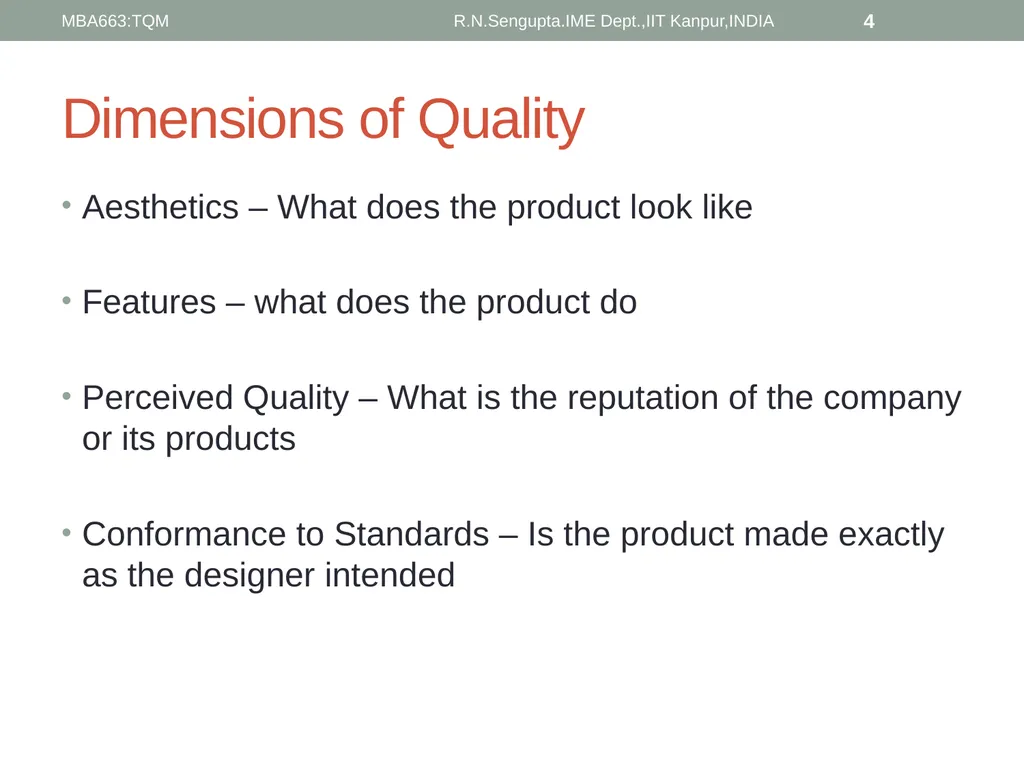
slide4. Dimensions of Quality Aesthetics – What does the product look like
Features – what does the product do
Perceived Quality – What is the reputation of the company or its products
Conformance to Standards – Is the product made exactly as the designer intended R.N.Sengupta.IME Dept.,IIT Kanpur,INDIA 4 MBA663:TQM<br>
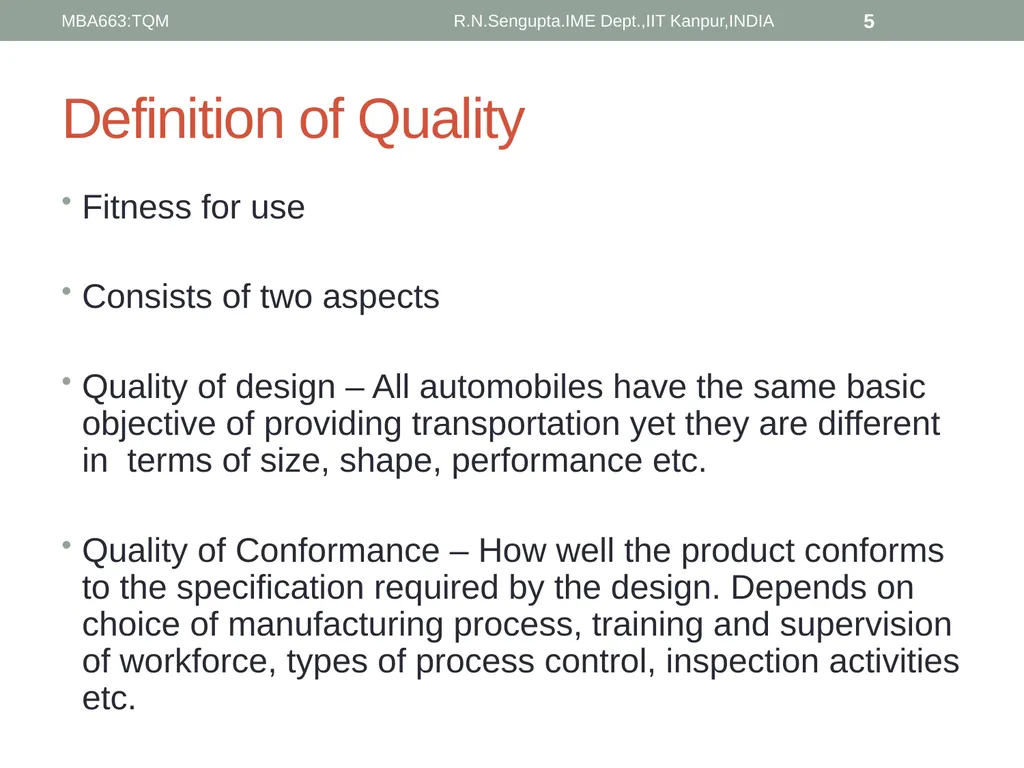
slide5. Definition of Quality Fitness for use
Consists of two aspects
Quality of design – All automobiles have the same basic objective of providing transportation yet they are different in terms of size, shape, performance etc.
Quality of Conformance – How well the product conforms to the specification required by the design. Depends on choice of manufacturing process, training and supervision of workforce, types of process control, inspection activities etc. R.N.Sengupta.IME Dept.,IIT Kanpur,INDIA 5 MBA663:TQM<br>
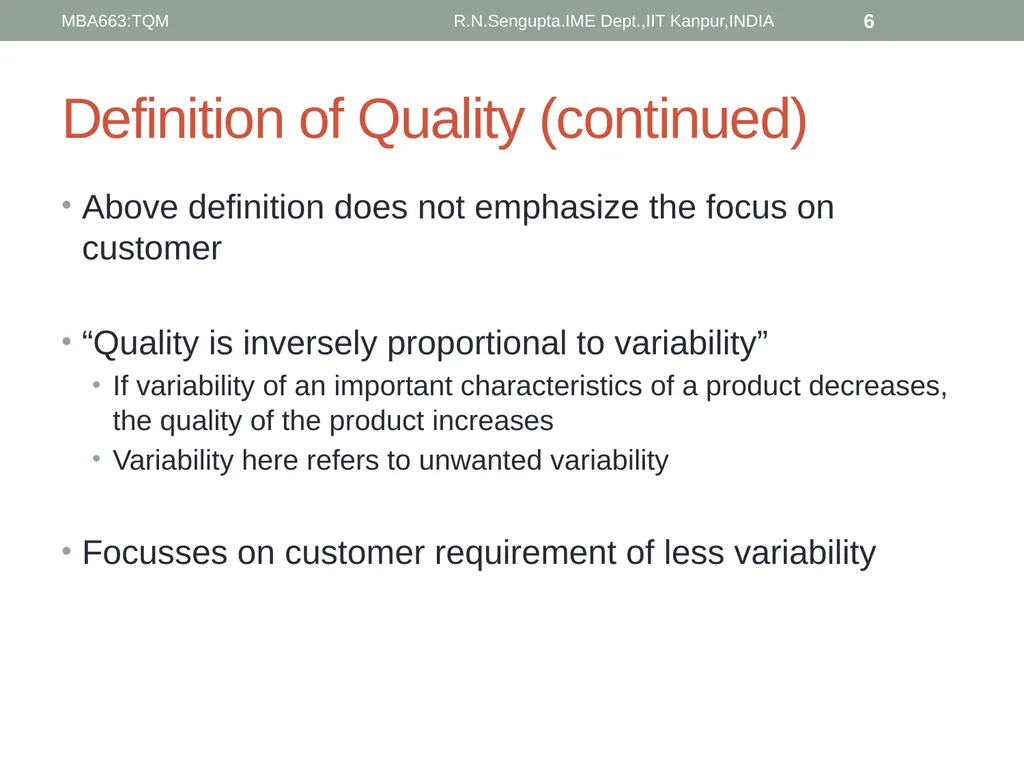
slide6. Definition of Quality (continued) Above definition does not emphasize the focus on customer
“Quality is inversely proportional to variability”
If variability of an important characteristics of a product decreases, the quality of the product increases
Variability here refers to unwanted variability
Focusses on customer requirement of less variability R.N.Sengupta.IME Dept.,IIT Kanpur,INDIA 6 MBA663:TQM<br>
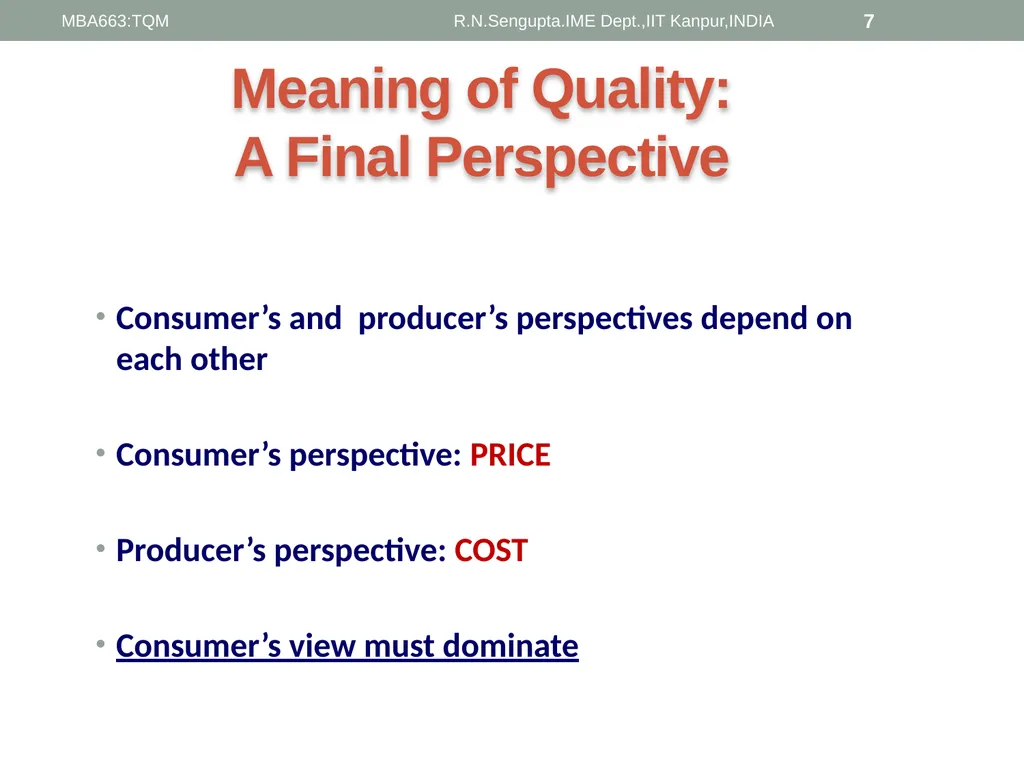
slide7. Meaning of Quality: A Final Perspective Consumer’s and producer’s perspectives depend on each other
Consumer’s perspective: PRICE
Producer’s perspective: COST
Consumer’s view must dominate 7 R.N.Sengupta.IME Dept.,IIT Kanpur,INDIA MBA663:TQM<br>
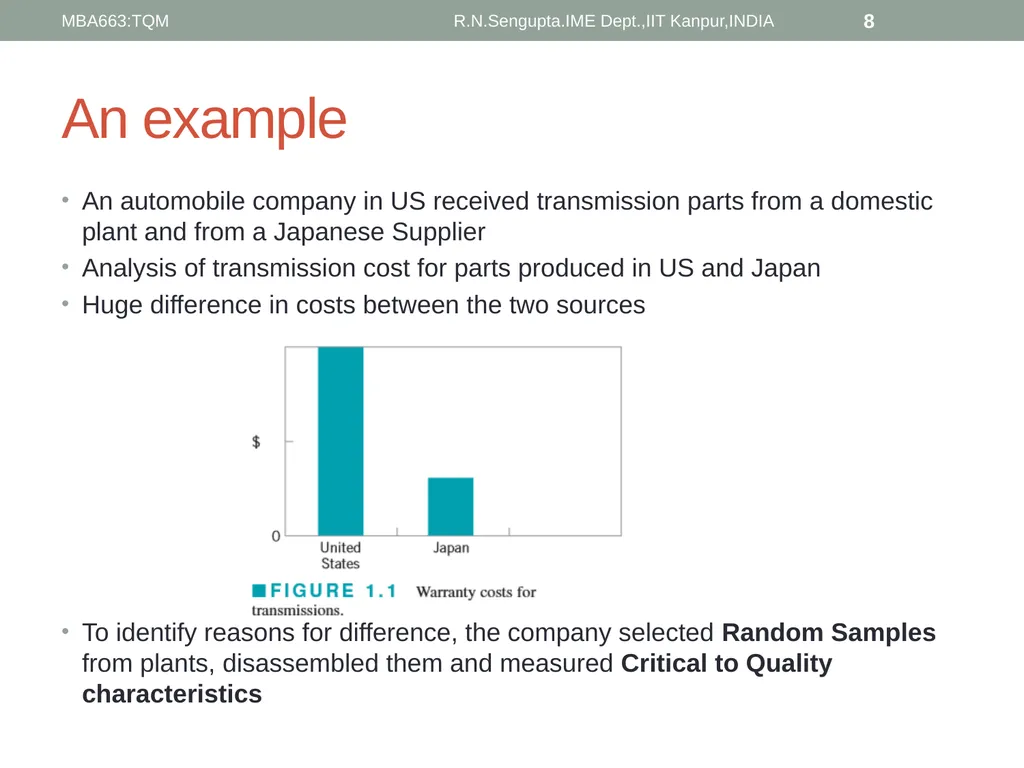
slide8. An example An automobile company in US received transmission parts from a domestic plant and from a Japanese Supplier
Analysis of transmission cost for parts produced in US and Japan
Huge difference in costs between the two sources
To identify reasons for difference, the company selected Random Samples from plants, disassembled them and measured Critical to Quality characteristics R.N.Sengupta.IME Dept.,IIT Kanpur,INDIA 8 MBA663:TQM<br>
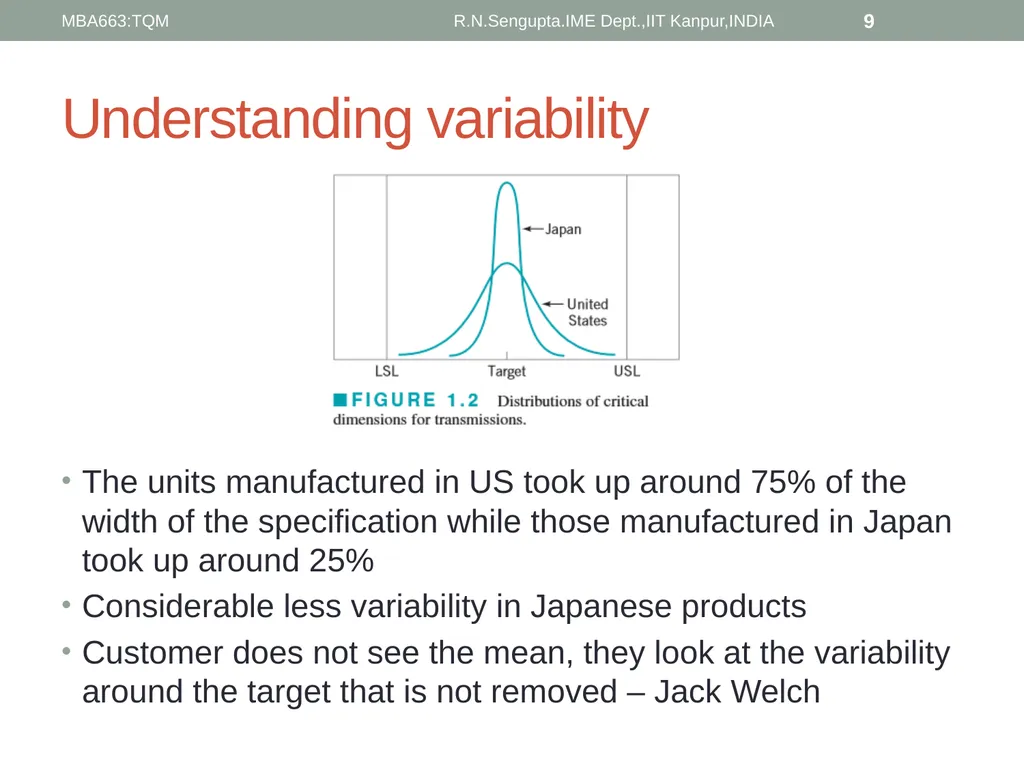
slide9. Understanding variability The units manufactured in US took up around 75% of the width of the specification while those manufactured in Japan took up around 25%
Considerable less variability in Japanese products
Customer does not see the mean, they look at the variability around the target that is not removed – Jack Welch R.N.Sengupta.IME Dept.,IIT Kanpur,INDIA 9 MBA663:TQM<br>
slide10. Quality improvement Why and how did the Japanese do it?
Why
Reduced variability leads to lower costs (Fig 1.1)
Japanese gears ran more smoothly with less noise and hence had a higher perceived quality in minds of the consumers
Fewer repairs and warranty claims -> less rework -> reduction in wasted time effort money R.N.Sengupta.IME Dept.,IIT Kanpur,INDIA 10 MBA663:TQM<br>
slide11. Quality improvement How
Quality improvement – Reduction of variability in processes and products
Reduction of waste
Specially pertinent to the service industry – improving service process leads to less effort and time in correction R.N.Sengupta.IME Dept.,IIT Kanpur,INDIA 11 MBA663:TQM<br>
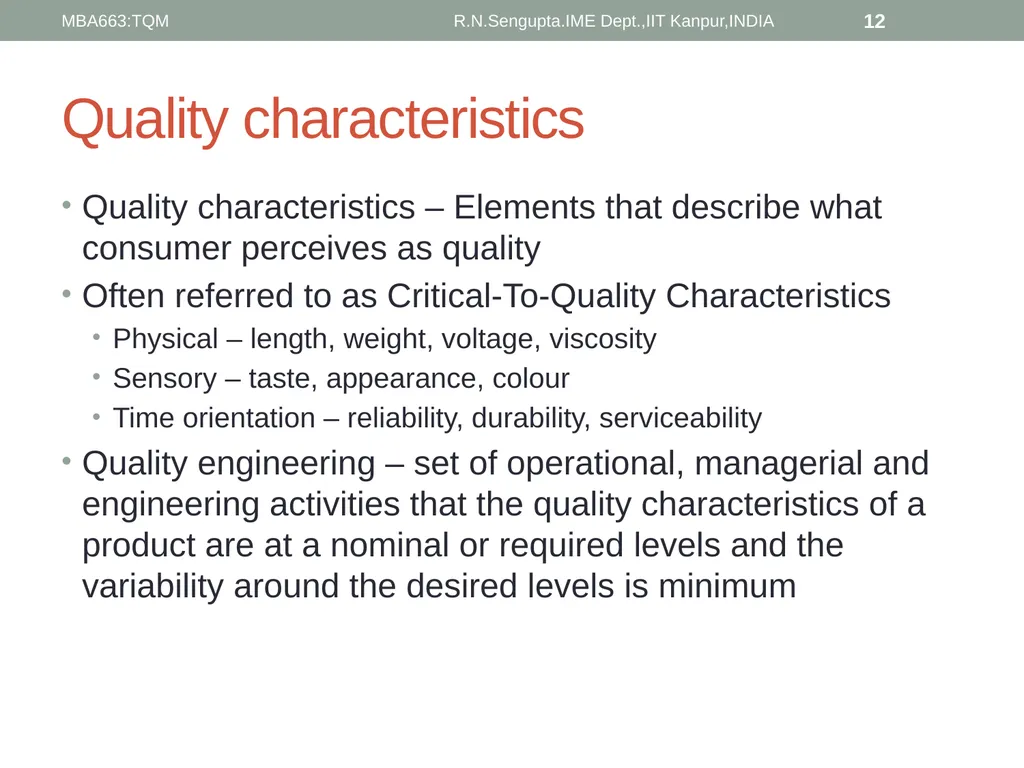
slide12. Quality characteristics Quality characteristics – Elements that describe what consumer perceives as quality
Often referred to as Critical-To-Quality Characteristics
Physical – length, weight, voltage, viscosity
Sensory – taste, appearance, colour
Time orientation – reliability, durability, serviceability
Quality engineering – set of operational, managerial and engineering activities that the quality characteristics of a product are at a nominal or required levels and the variability around the desired levels is minimum R.N.Sengupta.IME Dept.,IIT Kanpur,INDIA 12 MBA663:TQM<br>
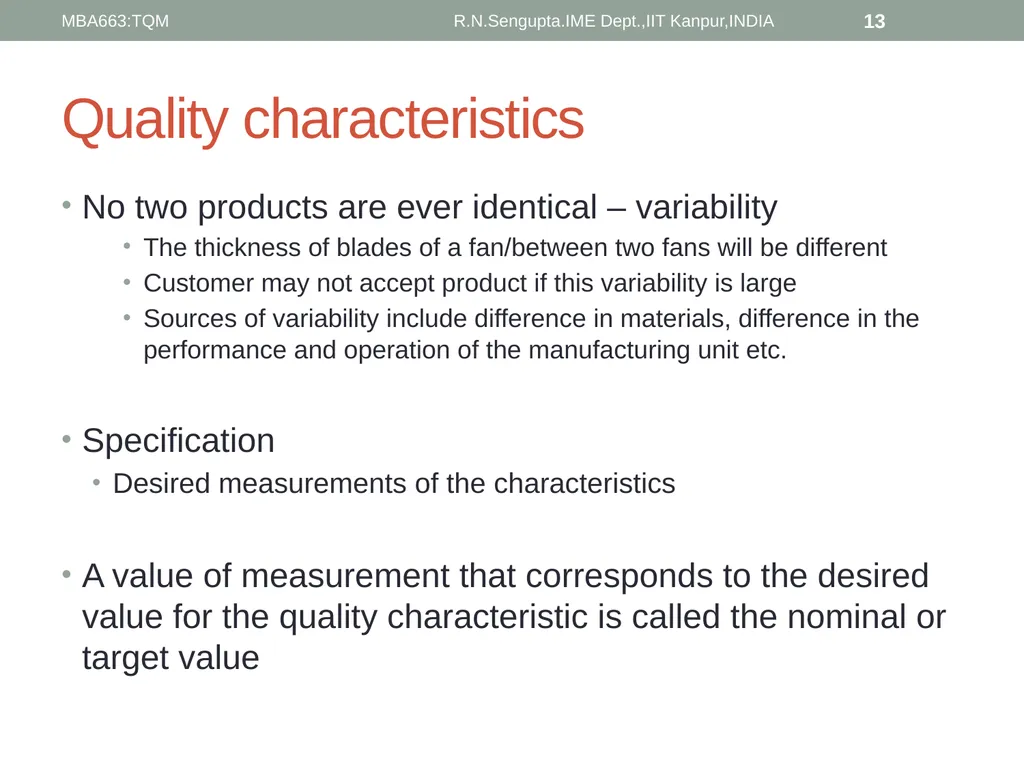
slide13. Quality characteristics No two products are ever identical – variability
The thickness of blades of a fan/between two fans will be different
Customer may not accept product if this variability is large
Sources of variability include difference in materials, difference in the performance and operation of the manufacturing unit etc.
Specification
Desired measurements of the characteristics
A value of measurement that corresponds to the desired value for the quality characteristic is called the nominal or target value R.N.Sengupta.IME Dept.,IIT Kanpur,INDIA 13 MBA663:TQM<br>
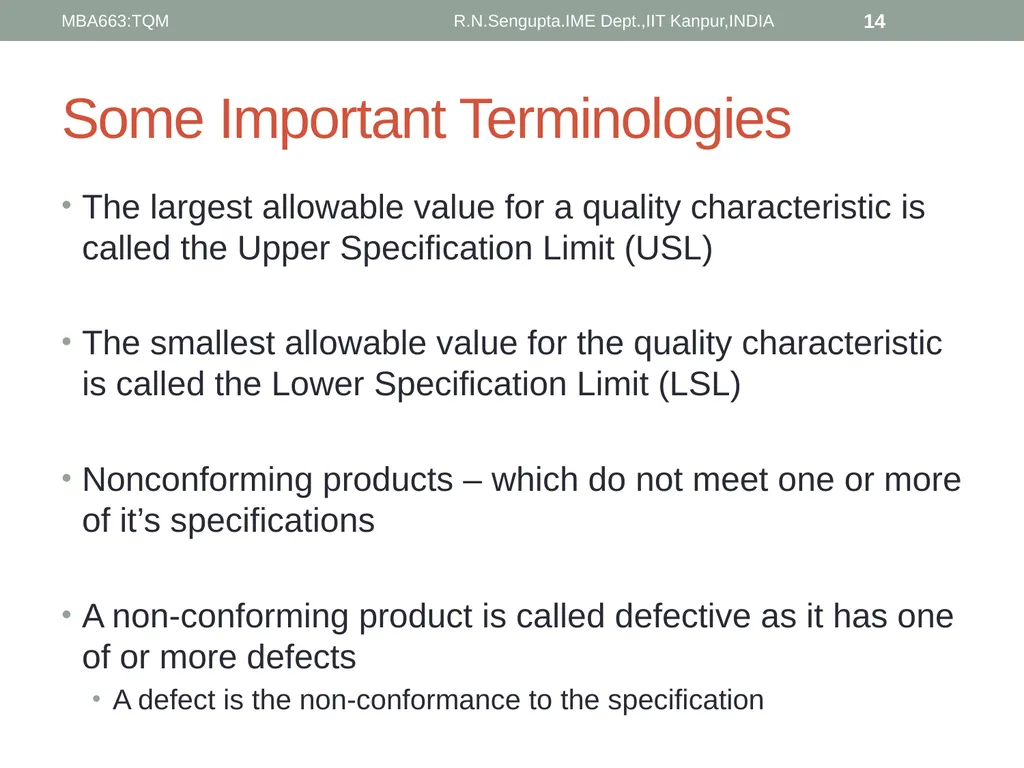
slide14. Some Important Terminologies The largest allowable value for a quality characteristic is called the Upper Specification Limit (USL)
The smallest allowable value for the quality characteristic is called the Lower Specification Limit (LSL)
Nonconforming products – which do not meet one or more of it’s specifications
A non-conforming product is called defective as it has one of or more defects
A defect is the non-conformance to the specification R.N.Sengupta.IME Dept.,IIT Kanpur,INDIA 14 MBA663:TQM<br>
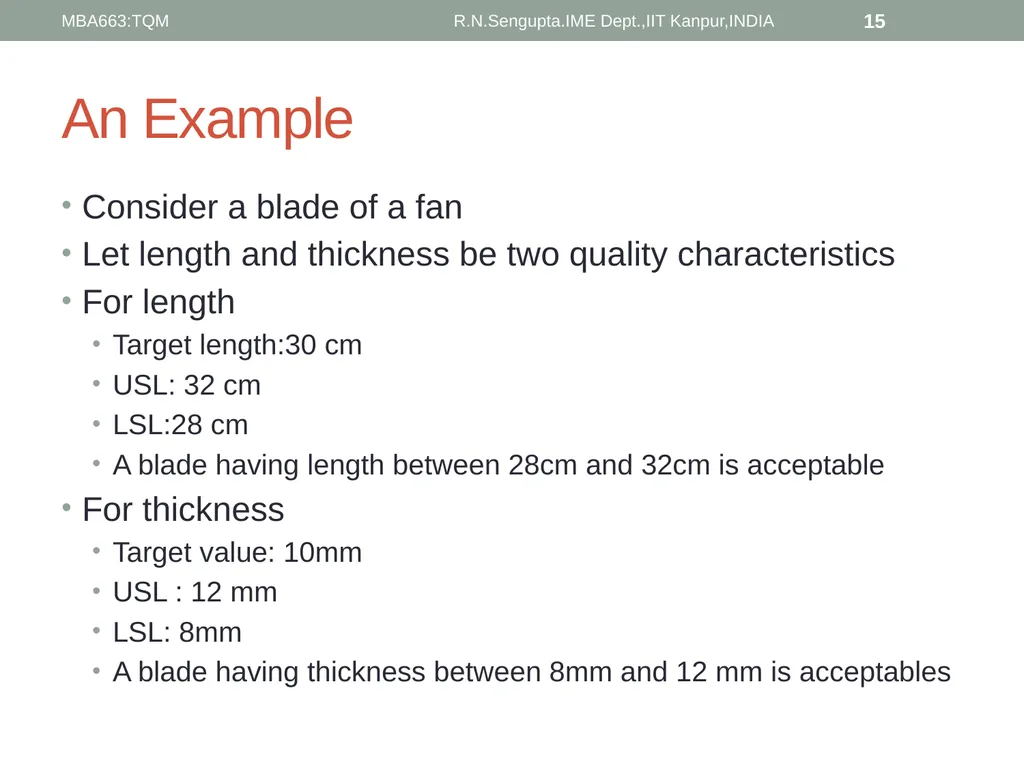
slide15. An Example Consider a blade of a fan
Let length and thickness be two quality characteristics
For length
Target length:30 cm
USL: 32 cm
LSL:28 cm
A blade having length between 28cm and 32cm is acceptable
For thickness
Target value: 10mm
USL : 12 mm
LSL: 8mm
A blade having thickness between 8mm and 12 mm is acceptables R.N.Sengupta.IME Dept.,IIT Kanpur,INDIA 15 MBA663:TQM<br>
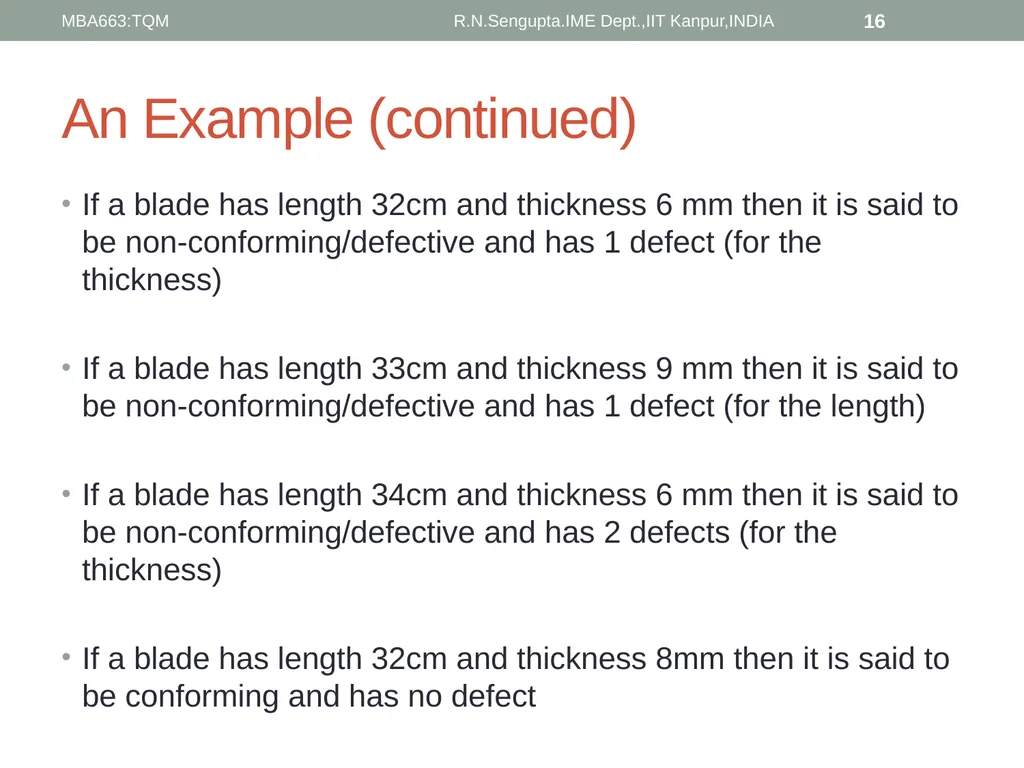
slide16. An Example (continued) If a blade has length 32cm and thickness 6 mm then it is said to be non-conforming/defective and has 1 defect (for the thickness)
If a blade has length 33cm and thickness 9 mm then it is said to be non-conforming/defective and has 1 defect (for the length)
If a blade has length 34cm and thickness 6 mm then it is said to be non-conforming/defective and has 2 defects (for the thickness)
If a blade has length 32cm and thickness 8mm then it is said to be conforming and has no defect R.N.Sengupta.IME Dept.,IIT Kanpur,INDIA 16 MBA663:TQM<br>
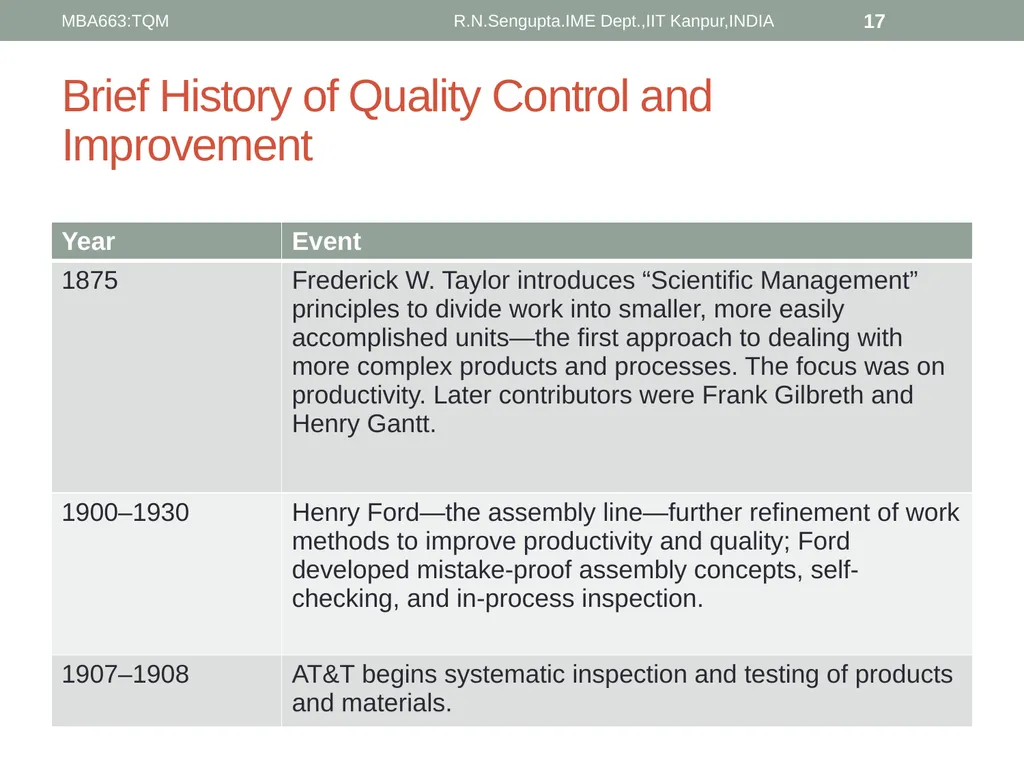
slide17. Brief History of Quality Control and Improvement R.N.Sengupta.IME Dept.,IIT Kanpur,INDIA 17 MBA663:TQM<br>
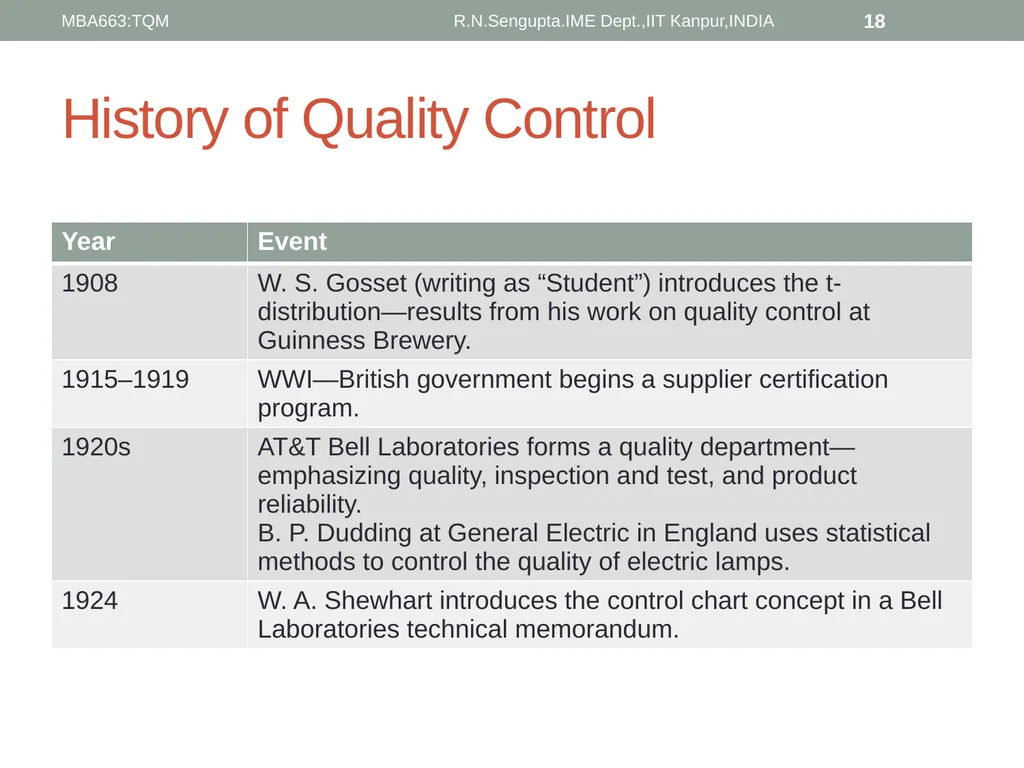
slide18. History of Quality Control R.N.Sengupta.IME Dept.,IIT Kanpur,INDIA 18 MBA663:TQM<br>
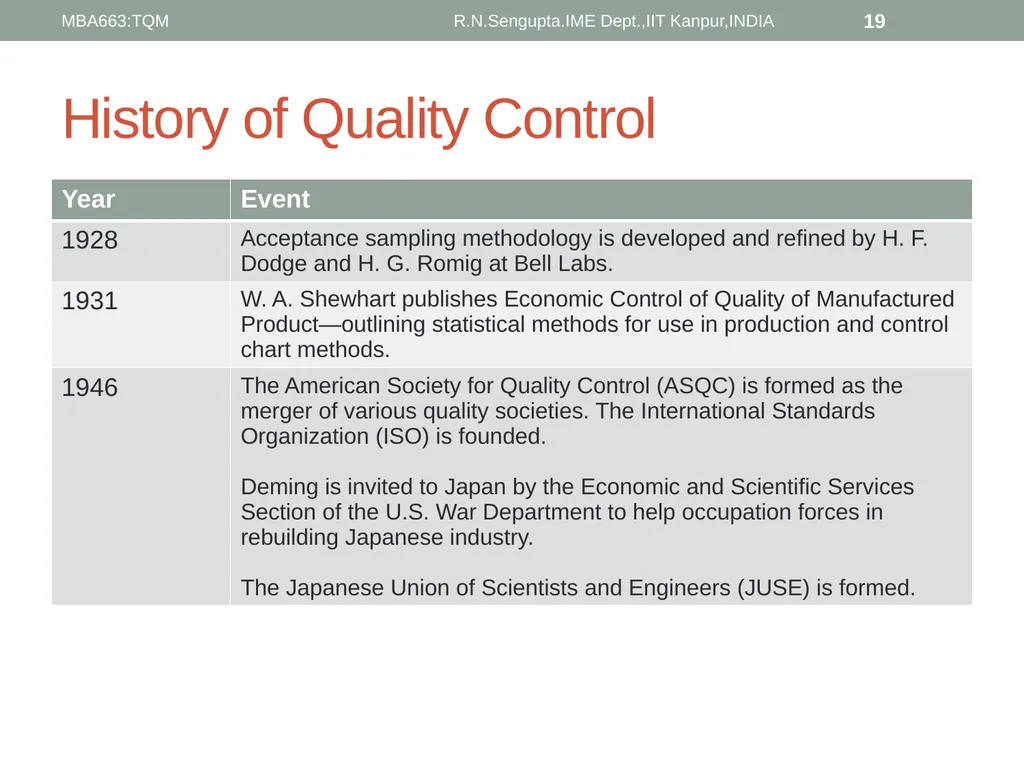
slide19. History of Quality Control R.N.Sengupta.IME Dept.,IIT Kanpur,INDIA 19 MBA663:TQM<br>
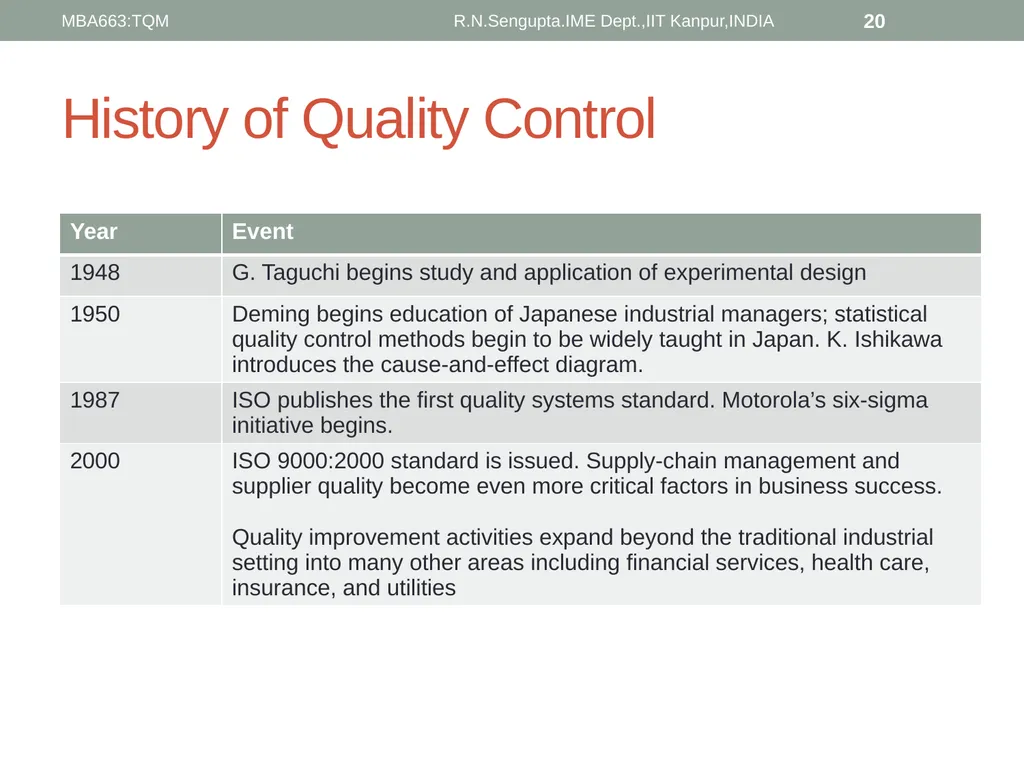
slide20. History of Quality Control R.N.Sengupta.IME Dept.,IIT Kanpur,INDIA 20 MBA663:TQM<br>
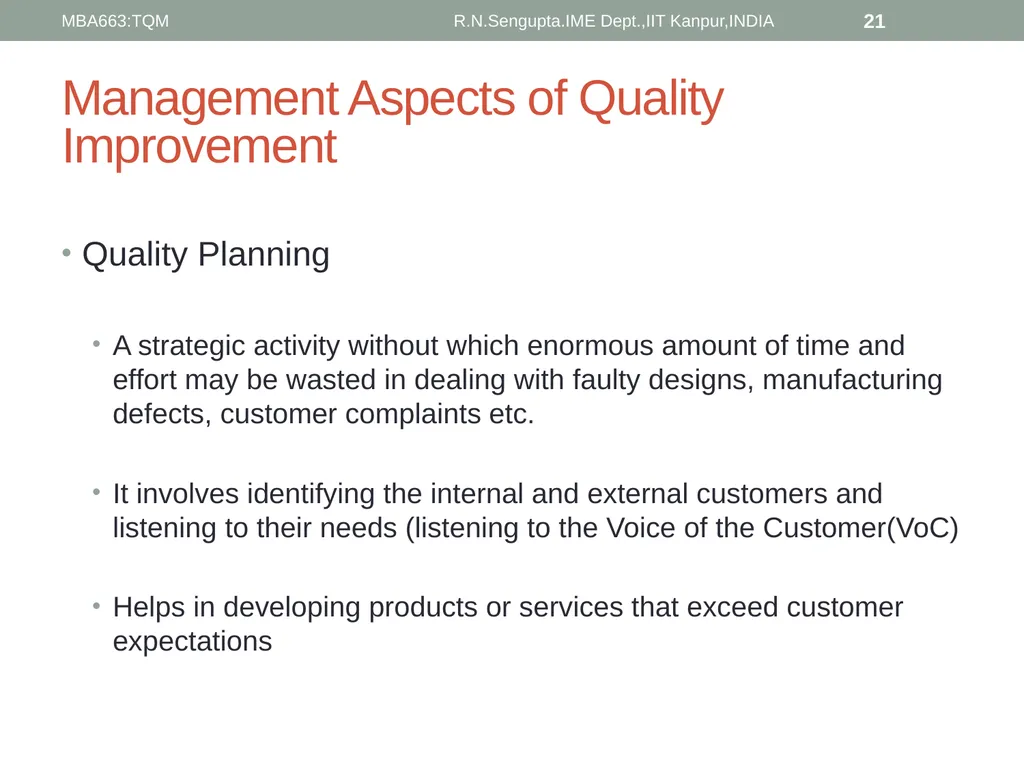
slide21. Management Aspects of Quality Improvement Quality Planning
A strategic activity without which enormous amount of time and effort may be wasted in dealing with faulty designs, manufacturing defects, customer complaints etc.
It involves identifying the internal and external customers and listening to their needs (listening to the Voice of the Customer(VoC)
Helps in developing products or services that exceed customer expectations R.N.Sengupta.IME Dept.,IIT Kanpur,INDIA 21 MBA663:TQM<br>
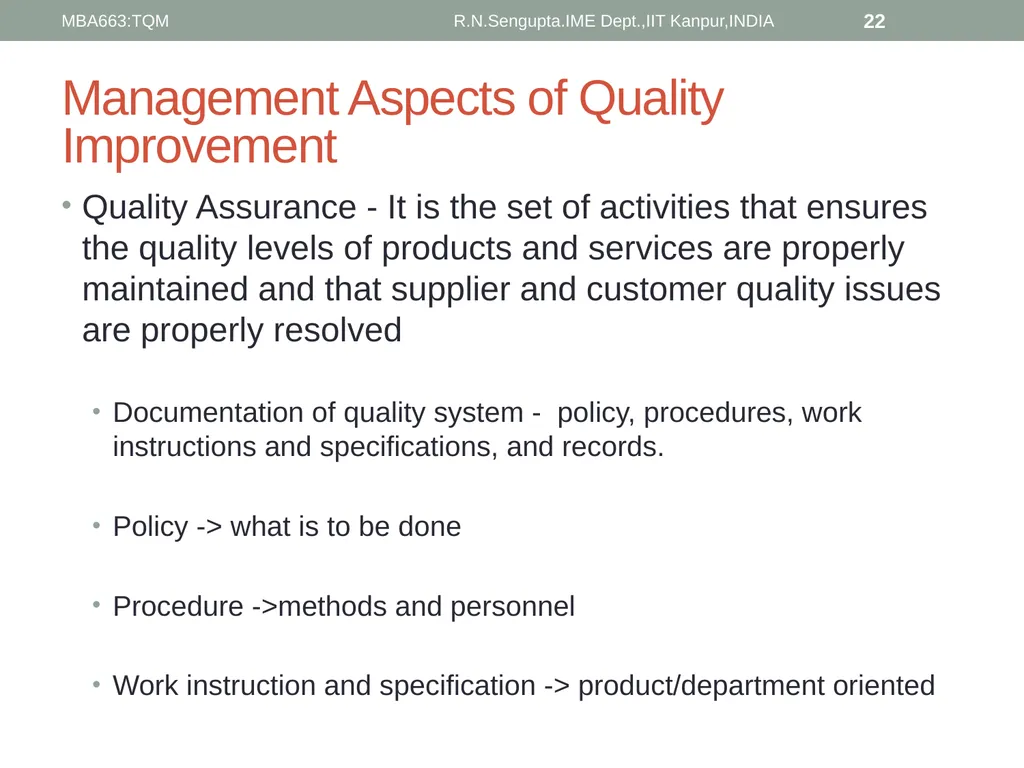
slide22. Management Aspects of Quality Improvement Quality Assurance - It is the set of activities that ensures the quality levels of products and services are properly maintained and that supplier and customer quality issues are properly resolved
Documentation of quality system - policy, procedures, work instructions and specifications, and records.
Policy -> what is to be done
Procedure ->methods and personnel
Work instruction and specification -> product/department oriented R.N.Sengupta.IME Dept.,IIT Kanpur,INDIA 22 MBA663:TQM<br>
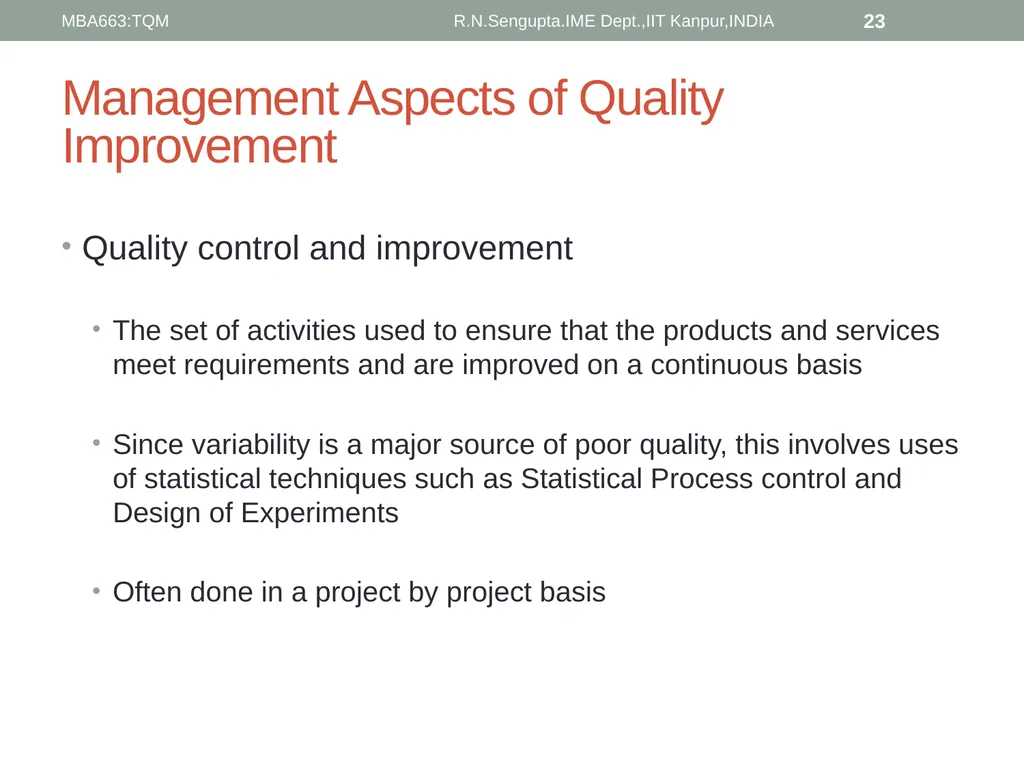
slide23. Management Aspects of Quality Improvement Quality control and improvement
The set of activities used to ensure that the products and services meet requirements and are improved on a continuous basis
Since variability is a major source of poor quality, this involves uses of statistical techniques such as Statistical Process control and Design of Experiments
Often done in a project by project basis R.N.Sengupta.IME Dept.,IIT Kanpur,INDIA 23 MBA663:TQM<br>
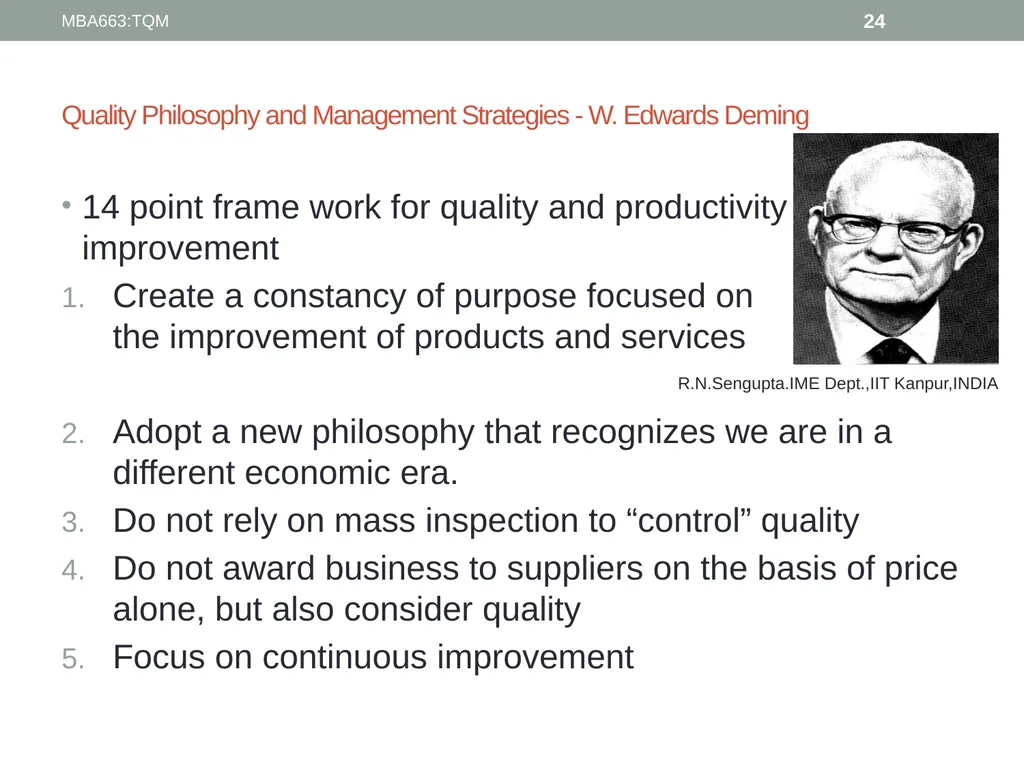
slide24. Quality Philosophy and Management Strategies - W. Edwards Deming 14 point frame work for quality and productivity improvement
Create a constancy of purpose focused on the improvement of products and services
Adopt a new philosophy that recognizes we are in a different economic era.
Do not rely on mass inspection to “control” quality
Do not award business to suppliers on the basis of price alone, but also consider quality
Focus on continuous improvement R.N.Sengupta.IME Dept.,IIT Kanpur,INDIA 24 MBA663:TQM<br>
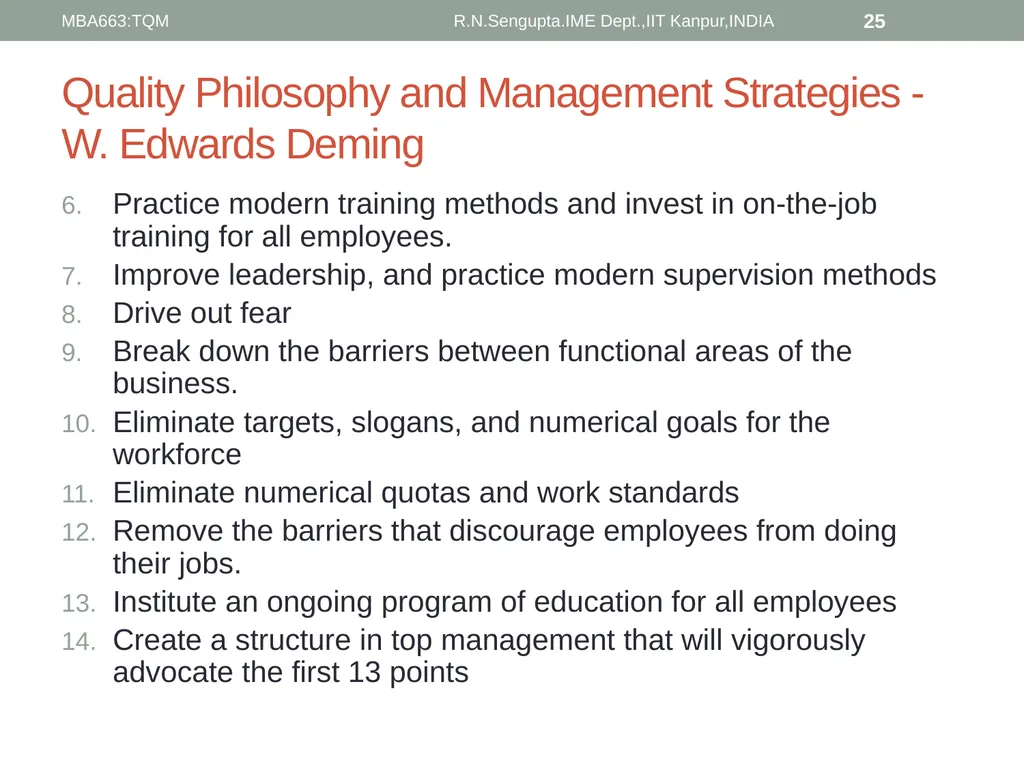
slide25. Quality Philosophy and Management Strategies - W. Edwards Deming Practice modern training methods and invest in on-the-job training for all employees.
Improve leadership, and practice modern supervision methods
Drive out fear
Break down the barriers between functional areas of the business.
Eliminate targets, slogans, and numerical goals for the workforce
Eliminate numerical quotas and work standards
Remove the barriers that discourage employees from doing their jobs.
Institute an ongoing program of education for all employees
Create a structure in top management that will vigorously advocate the first 13 points R.N.Sengupta.IME Dept.,IIT Kanpur,INDIA 25 MBA663:TQM<br>
slide26. Seven deadly sins of management: W. Edwards Deming Lack of constancy of purpose
Emphasis on short-term profits
Evaluation of performance, merit rating, and annual reviews of performance
Mobility of top management
Running a company on visible figures alone
Excessive medical costs
Excessive legal damage awards R.N.Sengupta.IME Dept.,IIT Kanpur,INDIA 26 MBA663:TQM<br>
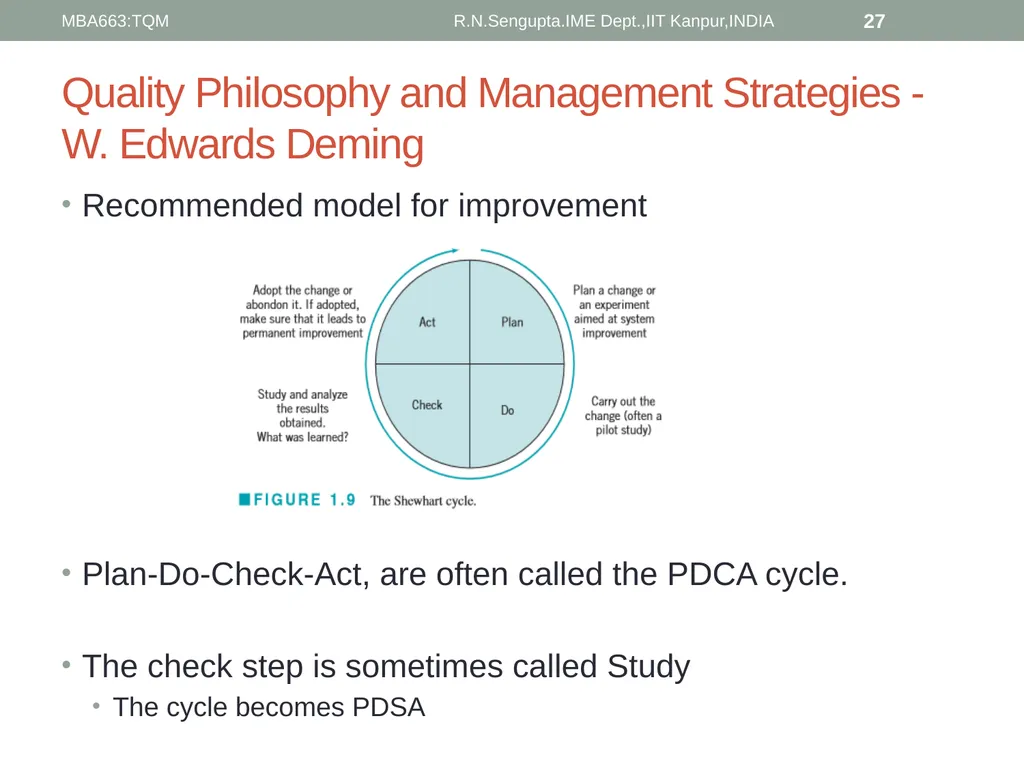
slide27. Quality Philosophy and Management Strategies - W. Edwards Deming Recommended model for improvement
Plan-Do-Check-Act, are often called the PDCA cycle.
The check step is sometimes called Study
The cycle becomes PDSA R.N.Sengupta.IME Dept.,IIT Kanpur,INDIA 27 MBA663:TQM<br>
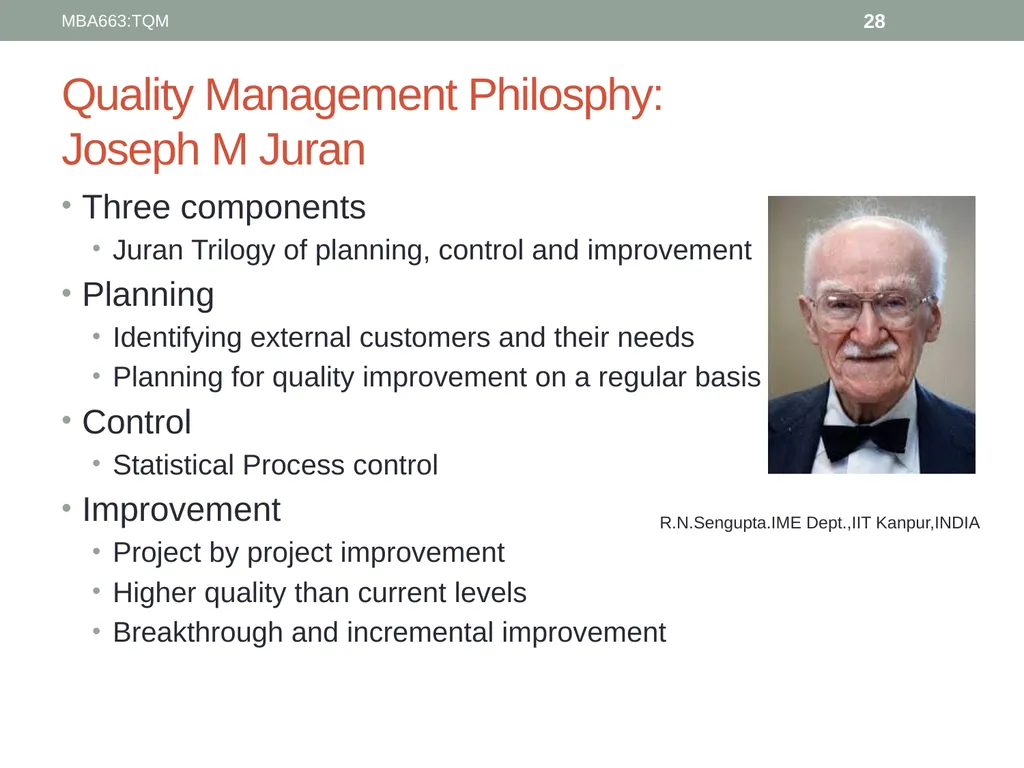
slide28. Quality Management Philosphy: Joseph M Juran Three components
Juran Trilogy of planning, control and improvement
Planning
Identifying external customers and their needs
Planning for quality improvement on a regular basis
Control
Statistical Process control
Improvement
Project by project improvement
Higher quality than current levels
Breakthrough and incremental improvement R.N.Sengupta.IME Dept.,IIT Kanpur,INDIA 28 MBA663:TQM<br>
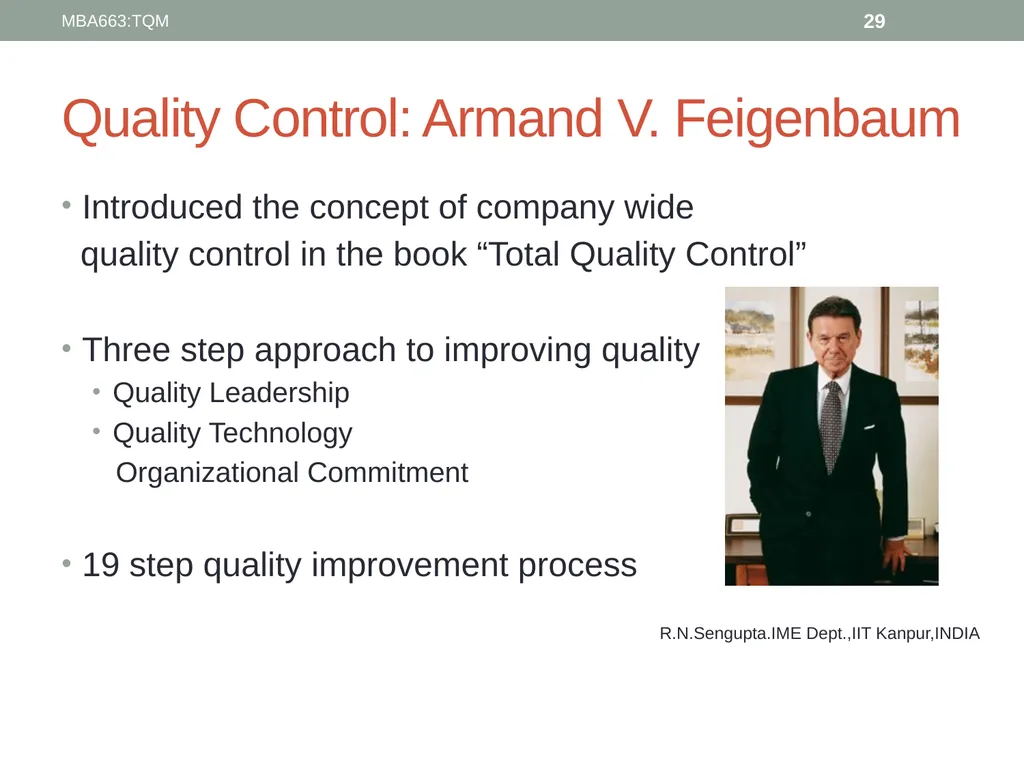
slide29. Quality Control: Armand V. Feigenbaum Introduced the concept of company wide
quality control in the book “Total Quality Control”
Three step approach to improving quality
Quality Leadership
Quality Technology
Organizational Commitment
19 step quality improvement process R.N.Sengupta.IME Dept.,IIT Kanpur,INDIA 29 MBA663:TQM<br>
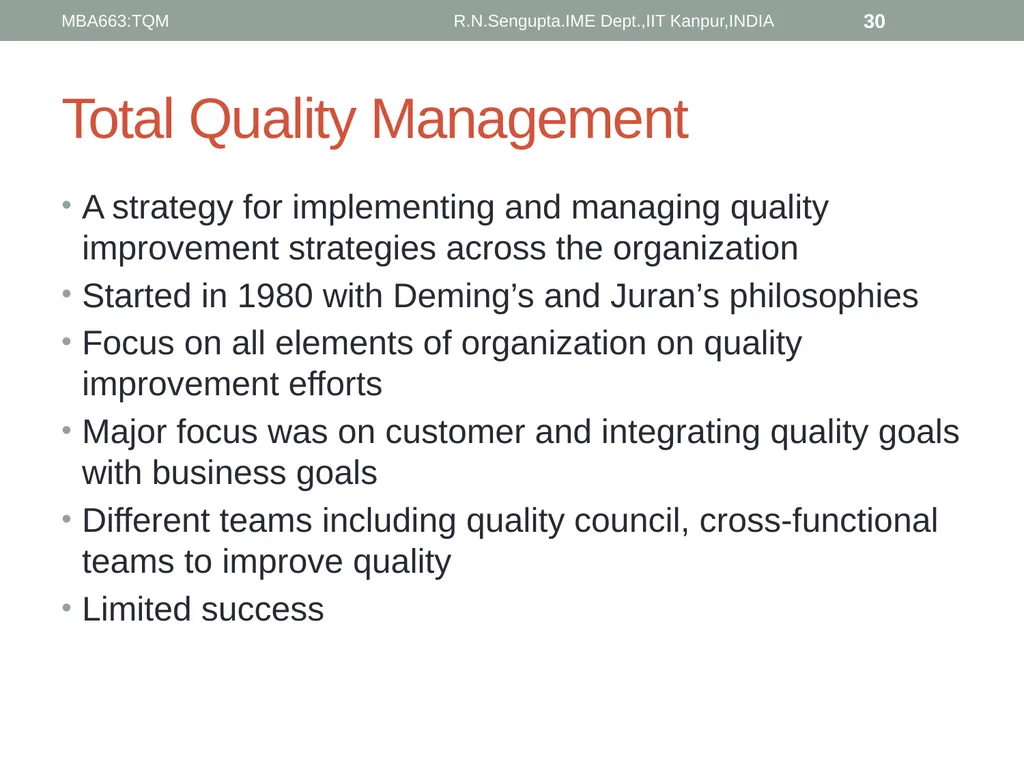
slide30. Total Quality Management A strategy for implementing and managing quality improvement strategies across the organization
Started in 1980 with Deming’s and Juran’s philosophies
Focus on all elements of organization on quality improvement efforts
Major focus was on customer and integrating quality goals with business goals
Different teams including quality council, cross-functional teams to improve quality
Limited success R.N.Sengupta.IME Dept.,IIT Kanpur,INDIA 30 MBA663:TQM<br>
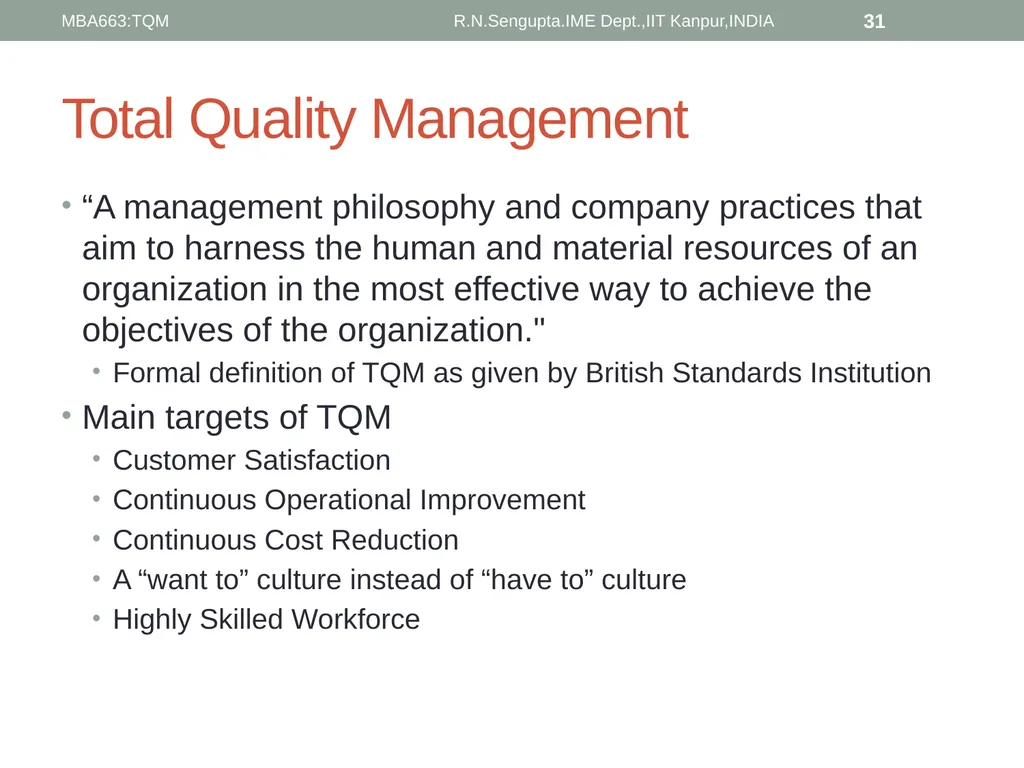
slide31. Total Quality Management “A management philosophy and company practices that aim to harness the human and material resources of an organization in the most effective way to achieve the objectives of the organization."
Formal definition of TQM as given by British Standards Institution
Main targets of TQM
Customer Satisfaction
Continuous Operational Improvement
Continuous Cost Reduction
A “want to” culture instead of “have to” culture
Highly Skilled Workforce R.N.Sengupta.IME Dept.,IIT Kanpur,INDIA 31 MBA663:TQM<br>
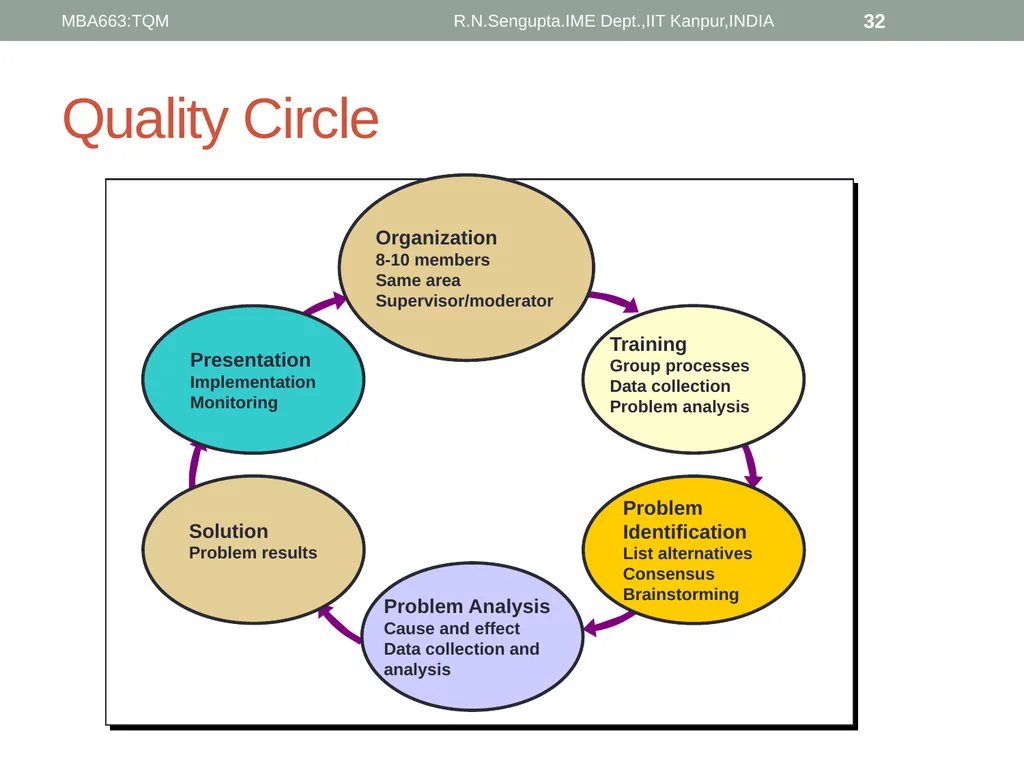
slide32. Quality Circle R.N.Sengupta.IME Dept.,IIT Kanpur,INDIA 32 MBA663:TQM<br>
slide33. Reasons for Limited Success Ineffective training and lack of proper impact measurement
Major focus was on customer and integrating quality goals with business goals
Inadequate use of statistical methods and insufficient recognition of variability reduction as a prime objective
General as opposed to specific business-results-oriented objectives
Too much emphasis on widespread training as opposed to focused technical education
Wrapping around ineffective programs like Zero Defects, Quality is free etc. R.N.Sengupta.IME Dept.,IIT Kanpur,INDIA 33 MBA663:TQM<br>
slide34. Basic Ideas of Probability distribution Consider the rolling of a dice
Total there are 6 possible outcomes (1,2,3,4,5,6)(Sample Space)
Say let X(random variable) denote the outcome 5 (when we toss a dice and a 5 appears)
So probability(X=5)=1/6(No of favourable outcome/total possible outcomes)
A probability distribution function can be thought of as a mathematical function which gives the probability for an outcome for a particular random variable R.N.Sengupta.IME Dept.,IIT Kanpur,INDIA 34 MBA663:TQM<br>
slide35. PMF and PDF Probability distribution functions can be for discrete and continuous events
Discrete – When the sample space is made of discrete events like tossing a dice will always have an outcome from the set(1,2,3,4,5,6)
Continuous- When the sample space consists of continuous numbers like temperature of a room (it can be any continuous value between say 15 and 50 like 15.51 or 16.72)
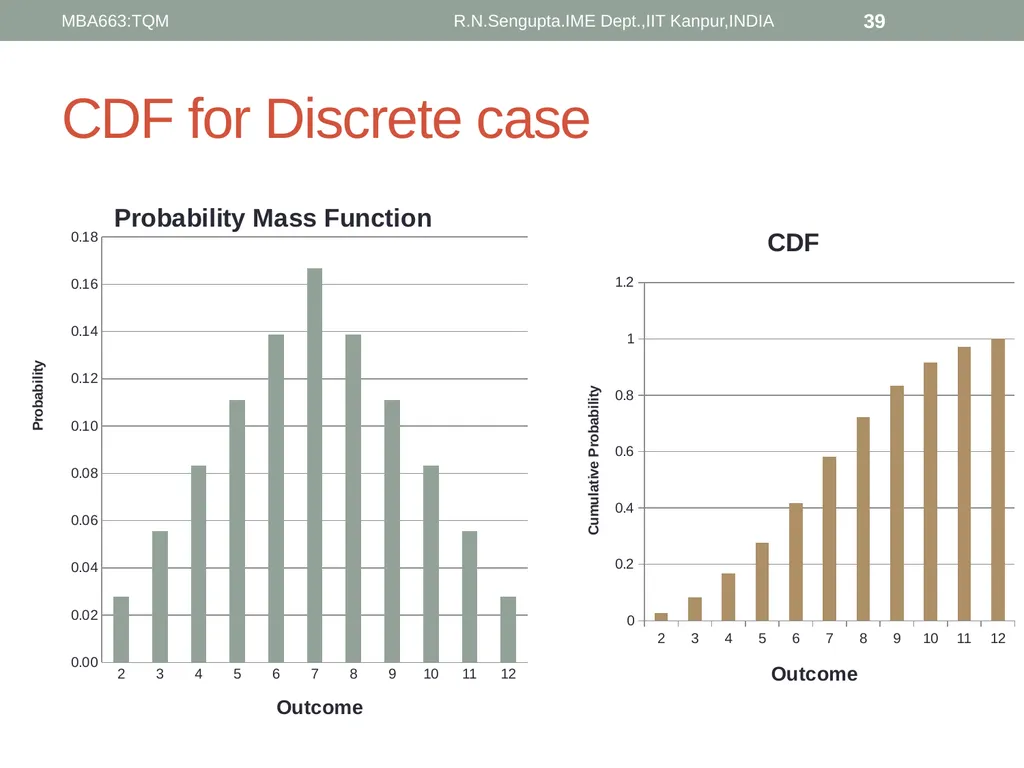
For the discrete case, the probability distribution is termed as Probability Mass Function(PMF)
For the continuous case, the probability distribution is termed as Probability Density Function(PDF) R.N.Sengupta.IME Dept.,IIT Kanpur,INDIA 35 MBA663:TQM<br>
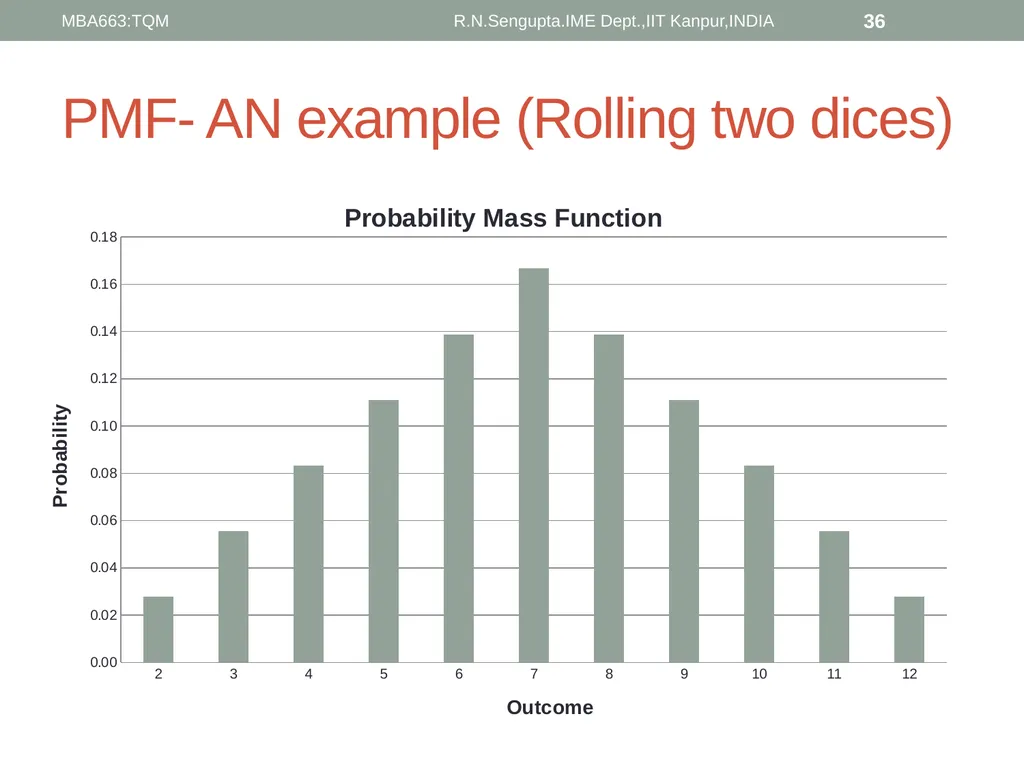
slide36. PMF- AN example (Rolling two dices) R.N.Sengupta.IME Dept.,IIT Kanpur,INDIA 36 MBA663:TQM<br>
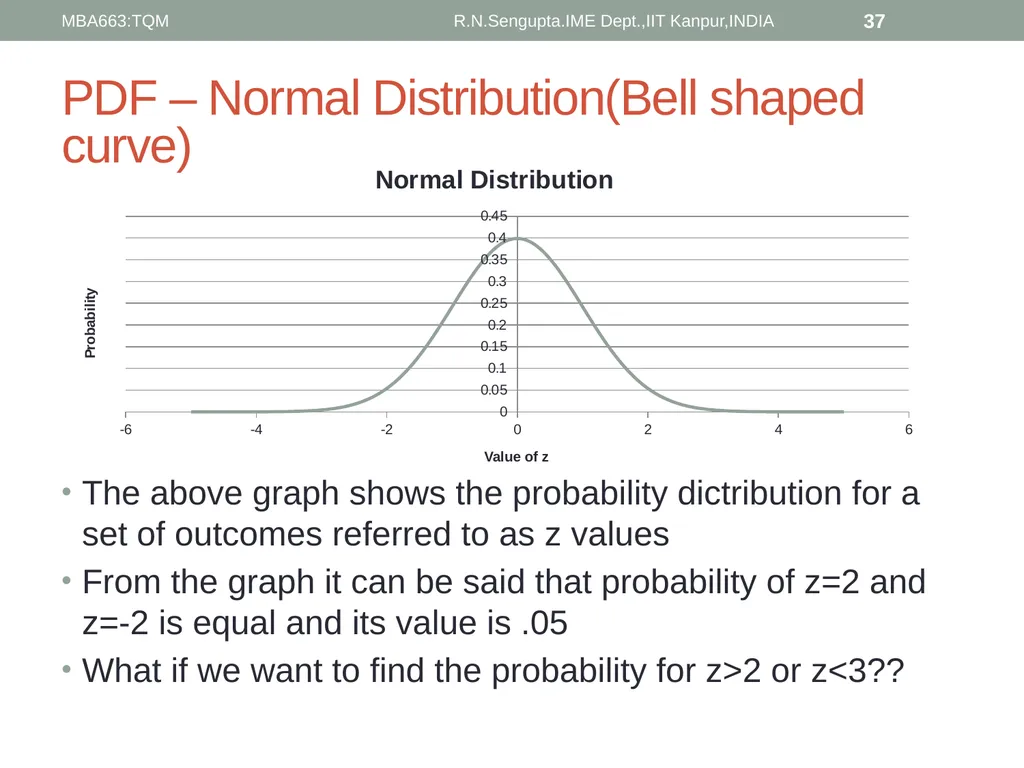
slide37. PDF – Normal Distribution(Bell shaped curve) The above graph shows the probability dictribution for a set of outcomes referred to as z values
From the graph it can be said that probability of z=2 and z=-2 is equal and its value is .05
What if we want to find the probability for z>2 or z<3?? R.N.Sengupta.IME Dept.,IIT Kanpur,INDIA 37 MBA663:TQM<br>
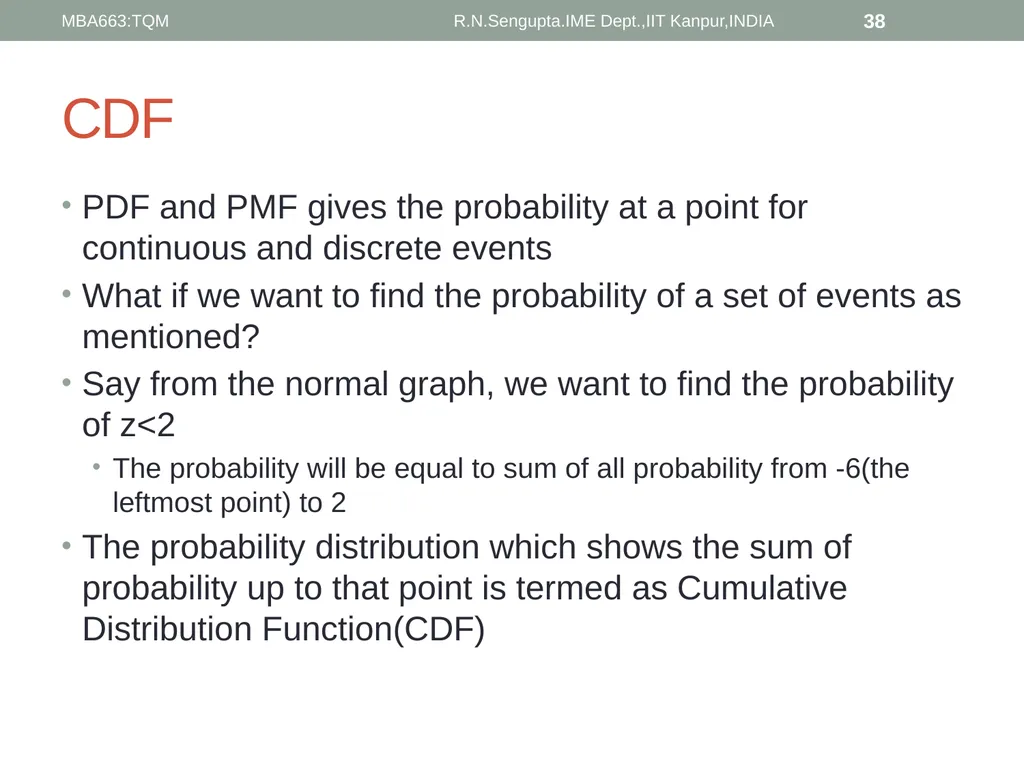
slide38. CDF PDF and PMF gives the probability at a point for continuous and discrete events
What if we want to find the probability of a set of events as mentioned?
Say from the normal graph, we want to find the probability of z<2
The probability will be equal to sum of all probability from -6(the leftmost point) to 2
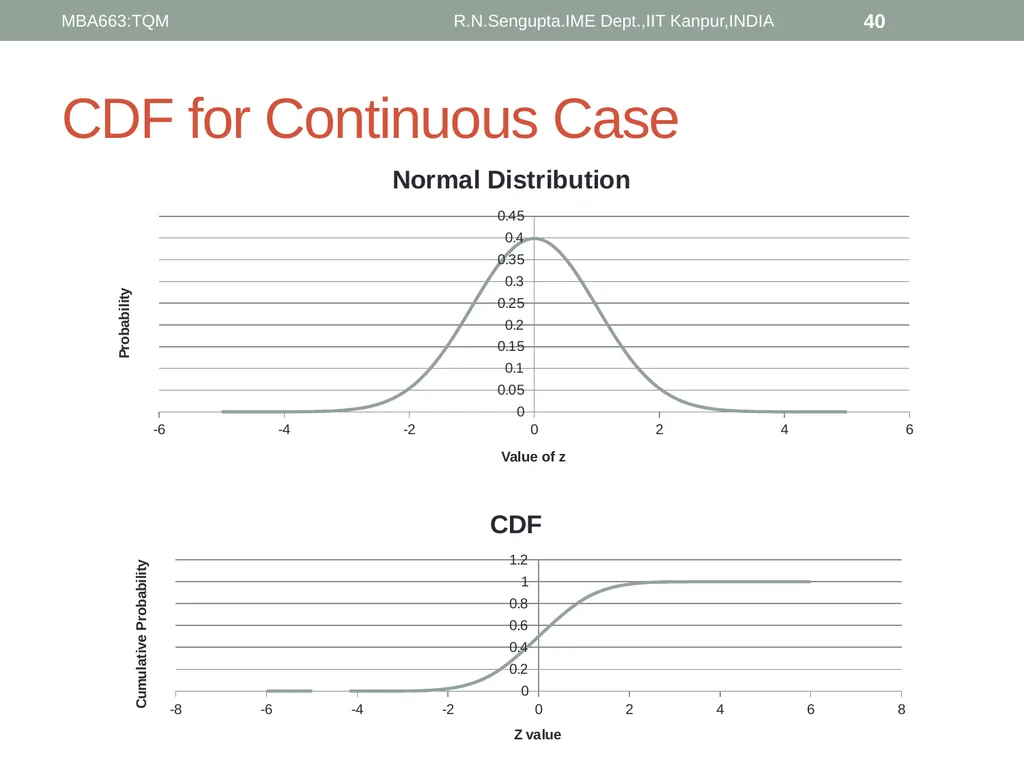
The probability distribution which shows the sum of probability up to that point is termed as Cumulative Distribution Function(CDF) R.N.Sengupta.IME Dept.,IIT Kanpur,INDIA 38 MBA663:TQM<br>
slide39. CDF for Discrete case R.N.Sengupta.IME Dept.,IIT Kanpur,INDIA 39 MBA663:TQM<br>
slide40. CDF for Continuous Case R.N.Sengupta.IME Dept.,IIT Kanpur,INDIA 40 MBA663:TQM<br>
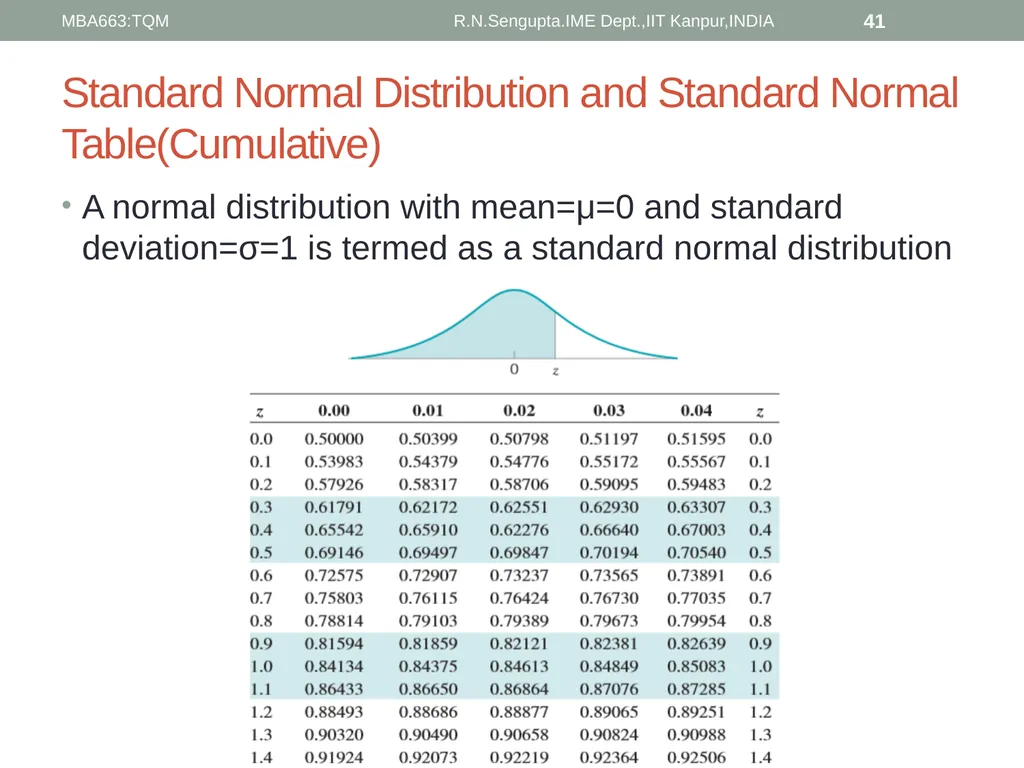
slide41. Standard Normal Distribution and Standard Normal Table(Cumulative) A normal distribution with mean=μ=0 and standard deviation=σ=1 is termed as a standard normal distribution R.N.Sengupta.IME Dept.,IIT Kanpur,INDIA 41 MBA663:TQM<br>
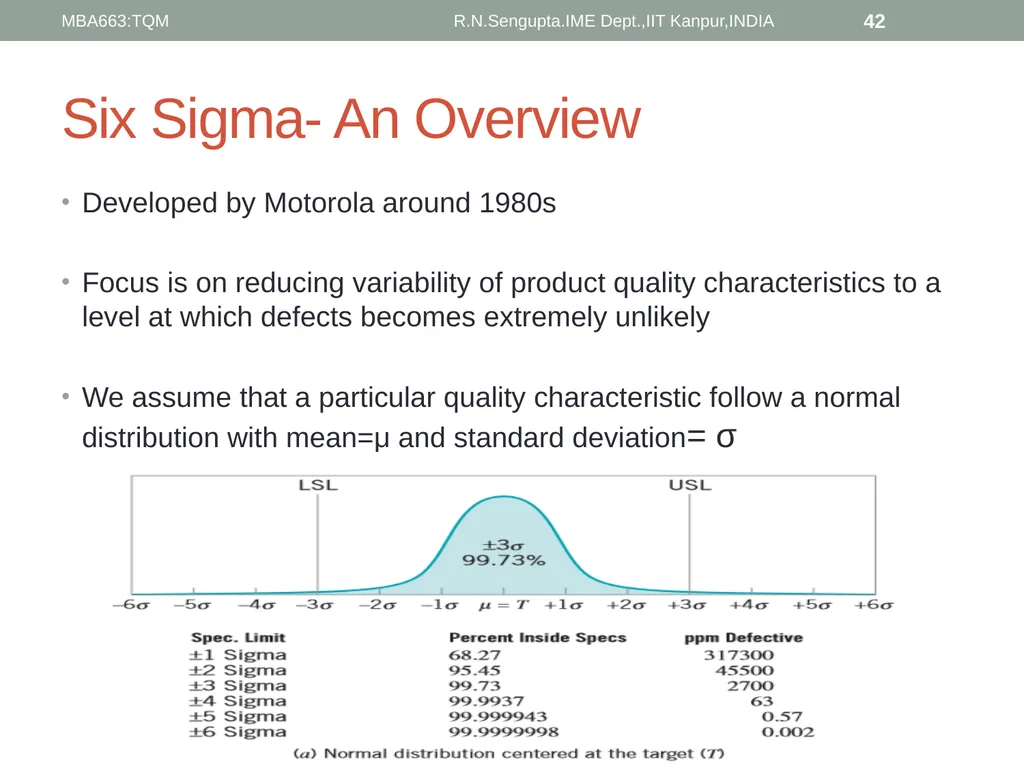
slide42. Six Sigma- An Overview Developed by Motorola around 1980s
Focus is on reducing variability of product quality characteristics to a level at which defects becomes extremely unlikely
We assume that a particular quality characteristic follow a normal distribution with mean=μ and standard deviation= σ R.N.Sengupta.IME Dept.,IIT Kanpur,INDIA 42 MBA663:TQM<br>
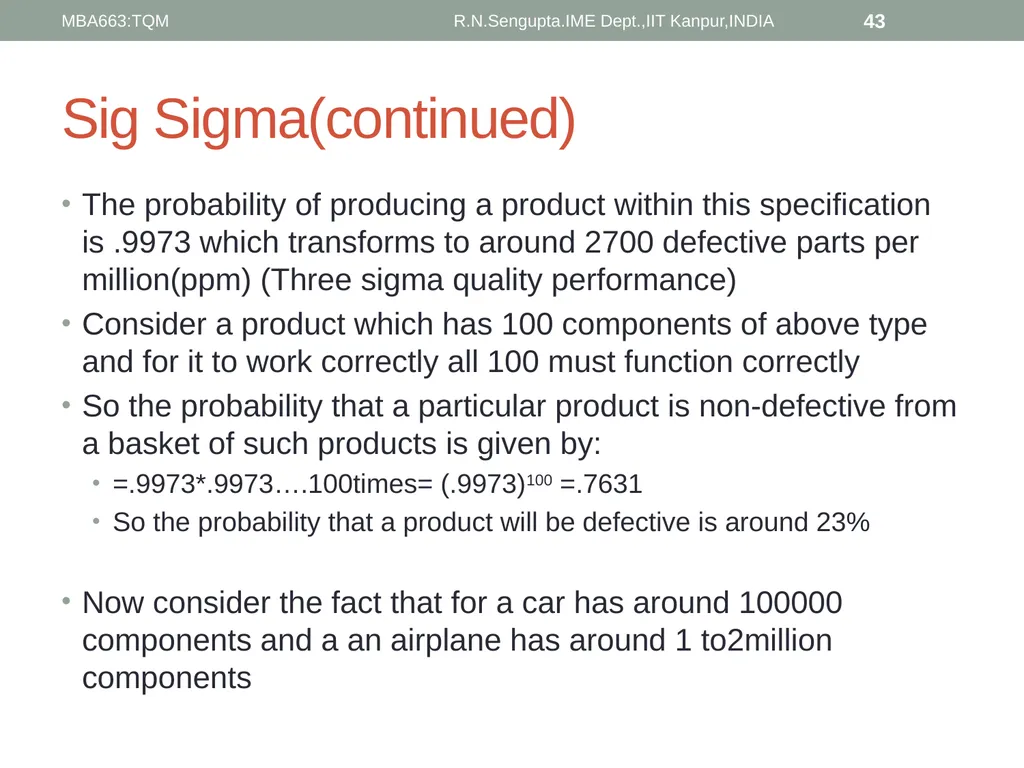
slide43. Sig Sigma(continued) The probability of producing a product within this specification is .9973 which transforms to around 2700 defective parts per million(ppm) (Three sigma quality performance)
Consider a product which has 100 components of above type and for it to work correctly all 100 must function correctly
So the probability that a particular product is non-defective from a basket of such products is given by:
=.9973*.9973….100times= (.9973)100 =.7631
So the probability that a product will be defective is around 23%
Now consider the fact that for a car has around 100000 components and a an airplane has around 1 to2million components R.N.Sengupta.IME Dept.,IIT Kanpur,INDIA 43 MBA663:TQM<br>
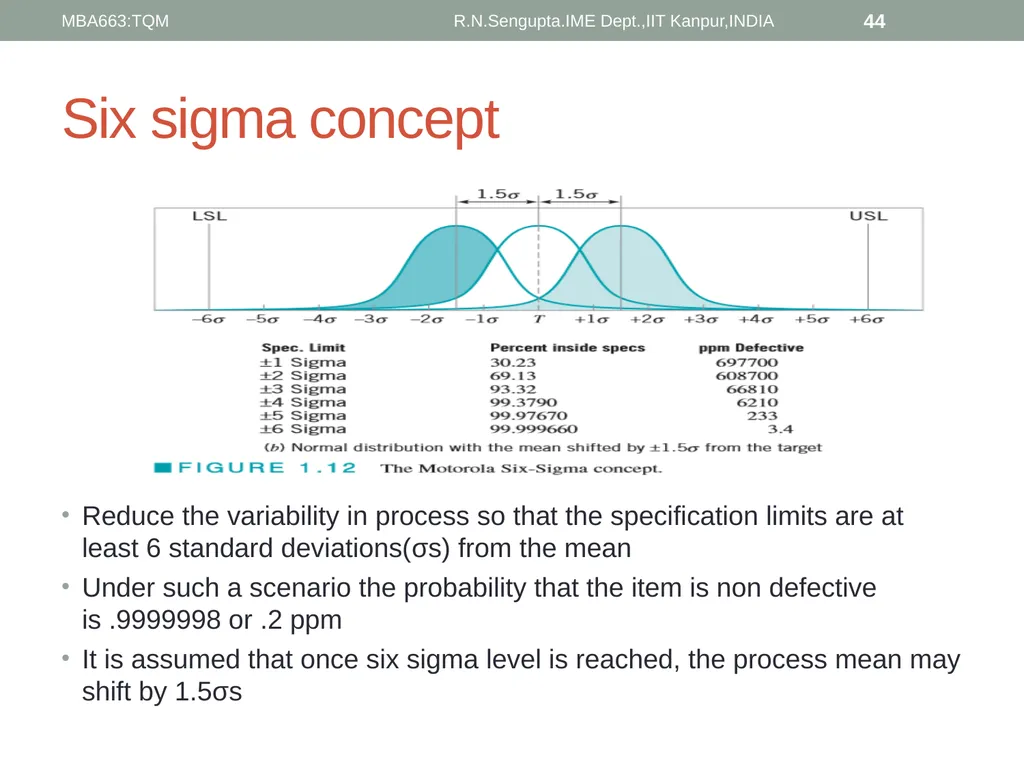
slide44. Six sigma concept Reduce the variability in process so that the specification limits are at least 6 standard deviations(σs) from the mean
Under such a scenario the probability that the item is non defective is .9999998 or .2 ppm
It is assumed that once six sigma level is reached, the process mean may shift by 1.5σs R.N.Sengupta.IME Dept.,IIT Kanpur,INDIA 44 MBA663:TQM<br>
slide45. Six Sigma – An Overview Six sigma is used for improving corporate business performance by improving quality and lowering costs
Individuals having special training on statistical methods and quality management/improvement tools are involved in implementing six sigma quality improvements
Designated as Green Belt(least experienced), Black Belt(team leads) and Master Black Belt(technical experts who work with multiple teams and share their expertise) R.N.Sengupta.IME Dept.,IIT Kanpur,INDIA 45 MBA663:TQM<br>
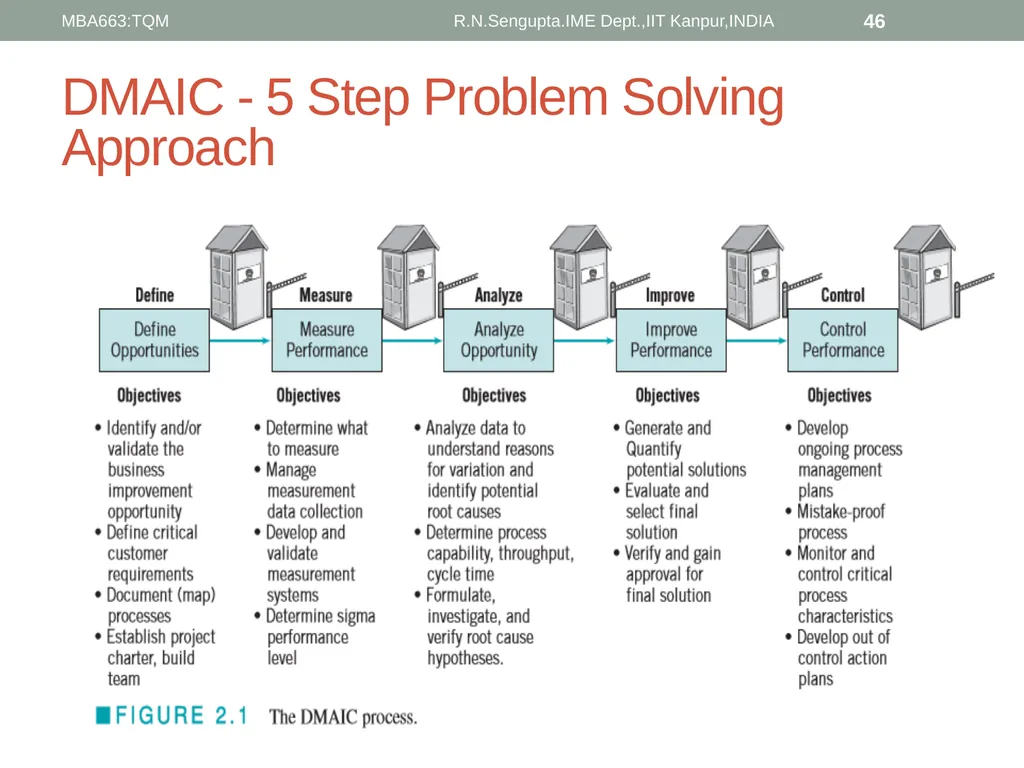
slide46. DMAIC - 5 Step Problem Solving Approach R.N.Sengupta.IME Dept.,IIT Kanpur,INDIA 46 MBA663:TQM<br>
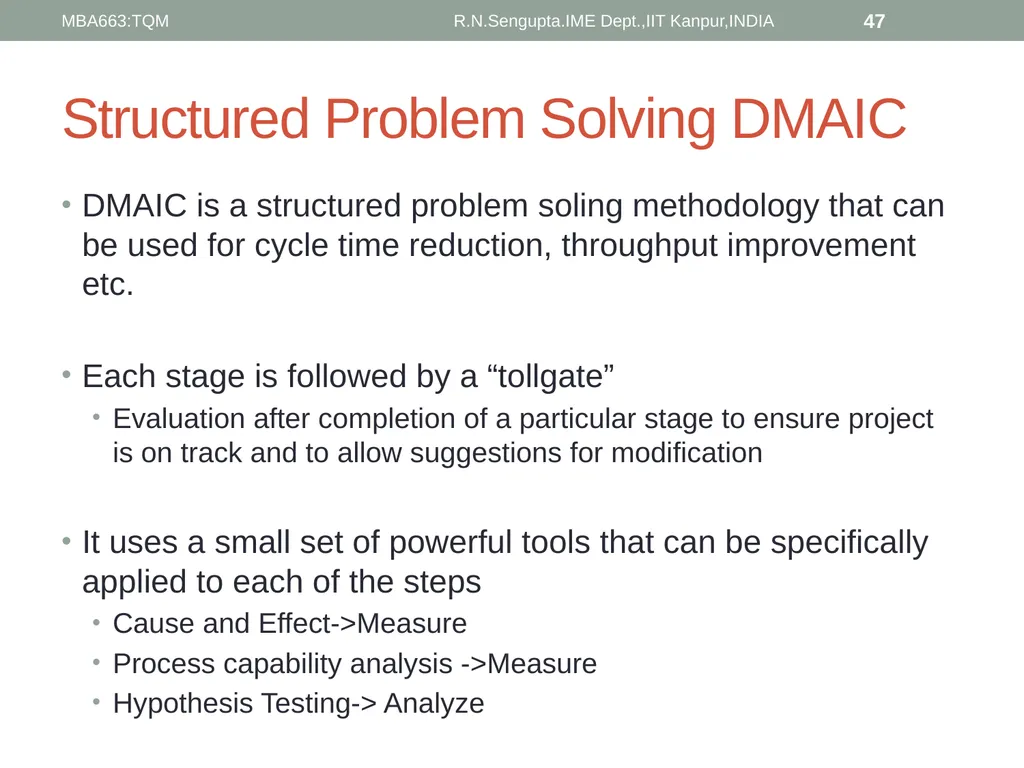
slide47. Structured Problem Solving DMAIC DMAIC is a structured problem soling methodology that can be used for cycle time reduction, throughput improvement etc.
Each stage is followed by a “tollgate”
Evaluation after completion of a particular stage to ensure project is on track and to allow suggestions for modification
It uses a small set of powerful tools that can be specifically applied to each of the steps
Cause and Effect->Measure
Process capability analysis ->Measure
Hypothesis Testing-> Analyze R.N.Sengupta.IME Dept.,IIT Kanpur,INDIA 47 MBA663:TQM<br>
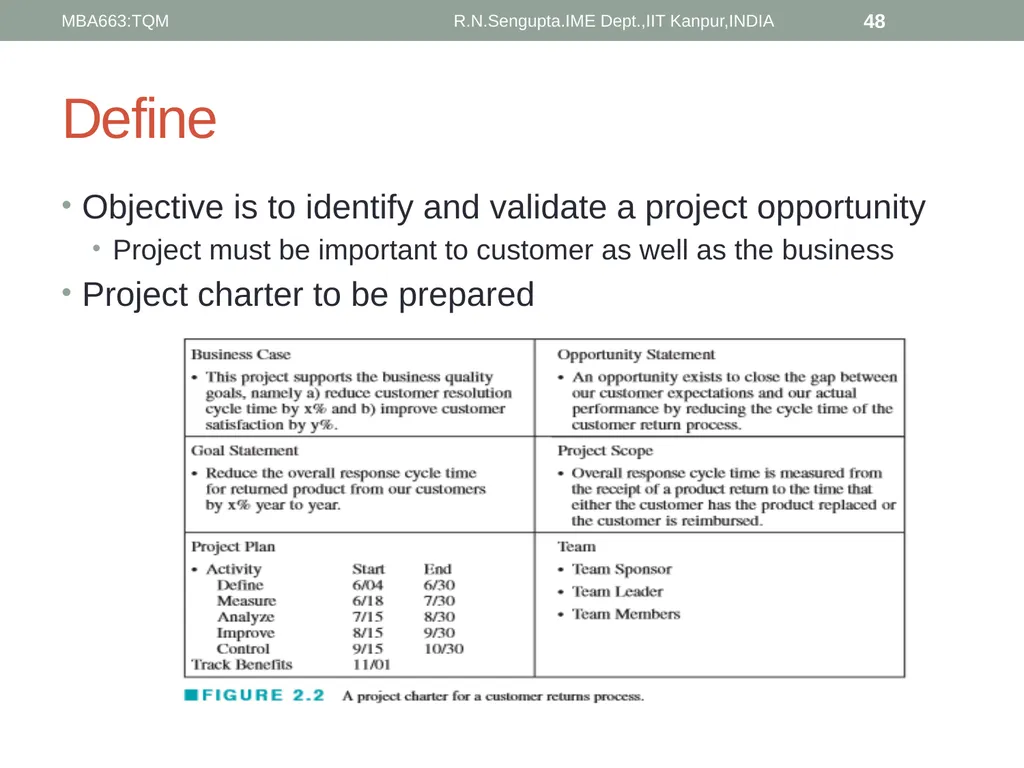
slide48. Define Objective is to identify and validate a project opportunity
Project must be important to customer as well as the business
Project charter to be prepared R.N.Sengupta.IME Dept.,IIT Kanpur,INDIA 48 MBA663:TQM<br>
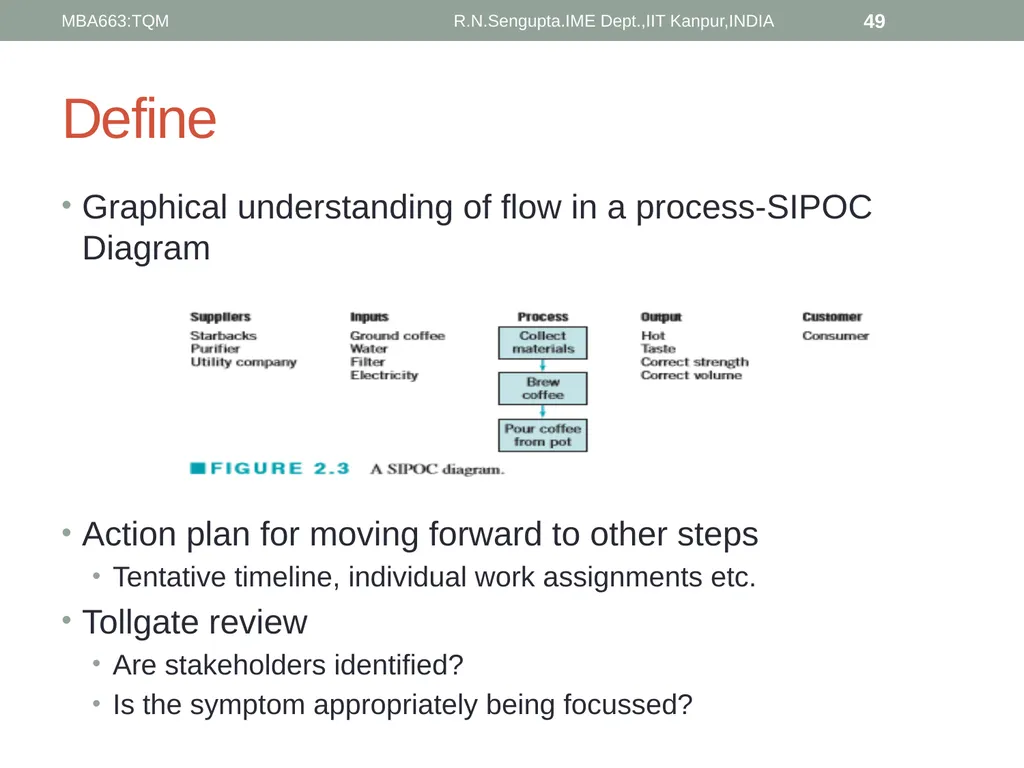
slide49. Define Graphical understanding of flow in a process-SIPOC Diagram
Action plan for moving forward to other steps
Tentative timeline, individual work assignments etc.
Tollgate review
Are stakeholders identified?
Is the symptom appropriately being focussed? R.N.Sengupta.IME Dept.,IIT Kanpur,INDIA 49 MBA663:TQM<br>
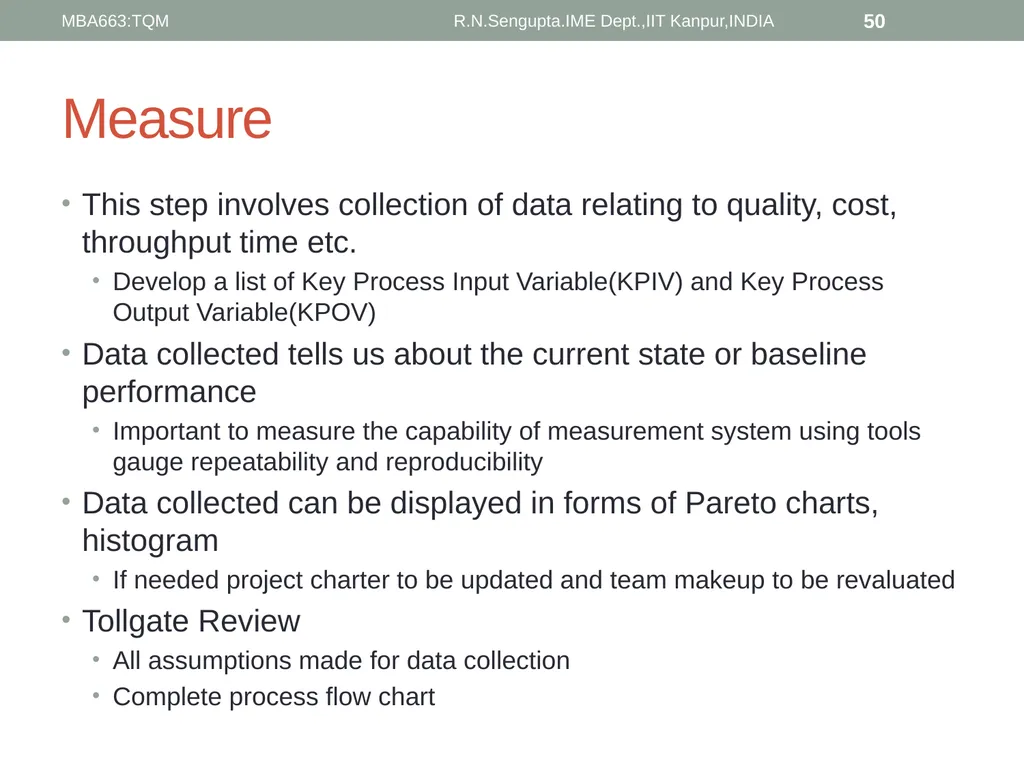
slide50. Measure This step involves collection of data relating to quality, cost, throughput time etc.
Develop a list of Key Process Input Variable(KPIV) and Key Process Output Variable(KPOV)
Data collected tells us about the current state or baseline performance
Important to measure the capability of measurement system using tools gauge repeatability and reproducibility
Data collected can be displayed in forms of Pareto charts, histogram
If needed project charter to be updated and team makeup to be revaluated
Tollgate Review
All assumptions made for data collection
Complete process flow chart R.N.Sengupta.IME Dept.,IIT Kanpur,INDIA 50 MBA663:TQM<br>
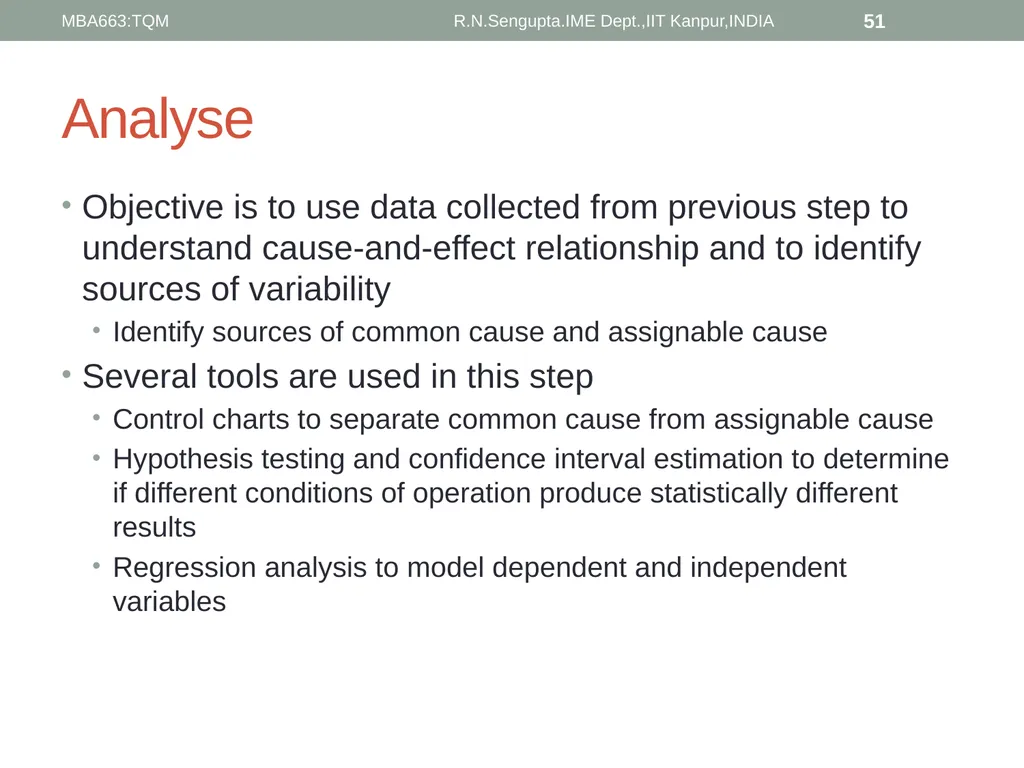
slide51. Analyse Objective is to use data collected from previous step to understand cause-and-effect relationship and to identify sources of variability
Identify sources of common cause and assignable cause
Several tools are used in this step
Control charts to separate common cause from assignable cause
Hypothesis testing and confidence interval estimation to determine if different conditions of operation produce statistically different results
Regression analysis to model dependent and independent variables R.N.Sengupta.IME Dept.,IIT Kanpur,INDIA 51 MBA663:TQM<br>
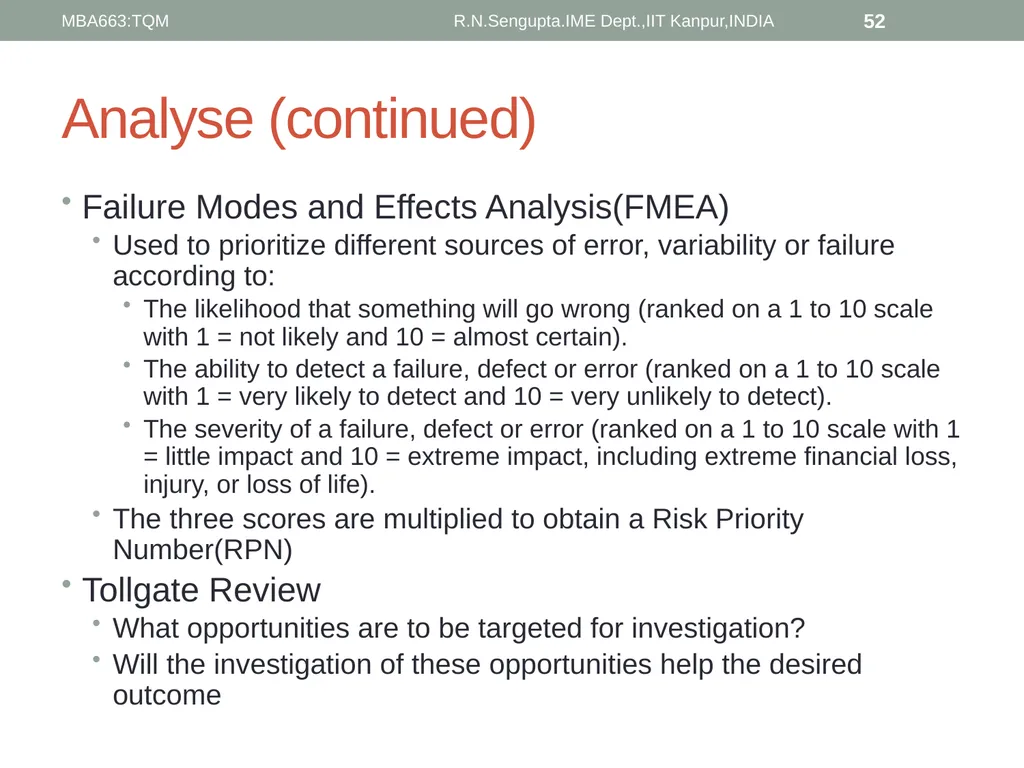
slide52. Analyse (continued) Failure Modes and Effects Analysis(FMEA)
Used to prioritize different sources of error, variability or failure according to:
The likelihood that something will go wrong (ranked on a 1 to 10 scale with 1 = not likely and 10 = almost certain).
The ability to detect a failure, defect or error (ranked on a 1 to 10 scale with 1 = very likely to detect and 10 = very unlikely to detect).
The severity of a failure, defect or error (ranked on a 1 to 10 scale with 1 = little impact and 10 = extreme impact, including extreme financial loss, injury, or loss of life).
The three scores are multiplied to obtain a Risk Priority Number(RPN)
Tollgate Review
What opportunities are to be targeted for investigation?
Will the investigation of these opportunities help the desired outcome R.N.Sengupta.IME Dept.,IIT Kanpur,INDIA 52 MBA663:TQM<br>
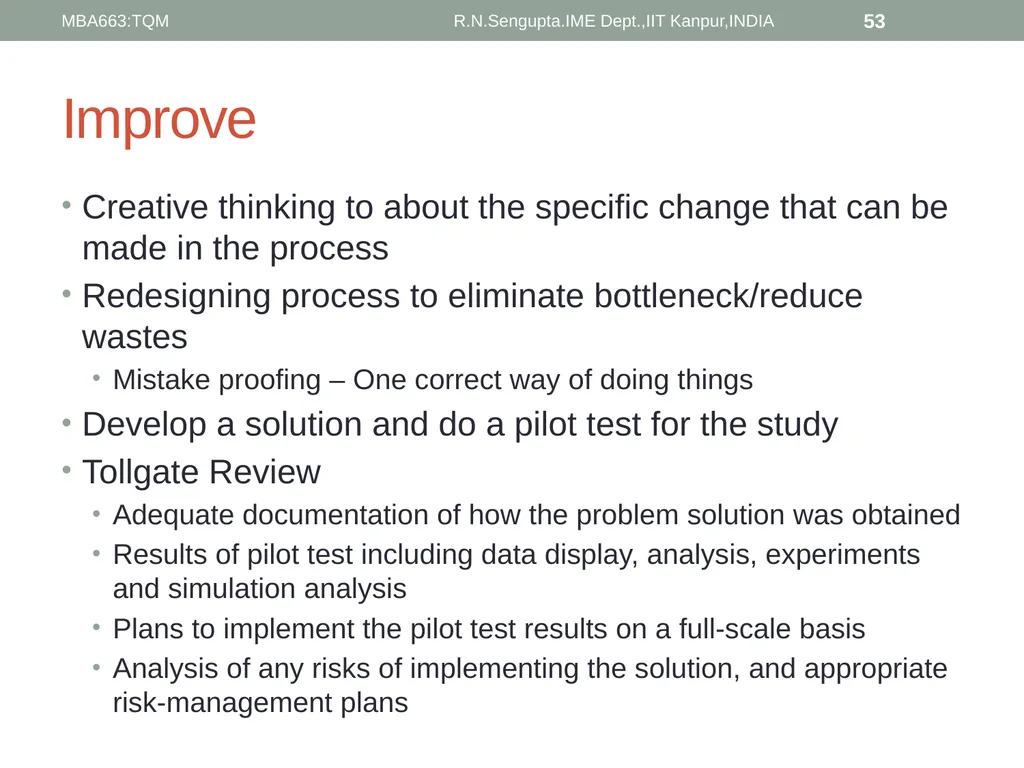
slide53. Improve Creative thinking to about the specific change that can be made in the process
Redesigning process to eliminate bottleneck/reduce wastes
Mistake proofing – One correct way of doing things
Develop a solution and do a pilot test for the study
Tollgate Review
Adequate documentation of how the problem solution was obtained
Results of pilot test including data display, analysis, experiments and simulation analysis
Plans to implement the pilot test results on a full-scale basis
Analysis of any risks of implementing the solution, and appropriate risk-management plans R.N.Sengupta.IME Dept.,IIT Kanpur,INDIA 53 MBA663:TQM<br>
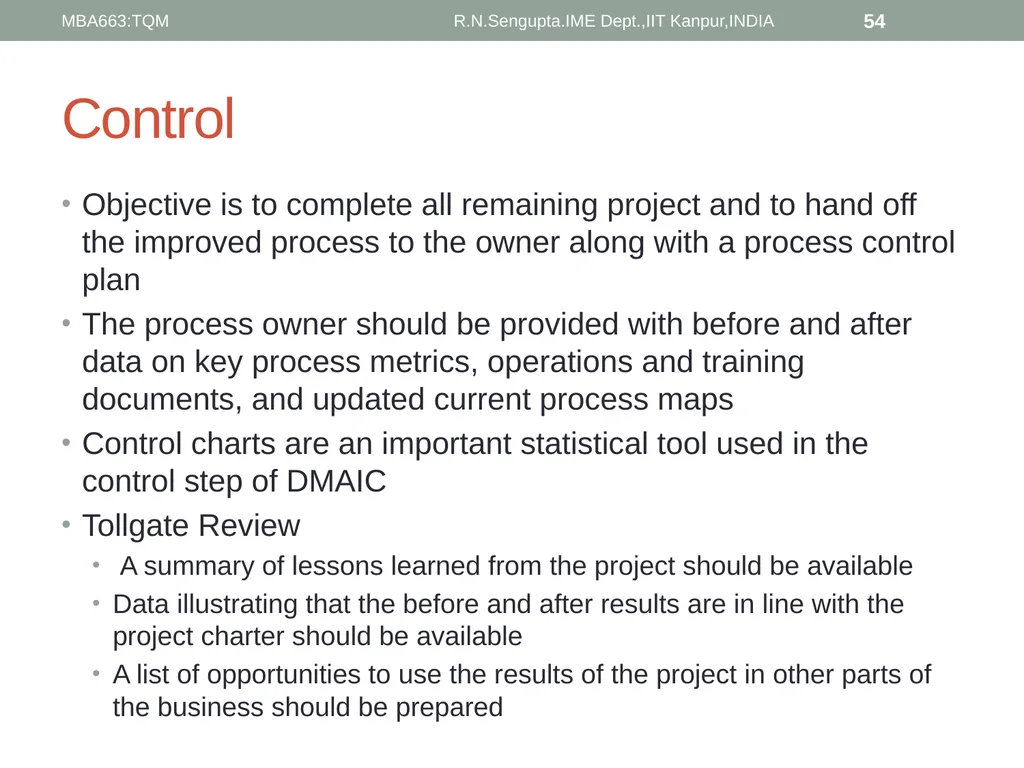
slide54. Control Objective is to complete all remaining project and to hand off the improved process to the owner along with a process control plan
The process owner should be provided with before and after data on key process metrics, operations and training documents, and updated current process maps
Control charts are an important statistical tool used in the control step of DMAIC
Tollgate Review
A summary of lessons learned from the project should be available
Data illustrating that the before and after results are in line with the project charter should be available
A list of opportunities to use the results of the project in other parts of the business should be prepared R.N.Sengupta.IME Dept.,IIT Kanpur,INDIA 54 MBA663:TQM<br>
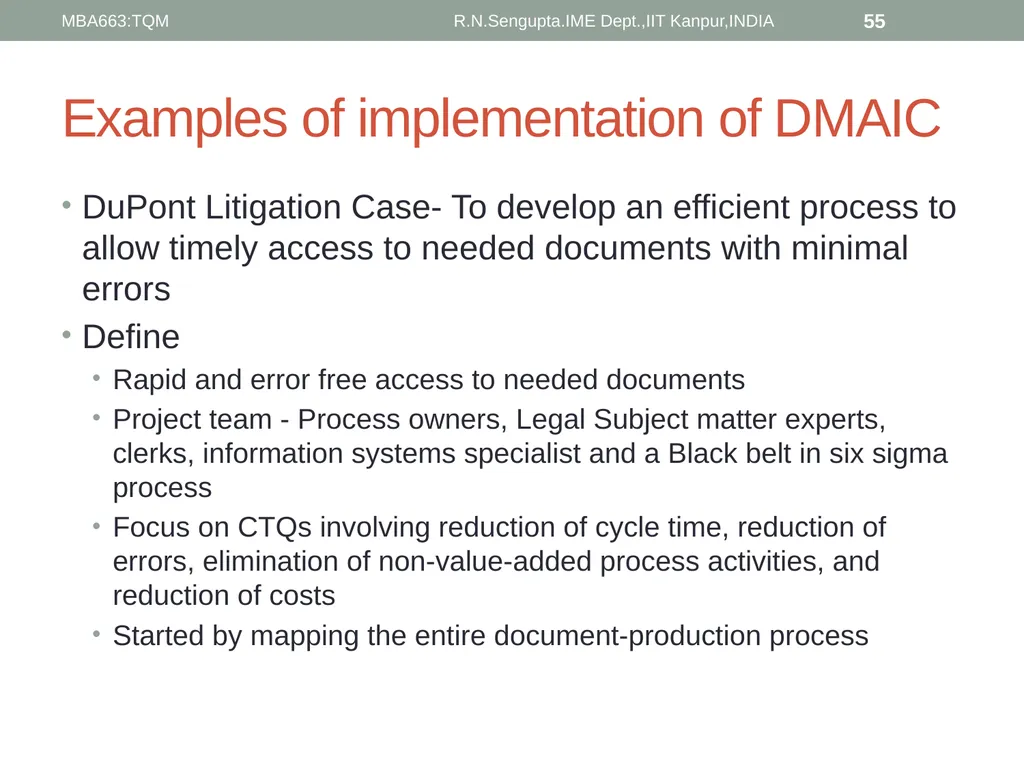
slide55. Examples of implementation of DMAIC DuPont Litigation Case- To develop an efficient process to allow timely access to needed documents with minimal errors
Define
Rapid and error free access to needed documents
Project team - Process owners, Legal Subject matter experts, clerks, information systems specialist and a Black belt in six sigma process
Focus on CTQs involving reduction of cycle time, reduction of errors, elimination of non-value-added process activities, and reduction of costs
Started by mapping the entire document-production process R.N.Sengupta.IME Dept.,IIT Kanpur,INDIA 55 MBA663:TQM<br>
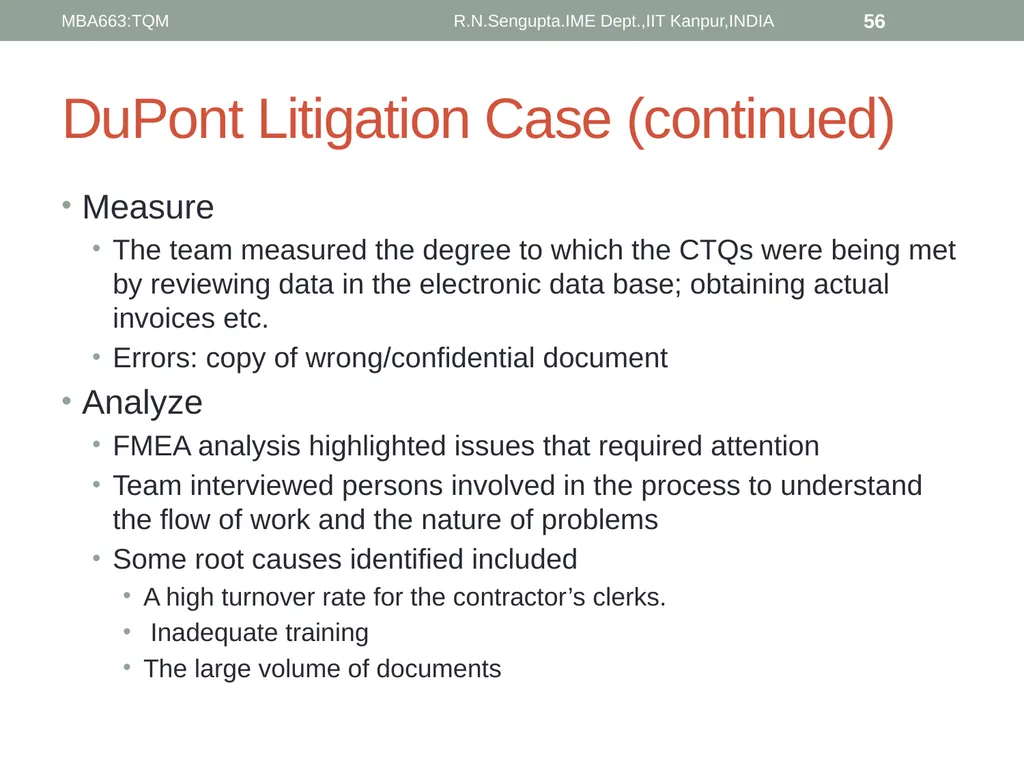
slide56. DuPont Litigation Case (continued) Measure
The team measured the degree to which the CTQs were being met by reviewing data in the electronic data base; obtaining actual invoices etc.
Errors: copy of wrong/confidential document
Analyze
FMEA analysis highlighted issues that required attention
Team interviewed persons involved in the process to understand the flow of work and the nature of problems
Some root causes identified included
A high turnover rate for the contractor’s clerks.
Inadequate training
The large volume of documents R.N.Sengupta.IME Dept.,IIT Kanpur,INDIA 56 MBA663:TQM<br>
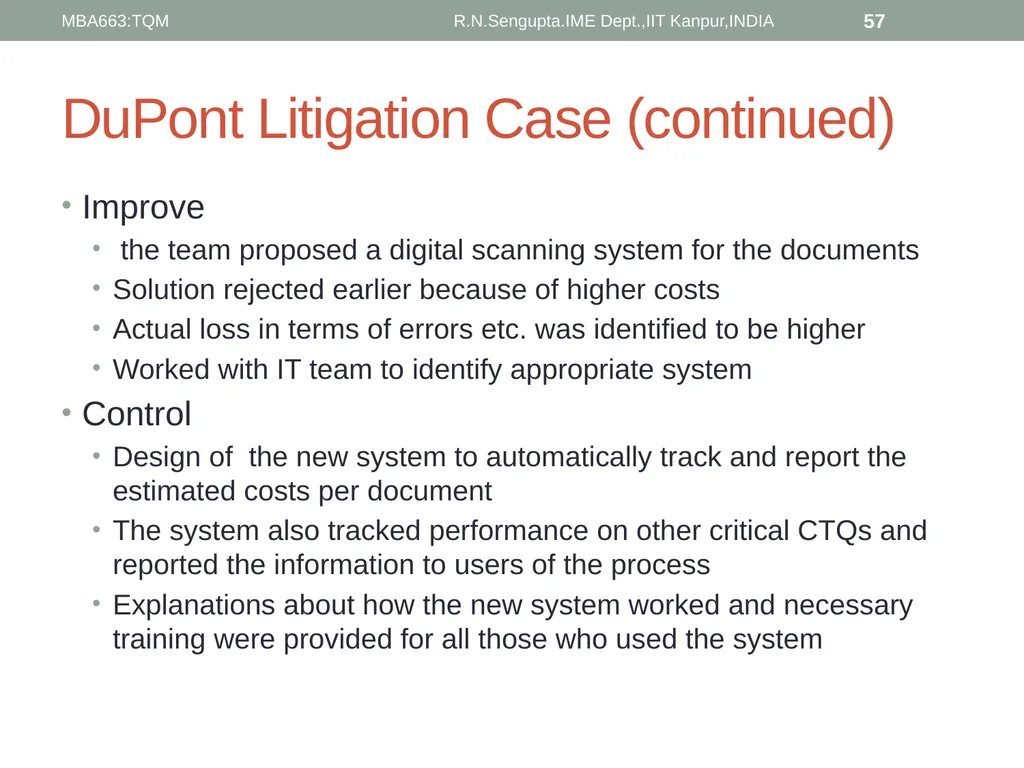
slide57. DuPont Litigation Case (continued) Improve
the team proposed a digital scanning system for the documents
Solution rejected earlier because of higher costs
Actual loss in terms of errors etc. was identified to be higher
Worked with IT team to identify appropriate system
Control
Design of the new system to automatically track and report the estimated costs per document
The system also tracked performance on other critical CTQs and reported the information to users of the process
Explanations about how the new system worked and necessary training were provided for all those who used the system R.N.Sengupta.IME Dept.,IIT Kanpur,INDIA 57 MBA663:TQM<br>
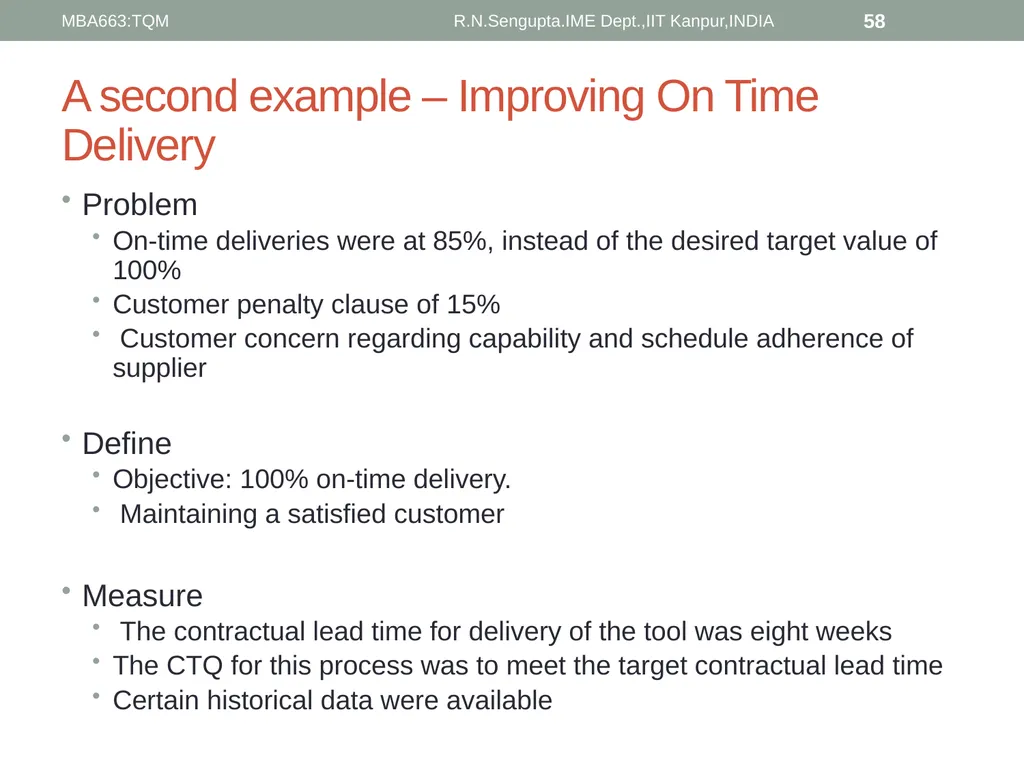
slide58. A second example – Improving On Time Delivery Problem
On-time deliveries were at 85%, instead of the desired target value of 100%
Customer penalty clause of 15%
Customer concern regarding capability and schedule adherence of supplier
Define
Objective: 100% on-time delivery.
Maintaining a satisfied customer
Measure
The contractual lead time for delivery of the tool was eight weeks
The CTQ for this process was to meet the target contractual lead time
Certain historical data were available R.N.Sengupta.IME Dept.,IIT Kanpur,INDIA 58 MBA663:TQM<br>
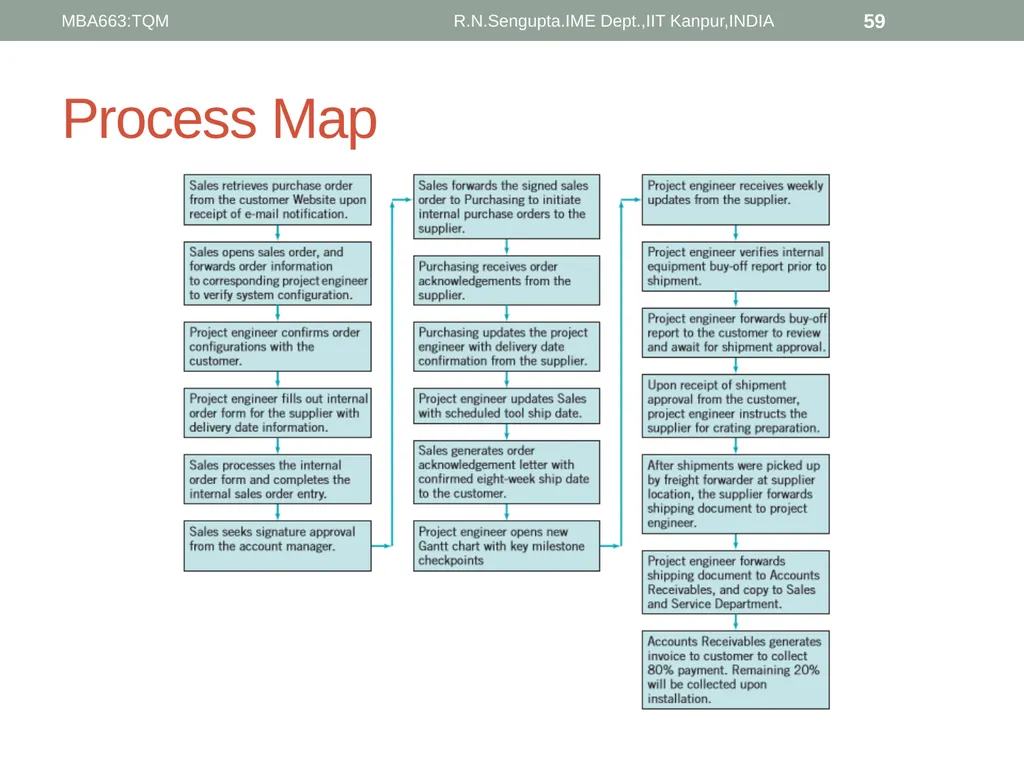
slide59. Process Map R.N.Sengupta.IME Dept.,IIT Kanpur,INDIA 59 MBA663:TQM<br>
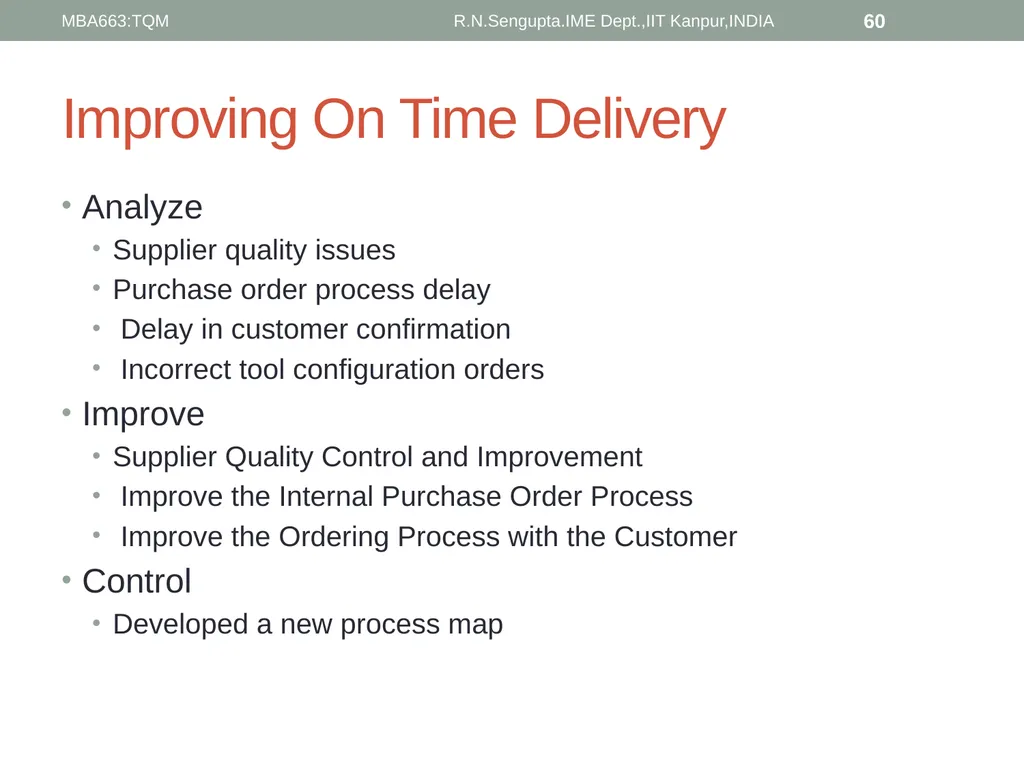
slide60. Improving On Time Delivery Analyze
Supplier quality issues
Purchase order process delay
Delay in customer confirmation
Incorrect tool configuration orders
Improve
Supplier Quality Control and Improvement
Improve the Internal Purchase Order Process
Improve the Ordering Process with the Customer
Control
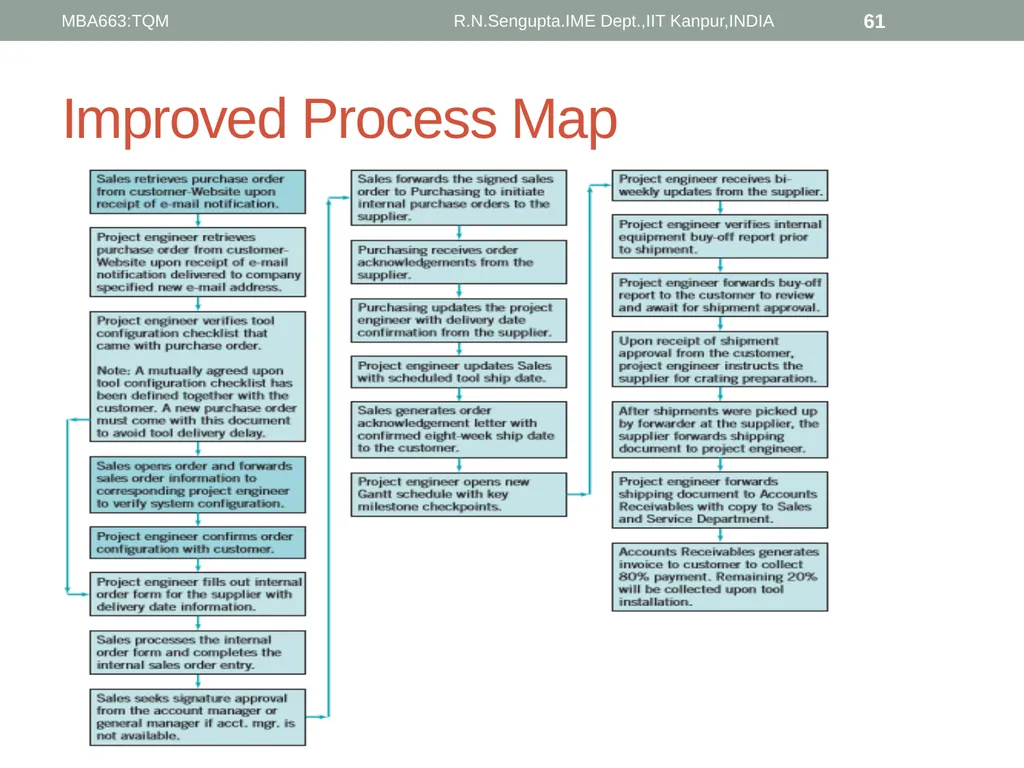
Developed a new process map R.N.Sengupta.IME Dept.,IIT Kanpur,INDIA 60 MBA663:TQM<br>
slide61. Improved Process Map R.N.Sengupta.IME Dept.,IIT Kanpur,INDIA 61 MBA663:TQM<br>
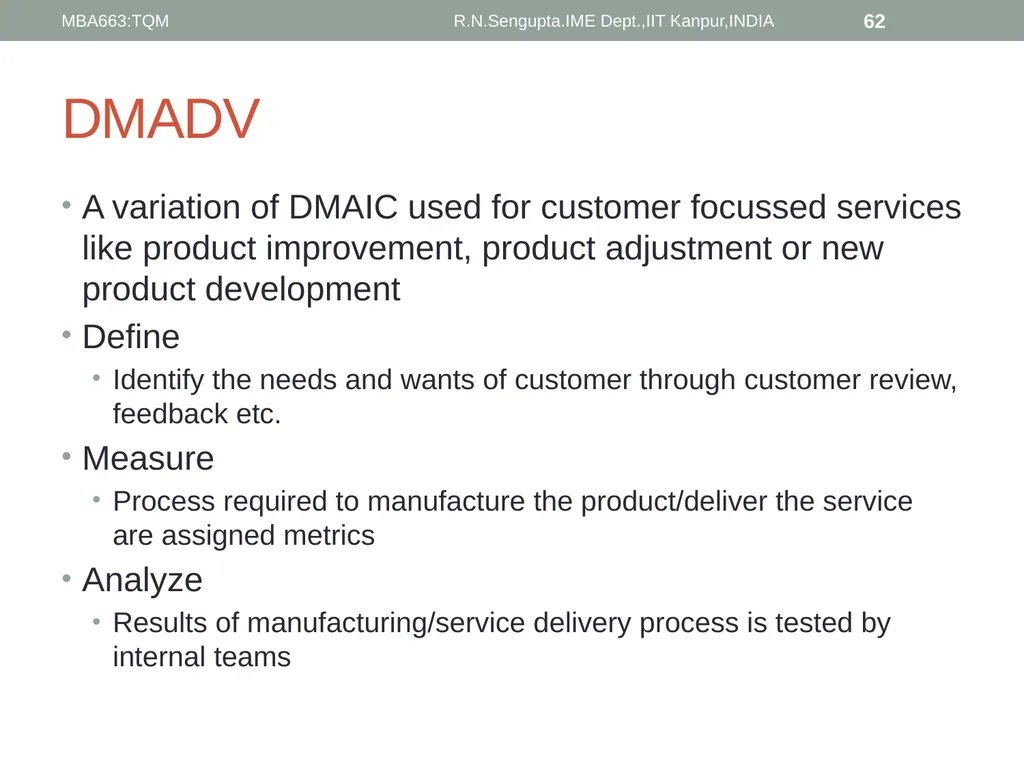
slide62. DMADV A variation of DMAIC used for customer focussed services like product improvement, product adjustment or new product development
Define
Identify the needs and wants of customer through customer review, feedback etc.
Measure
Process required to manufacture the product/deliver the service are assigned metrics
Analyze
Results of manufacturing/service delivery process is tested by internal teams R.N.Sengupta.IME Dept.,IIT Kanpur,INDIA 62 MBA663:TQM<br>
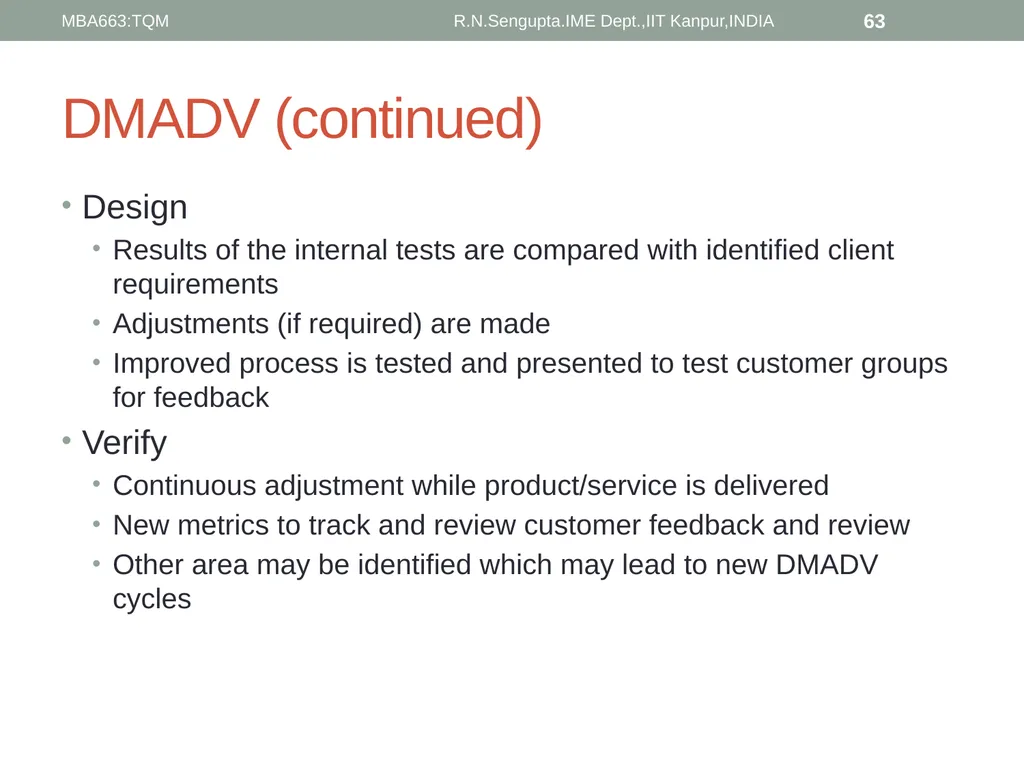
slide63. DMADV (continued) Design
Results of the internal tests are compared with identified client requirements
Adjustments (if required) are made
Improved process is tested and presented to test customer groups for feedback
Verify
Continuous adjustment while product/service is delivered
New metrics to track and review customer feedback and review
Other area may be identified which may lead to new DMADV cycles R.N.Sengupta.IME Dept.,IIT Kanpur,INDIA 63 MBA663:TQM<br>
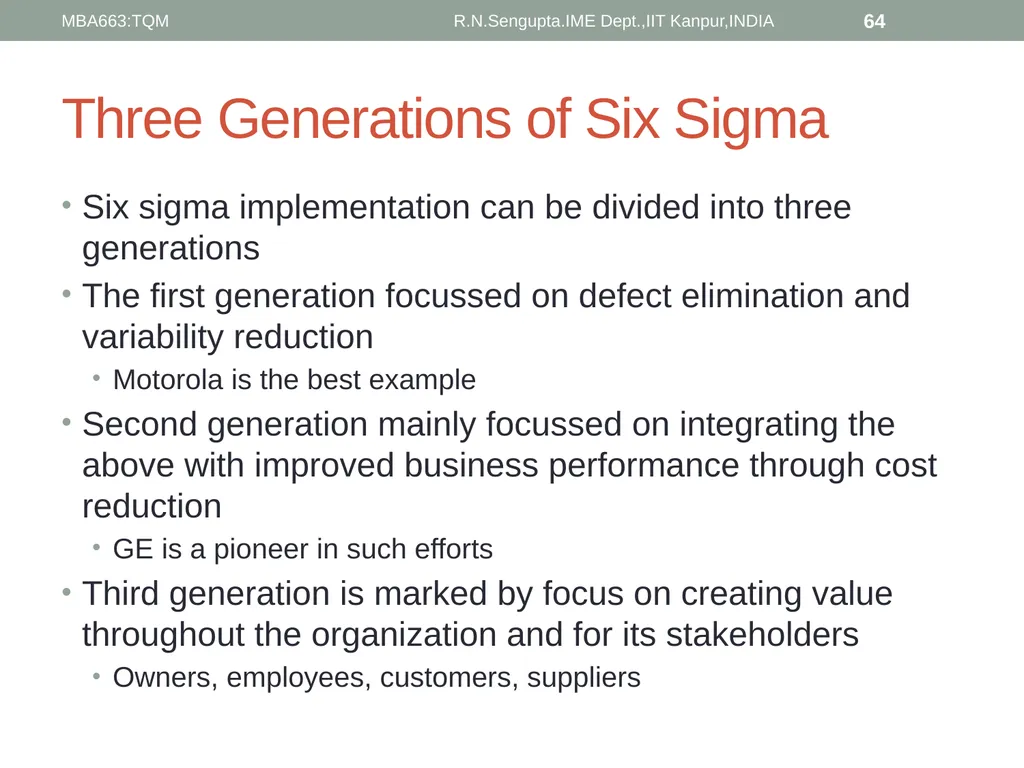
slide64. Three Generations of Six Sigma Six sigma implementation can be divided into three generations
The first generation focussed on defect elimination and variability reduction
Motorola is the best example
Second generation mainly focussed on integrating the above with improved business performance through cost reduction
GE is a pioneer in such efforts
Third generation is marked by focus on creating value throughout the organization and for its stakeholders
Owners, employees, customers, suppliers R.N.Sengupta.IME Dept.,IIT Kanpur,INDIA 64 MBA663:TQM<br>
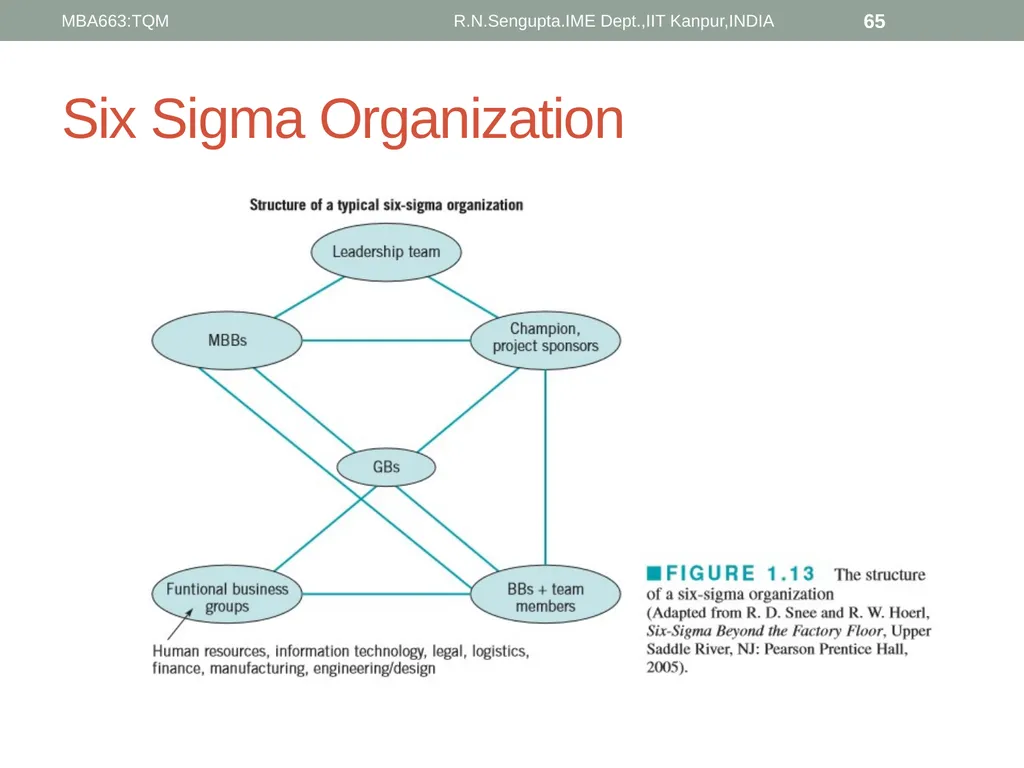
slide65. Six Sigma Organization R.N.Sengupta.IME Dept.,IIT Kanpur,INDIA 65 MBA663:TQM<br>
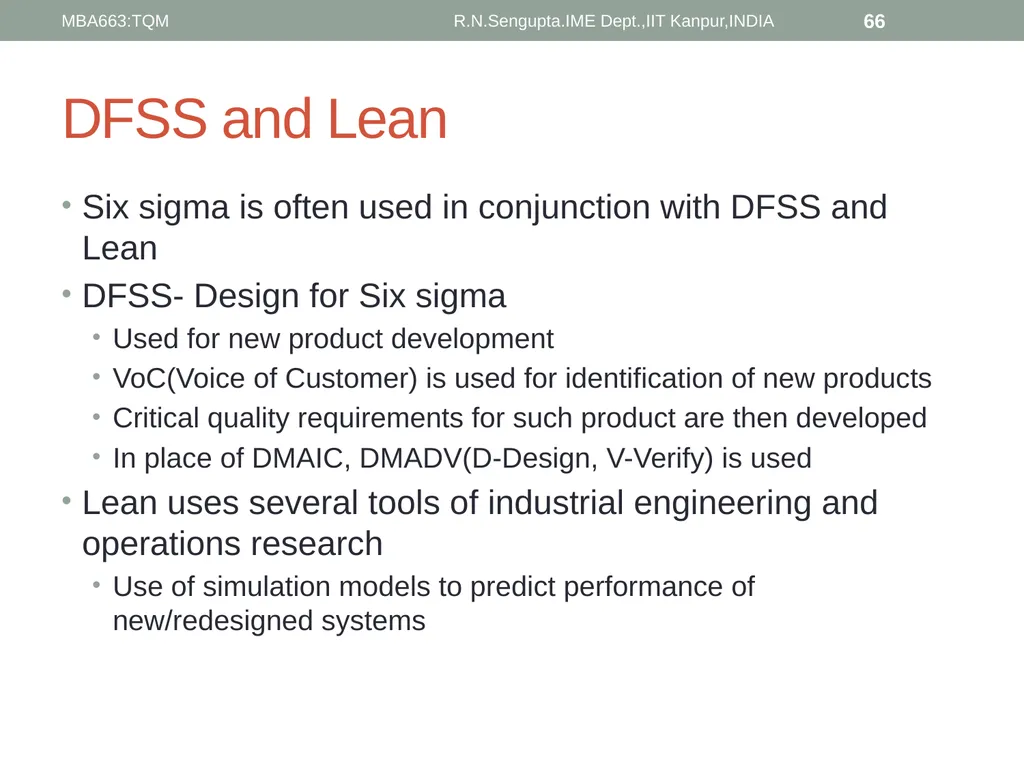
slide66. DFSS and Lean Six sigma is often used in conjunction with DFSS and Lean
DFSS- Design for Six sigma
Used for new product development
VoC(Voice of Customer) is used for identification of new products
Critical quality requirements for such product are then developed
In place of DMAIC, DMADV(D-Design, V-Verify) is used
Lean uses several tools of industrial engineering and operations research
Use of simulation models to predict performance of new/redesigned systems R.N.Sengupta.IME Dept.,IIT Kanpur,INDIA 66 MBA663:TQM<br>
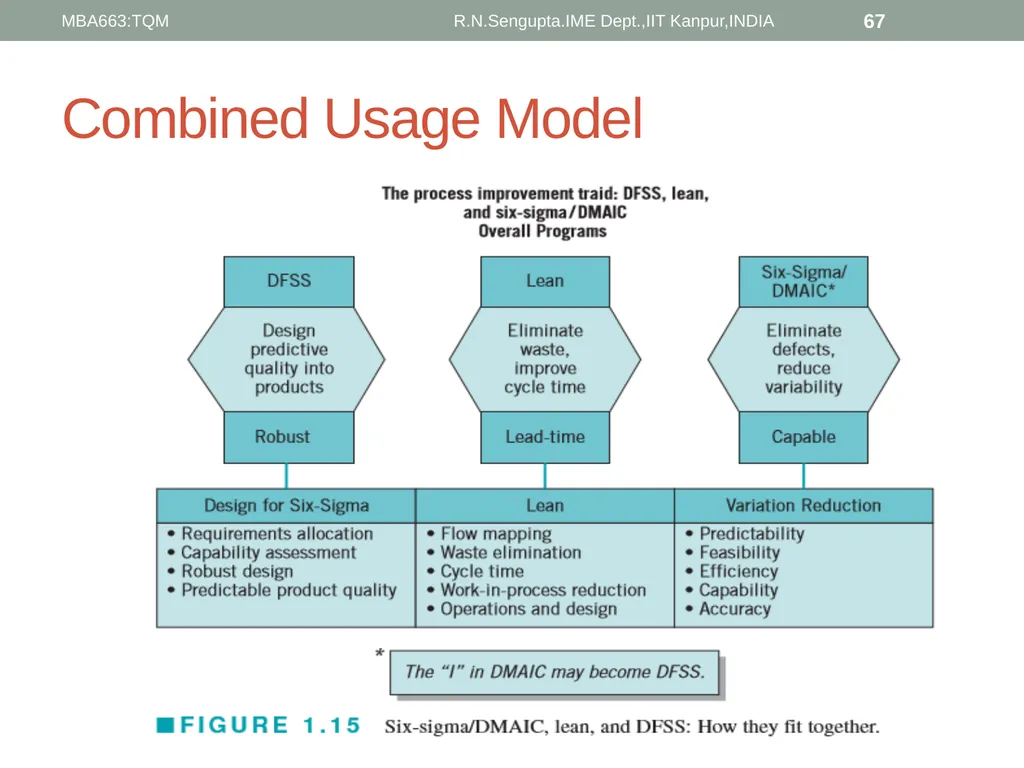
slide67. Combined Usage Model R.N.Sengupta.IME Dept.,IIT Kanpur,INDIA 67 MBA663:TQM<br>
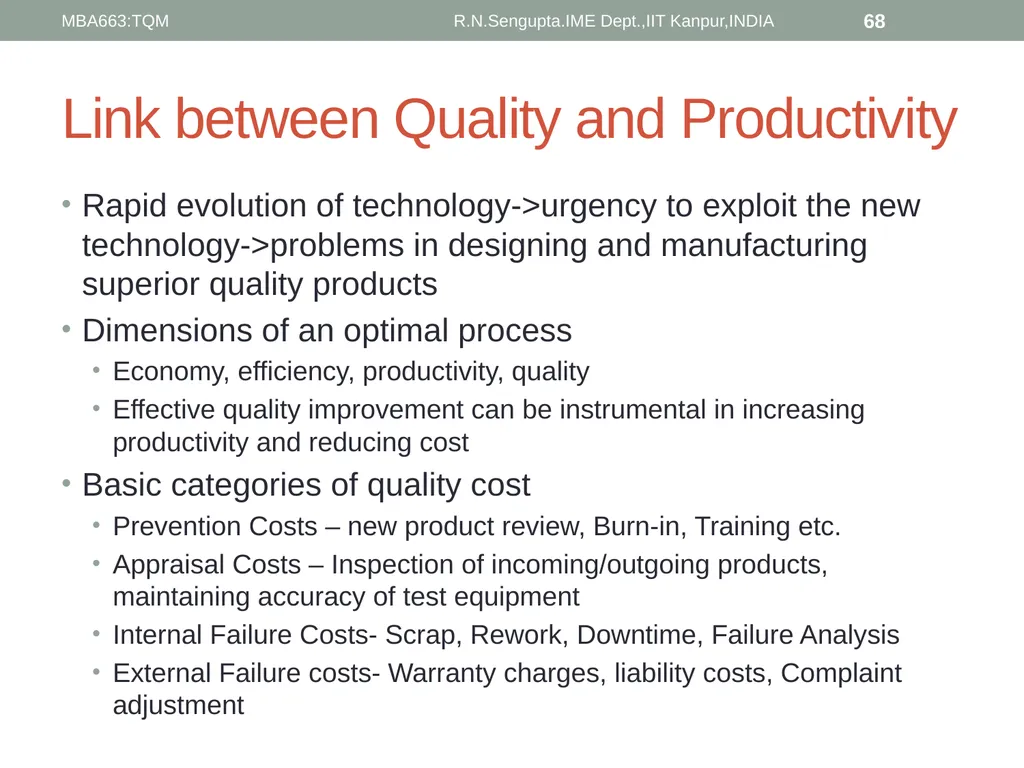
slide68. Link between Quality and Productivity Rapid evolution of technology->urgency to exploit the new technology->problems in designing and manufacturing superior quality products
Dimensions of an optimal process
Economy, efficiency, productivity, quality
Effective quality improvement can be instrumental in increasing productivity and reducing cost
Basic categories of quality cost
Prevention Costs – new product review, Burn-in, Training etc.
Appraisal Costs – Inspection of incoming/outgoing products, maintaining accuracy of test equipment
Internal Failure Costs- Scrap, Rework, Downtime, Failure Analysis
External Failure costs- Warranty charges, liability costs, Complaint adjustment R.N.Sengupta.IME Dept.,IIT Kanpur,INDIA 68 MBA663:TQM<br>
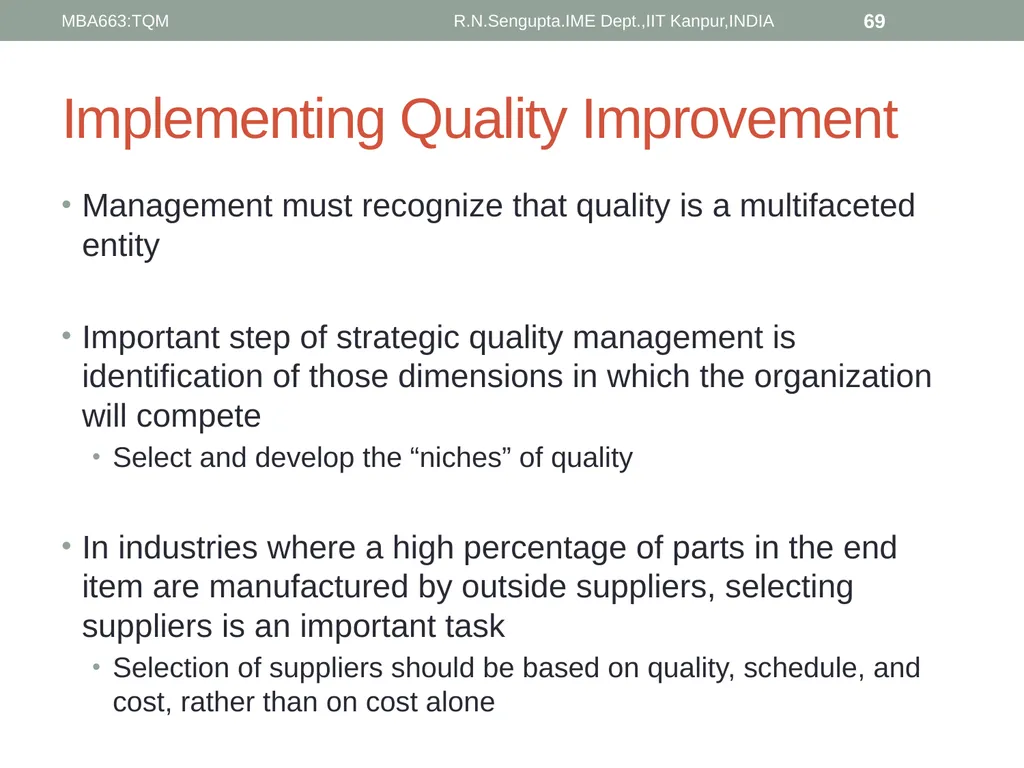
slide69. Implementing Quality Improvement Management must recognize that quality is a multifaceted entity
Important step of strategic quality management is identification of those dimensions in which the organization will compete
Select and develop the “niches” of quality
In industries where a high percentage of parts in the end item are manufactured by outside suppliers, selecting suppliers is an important task
Selection of suppliers should be based on quality, schedule, and cost, rather than on cost alone R.N.Sengupta.IME Dept.,IIT Kanpur,INDIA 69 MBA663:TQM<br>
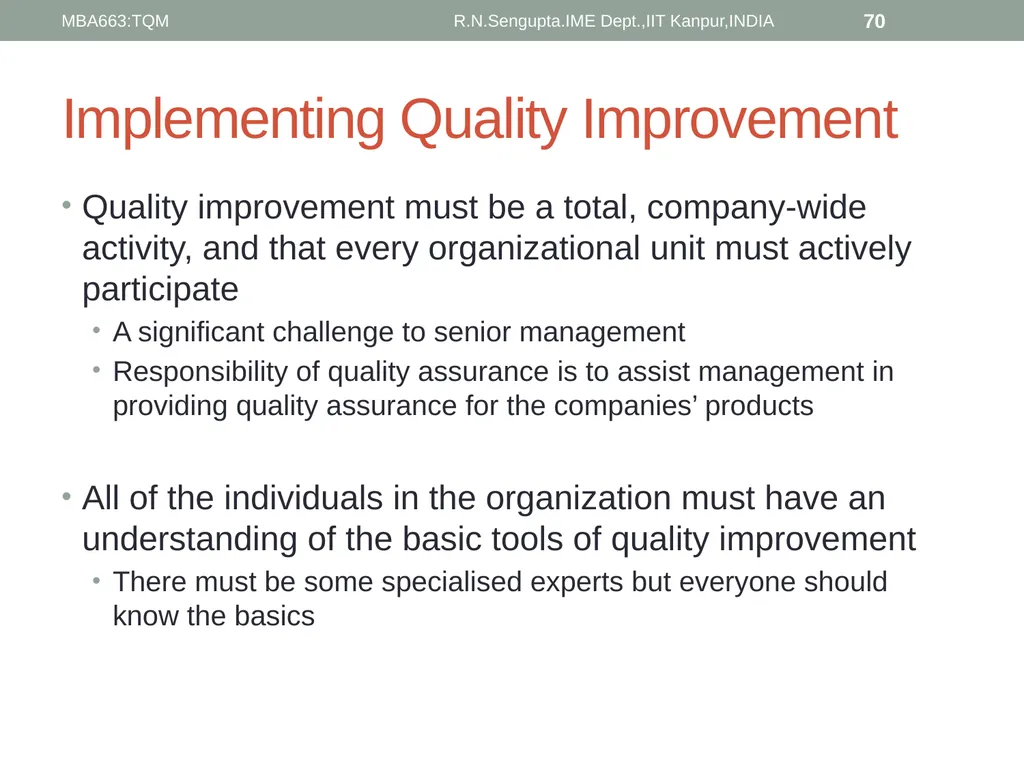
slide70. Implementing Quality Improvement Quality improvement must be a total, company-wide activity, and that every organizational unit must actively participate
A significant challenge to senior management
Responsibility of quality assurance is to assist management in providing quality assurance for the companies’ products
All of the individuals in the organization must have an understanding of the basic tools of quality improvement
There must be some specialised experts but everyone should know the basics R.N.Sengupta.IME Dept.,IIT Kanpur,INDIA 70 MBA663:TQM<br>
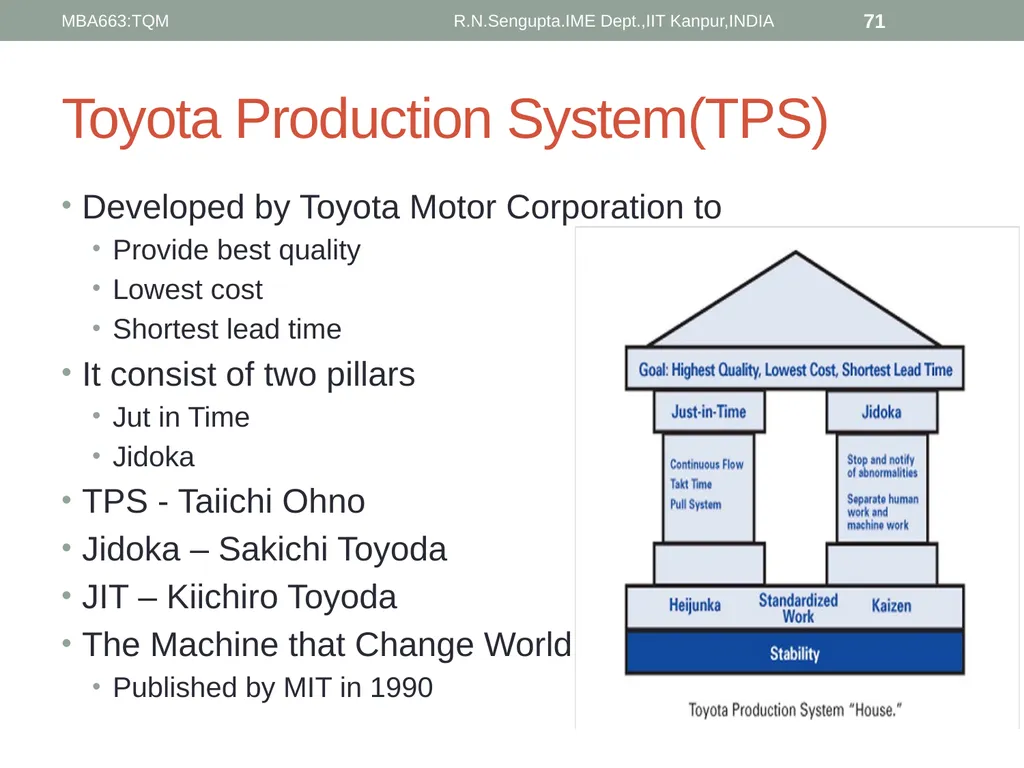
slide71. Toyota Production System(TPS) Developed by Toyota Motor Corporation to
Provide best quality
Lowest cost
Shortest lead time
It consist of two pillars
Jut in Time
Jidoka
TPS - Taiichi Ohno
Jidoka – Sakichi Toyoda
JIT – Kiichiro Toyoda
The Machine that Change World
Published by MIT in 1990 R.N.Sengupta.IME Dept.,IIT Kanpur,INDIA 71 MBA663:TQM<br>
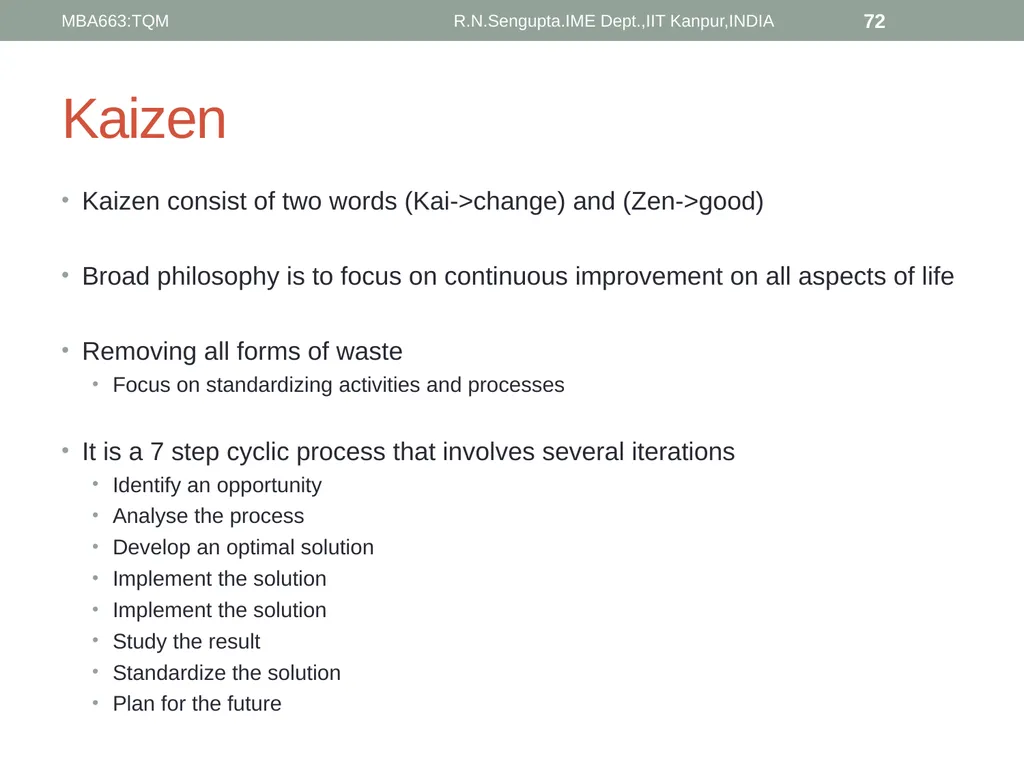
slide72. Kaizen Kaizen consist of two words (Kai->change) and (Zen->good)
Broad philosophy is to focus on continuous improvement on all aspects of life
Removing all forms of waste
Focus on standardizing activities and processes
It is a 7 step cyclic process that involves several iterations
Identify an opportunity
Analyse the process
Develop an optimal solution
Implement the solution
Implement the solution
Study the result
Standardize the solution
Plan for the future R.N.Sengupta.IME Dept.,IIT Kanpur,INDIA 72 MBA663:TQM<br>
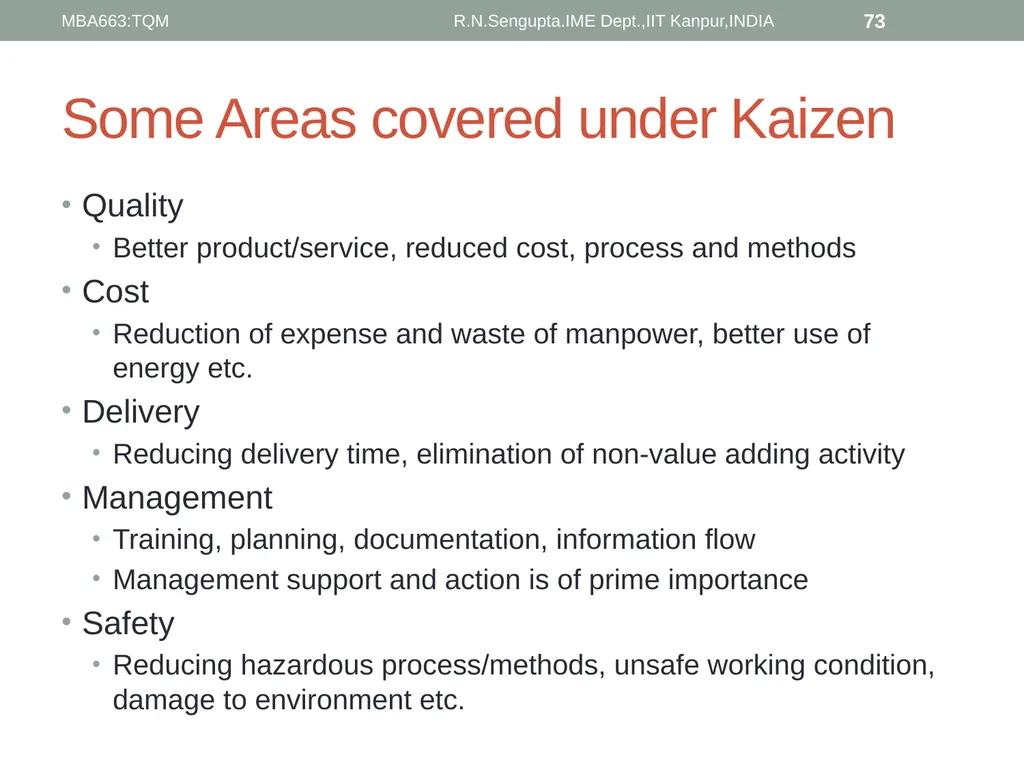
slide73. Some Areas covered under Kaizen Quality
Better product/service, reduced cost, process and methods
Cost
Reduction of expense and waste of manpower, better use of energy etc.
Delivery
Reducing delivery time, elimination of non-value adding activity
Management
Training, planning, documentation, information flow
Management support and action is of prime importance
Safety
Reducing hazardous process/methods, unsafe working condition, damage to environment etc. R.N.Sengupta.IME Dept.,IIT Kanpur,INDIA 73 MBA663:TQM<br>
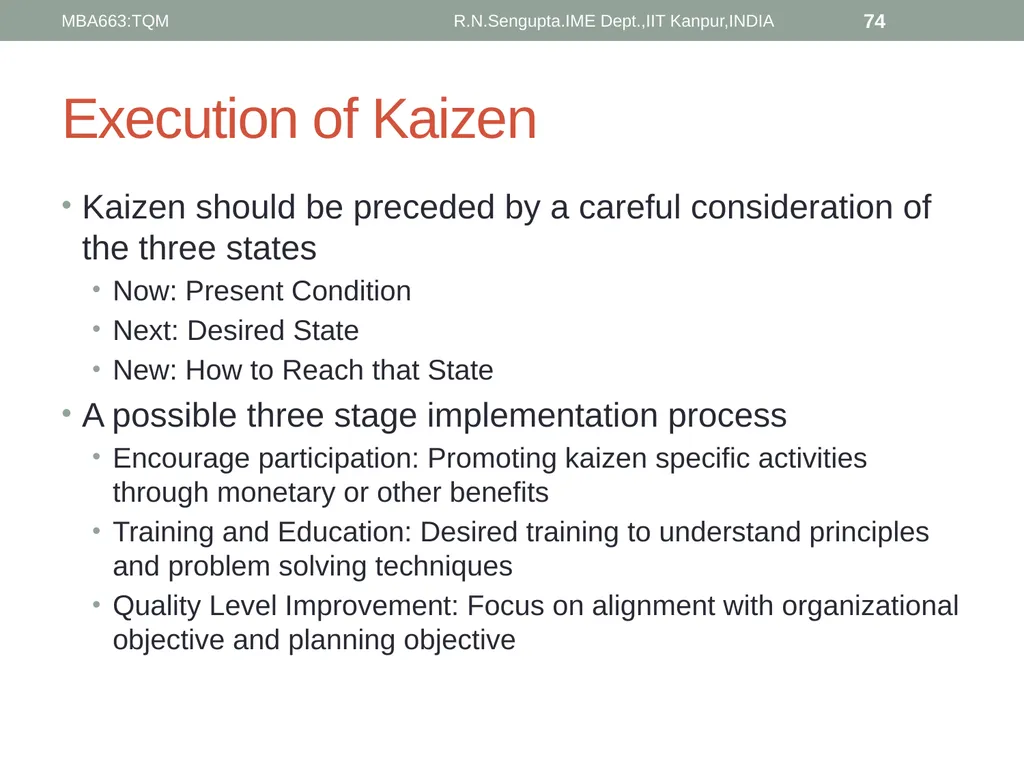
slide74. Execution of Kaizen Kaizen should be preceded by a careful consideration of the three states
Now: Present Condition
Next: Desired State
New: How to Reach that State
A possible three stage implementation process
Encourage participation: Promoting kaizen specific activities through monetary or other benefits
Training and Education: Desired training to understand principles and problem solving techniques
Quality Level Improvement: Focus on alignment with organizational objective and planning objective R.N.Sengupta.IME Dept.,IIT Kanpur,INDIA 74 MBA663:TQM<br>
slide75. References http://www.sae.org/manufacturing/lean/column/leanjun01.htm
https://en.wikipedia.org/wiki/W._Edwards_Deming
Picture of Deming
https://en.wikipedia.org/wiki/Joseph_M._Juran
Picture of Juran
http://mitsloan.mit.edu/alumnimagazine/ss09-alumni-news.php
Picture of Feigenbaum
https://www.isixsigma.com/methodology/kaizen/kaizen-six-sigma-ensures-continuous-improvement/
http://businesscasestudies.co.uk/leyland-trucks/continuous-improvement-within-an-organisation/continuous-improvement-or-kaizen.html#axzz4Un8Si4k9
Kaizen case study example R.N.Sengupta.IME Dept.,IIT Kanpur,INDIA 75 MBA663:TQM<br>
slide76. References https://www.villanovau.com/resources/six-sigma/six-sigma-methodology-dmadv/#.WGz54IVOLIU R.N.Sengupta.IME Dept.,IIT Kanpur,INDIA 76 MBA663:TQM<br>
Professor
Department of Industrial and Management Engineering
All figures are taken from(unless otherwise mentioned):
Introduction to Statistical process Control
Douglas. C Montgomery
6th Edition<br>
slide2. Quality One of the most important decision factor in selection of products/services from competing sets
Understanding and improving quality leads to business success, growth and competitiveness
Can be defined as possession of one or more desirable characteristics for a product/service
ISO 9000 Definition – a degree to which a set of inherent characteristics that fulfils a need or expectation that is stated ,generally implied or is obligatory R.N.Sengupta.IME Dept.,IIT Kanpur,INDIA 2 MBA663:TQM<br>
slide3. Dimensions of Quality Performance – Will the product do the intended job
Reliability – How often does the product fail
Durability – How long does the product last
Serviceability – How easy it is to repair the product R.N.Sengupta.IME Dept.,IIT Kanpur,INDIA 3 MBA663:TQM<br>
slide4. Dimensions of Quality Aesthetics – What does the product look like
Features – what does the product do
Perceived Quality – What is the reputation of the company or its products
Conformance to Standards – Is the product made exactly as the designer intended R.N.Sengupta.IME Dept.,IIT Kanpur,INDIA 4 MBA663:TQM<br>
slide5. Definition of Quality Fitness for use
Consists of two aspects
Quality of design – All automobiles have the same basic objective of providing transportation yet they are different in terms of size, shape, performance etc.
Quality of Conformance – How well the product conforms to the specification required by the design. Depends on choice of manufacturing process, training and supervision of workforce, types of process control, inspection activities etc. R.N.Sengupta.IME Dept.,IIT Kanpur,INDIA 5 MBA663:TQM<br>
slide6. Definition of Quality (continued) Above definition does not emphasize the focus on customer
“Quality is inversely proportional to variability”
If variability of an important characteristics of a product decreases, the quality of the product increases
Variability here refers to unwanted variability
Focusses on customer requirement of less variability R.N.Sengupta.IME Dept.,IIT Kanpur,INDIA 6 MBA663:TQM<br>
slide7. Meaning of Quality: A Final Perspective Consumer’s and producer’s perspectives depend on each other
Consumer’s perspective: PRICE
Producer’s perspective: COST
Consumer’s view must dominate 7 R.N.Sengupta.IME Dept.,IIT Kanpur,INDIA MBA663:TQM<br>
slide8. An example An automobile company in US received transmission parts from a domestic plant and from a Japanese Supplier
Analysis of transmission cost for parts produced in US and Japan
Huge difference in costs between the two sources
To identify reasons for difference, the company selected Random Samples from plants, disassembled them and measured Critical to Quality characteristics R.N.Sengupta.IME Dept.,IIT Kanpur,INDIA 8 MBA663:TQM<br>
slide9. Understanding variability The units manufactured in US took up around 75% of the width of the specification while those manufactured in Japan took up around 25%
Considerable less variability in Japanese products
Customer does not see the mean, they look at the variability around the target that is not removed – Jack Welch R.N.Sengupta.IME Dept.,IIT Kanpur,INDIA 9 MBA663:TQM<br>
slide10. Quality improvement Why and how did the Japanese do it?
Why
Reduced variability leads to lower costs (Fig 1.1)
Japanese gears ran more smoothly with less noise and hence had a higher perceived quality in minds of the consumers
Fewer repairs and warranty claims -> less rework -> reduction in wasted time effort money R.N.Sengupta.IME Dept.,IIT Kanpur,INDIA 10 MBA663:TQM<br>
slide11. Quality improvement How
Quality improvement – Reduction of variability in processes and products
Reduction of waste
Specially pertinent to the service industry – improving service process leads to less effort and time in correction R.N.Sengupta.IME Dept.,IIT Kanpur,INDIA 11 MBA663:TQM<br>
slide12. Quality characteristics Quality characteristics – Elements that describe what consumer perceives as quality
Often referred to as Critical-To-Quality Characteristics
Physical – length, weight, voltage, viscosity
Sensory – taste, appearance, colour
Time orientation – reliability, durability, serviceability
Quality engineering – set of operational, managerial and engineering activities that the quality characteristics of a product are at a nominal or required levels and the variability around the desired levels is minimum R.N.Sengupta.IME Dept.,IIT Kanpur,INDIA 12 MBA663:TQM<br>
slide13. Quality characteristics No two products are ever identical – variability
The thickness of blades of a fan/between two fans will be different
Customer may not accept product if this variability is large
Sources of variability include difference in materials, difference in the performance and operation of the manufacturing unit etc.
Specification
Desired measurements of the characteristics
A value of measurement that corresponds to the desired value for the quality characteristic is called the nominal or target value R.N.Sengupta.IME Dept.,IIT Kanpur,INDIA 13 MBA663:TQM<br>
slide14. Some Important Terminologies The largest allowable value for a quality characteristic is called the Upper Specification Limit (USL)
The smallest allowable value for the quality characteristic is called the Lower Specification Limit (LSL)
Nonconforming products – which do not meet one or more of it’s specifications
A non-conforming product is called defective as it has one of or more defects
A defect is the non-conformance to the specification R.N.Sengupta.IME Dept.,IIT Kanpur,INDIA 14 MBA663:TQM<br>
slide15. An Example Consider a blade of a fan
Let length and thickness be two quality characteristics
For length
Target length:30 cm
USL: 32 cm
LSL:28 cm
A blade having length between 28cm and 32cm is acceptable
For thickness
Target value: 10mm
USL : 12 mm
LSL: 8mm
A blade having thickness between 8mm and 12 mm is acceptables R.N.Sengupta.IME Dept.,IIT Kanpur,INDIA 15 MBA663:TQM<br>
slide16. An Example (continued) If a blade has length 32cm and thickness 6 mm then it is said to be non-conforming/defective and has 1 defect (for the thickness)
If a blade has length 33cm and thickness 9 mm then it is said to be non-conforming/defective and has 1 defect (for the length)
If a blade has length 34cm and thickness 6 mm then it is said to be non-conforming/defective and has 2 defects (for the thickness)
If a blade has length 32cm and thickness 8mm then it is said to be conforming and has no defect R.N.Sengupta.IME Dept.,IIT Kanpur,INDIA 16 MBA663:TQM<br>
slide17. Brief History of Quality Control and Improvement R.N.Sengupta.IME Dept.,IIT Kanpur,INDIA 17 MBA663:TQM<br>
slide18. History of Quality Control R.N.Sengupta.IME Dept.,IIT Kanpur,INDIA 18 MBA663:TQM<br>
slide19. History of Quality Control R.N.Sengupta.IME Dept.,IIT Kanpur,INDIA 19 MBA663:TQM<br>
slide20. History of Quality Control R.N.Sengupta.IME Dept.,IIT Kanpur,INDIA 20 MBA663:TQM<br>
slide21. Management Aspects of Quality Improvement Quality Planning
A strategic activity without which enormous amount of time and effort may be wasted in dealing with faulty designs, manufacturing defects, customer complaints etc.
It involves identifying the internal and external customers and listening to their needs (listening to the Voice of the Customer(VoC)
Helps in developing products or services that exceed customer expectations R.N.Sengupta.IME Dept.,IIT Kanpur,INDIA 21 MBA663:TQM<br>
slide22. Management Aspects of Quality Improvement Quality Assurance - It is the set of activities that ensures the quality levels of products and services are properly maintained and that supplier and customer quality issues are properly resolved
Documentation of quality system - policy, procedures, work instructions and specifications, and records.
Policy -> what is to be done
Procedure ->methods and personnel
Work instruction and specification -> product/department oriented R.N.Sengupta.IME Dept.,IIT Kanpur,INDIA 22 MBA663:TQM<br>
slide23. Management Aspects of Quality Improvement Quality control and improvement
The set of activities used to ensure that the products and services meet requirements and are improved on a continuous basis
Since variability is a major source of poor quality, this involves uses of statistical techniques such as Statistical Process control and Design of Experiments
Often done in a project by project basis R.N.Sengupta.IME Dept.,IIT Kanpur,INDIA 23 MBA663:TQM<br>
slide24. Quality Philosophy and Management Strategies - W. Edwards Deming 14 point frame work for quality and productivity improvement
Create a constancy of purpose focused on the improvement of products and services
Adopt a new philosophy that recognizes we are in a different economic era.
Do not rely on mass inspection to “control” quality
Do not award business to suppliers on the basis of price alone, but also consider quality
Focus on continuous improvement R.N.Sengupta.IME Dept.,IIT Kanpur,INDIA 24 MBA663:TQM<br>
slide25. Quality Philosophy and Management Strategies - W. Edwards Deming Practice modern training methods and invest in on-the-job training for all employees.
Improve leadership, and practice modern supervision methods
Drive out fear
Break down the barriers between functional areas of the business.
Eliminate targets, slogans, and numerical goals for the workforce
Eliminate numerical quotas and work standards
Remove the barriers that discourage employees from doing their jobs.
Institute an ongoing program of education for all employees
Create a structure in top management that will vigorously advocate the first 13 points R.N.Sengupta.IME Dept.,IIT Kanpur,INDIA 25 MBA663:TQM<br>
slide26. Seven deadly sins of management: W. Edwards Deming Lack of constancy of purpose
Emphasis on short-term profits
Evaluation of performance, merit rating, and annual reviews of performance
Mobility of top management
Running a company on visible figures alone
Excessive medical costs
Excessive legal damage awards R.N.Sengupta.IME Dept.,IIT Kanpur,INDIA 26 MBA663:TQM<br>
slide27. Quality Philosophy and Management Strategies - W. Edwards Deming Recommended model for improvement
Plan-Do-Check-Act, are often called the PDCA cycle.
The check step is sometimes called Study
The cycle becomes PDSA R.N.Sengupta.IME Dept.,IIT Kanpur,INDIA 27 MBA663:TQM<br>
slide28. Quality Management Philosphy: Joseph M Juran Three components
Juran Trilogy of planning, control and improvement
Planning
Identifying external customers and their needs
Planning for quality improvement on a regular basis
Control
Statistical Process control
Improvement
Project by project improvement
Higher quality than current levels
Breakthrough and incremental improvement R.N.Sengupta.IME Dept.,IIT Kanpur,INDIA 28 MBA663:TQM<br>
slide29. Quality Control: Armand V. Feigenbaum Introduced the concept of company wide
quality control in the book “Total Quality Control”
Three step approach to improving quality
Quality Leadership
Quality Technology
Organizational Commitment
19 step quality improvement process R.N.Sengupta.IME Dept.,IIT Kanpur,INDIA 29 MBA663:TQM<br>
slide30. Total Quality Management A strategy for implementing and managing quality improvement strategies across the organization
Started in 1980 with Deming’s and Juran’s philosophies
Focus on all elements of organization on quality improvement efforts
Major focus was on customer and integrating quality goals with business goals
Different teams including quality council, cross-functional teams to improve quality
Limited success R.N.Sengupta.IME Dept.,IIT Kanpur,INDIA 30 MBA663:TQM<br>
slide31. Total Quality Management “A management philosophy and company practices that aim to harness the human and material resources of an organization in the most effective way to achieve the objectives of the organization."
Formal definition of TQM as given by British Standards Institution
Main targets of TQM
Customer Satisfaction
Continuous Operational Improvement
Continuous Cost Reduction
A “want to” culture instead of “have to” culture
Highly Skilled Workforce R.N.Sengupta.IME Dept.,IIT Kanpur,INDIA 31 MBA663:TQM<br>
slide32. Quality Circle R.N.Sengupta.IME Dept.,IIT Kanpur,INDIA 32 MBA663:TQM<br>
slide33. Reasons for Limited Success Ineffective training and lack of proper impact measurement
Major focus was on customer and integrating quality goals with business goals
Inadequate use of statistical methods and insufficient recognition of variability reduction as a prime objective
General as opposed to specific business-results-oriented objectives
Too much emphasis on widespread training as opposed to focused technical education
Wrapping around ineffective programs like Zero Defects, Quality is free etc. R.N.Sengupta.IME Dept.,IIT Kanpur,INDIA 33 MBA663:TQM<br>
slide34. Basic Ideas of Probability distribution Consider the rolling of a dice
Total there are 6 possible outcomes (1,2,3,4,5,6)(Sample Space)
Say let X(random variable) denote the outcome 5 (when we toss a dice and a 5 appears)
So probability(X=5)=1/6(No of favourable outcome/total possible outcomes)
A probability distribution function can be thought of as a mathematical function which gives the probability for an outcome for a particular random variable R.N.Sengupta.IME Dept.,IIT Kanpur,INDIA 34 MBA663:TQM<br>
slide35. PMF and PDF Probability distribution functions can be for discrete and continuous events
Discrete – When the sample space is made of discrete events like tossing a dice will always have an outcome from the set(1,2,3,4,5,6)
Continuous- When the sample space consists of continuous numbers like temperature of a room (it can be any continuous value between say 15 and 50 like 15.51 or 16.72)
For the discrete case, the probability distribution is termed as Probability Mass Function(PMF)
For the continuous case, the probability distribution is termed as Probability Density Function(PDF) R.N.Sengupta.IME Dept.,IIT Kanpur,INDIA 35 MBA663:TQM<br>
slide36. PMF- AN example (Rolling two dices) R.N.Sengupta.IME Dept.,IIT Kanpur,INDIA 36 MBA663:TQM<br>
slide37. PDF – Normal Distribution(Bell shaped curve) The above graph shows the probability dictribution for a set of outcomes referred to as z values
From the graph it can be said that probability of z=2 and z=-2 is equal and its value is .05
What if we want to find the probability for z>2 or z<3?? R.N.Sengupta.IME Dept.,IIT Kanpur,INDIA 37 MBA663:TQM<br>
slide38. CDF PDF and PMF gives the probability at a point for continuous and discrete events
What if we want to find the probability of a set of events as mentioned?
Say from the normal graph, we want to find the probability of z<2
The probability will be equal to sum of all probability from -6(the leftmost point) to 2
The probability distribution which shows the sum of probability up to that point is termed as Cumulative Distribution Function(CDF) R.N.Sengupta.IME Dept.,IIT Kanpur,INDIA 38 MBA663:TQM<br>
slide39. CDF for Discrete case R.N.Sengupta.IME Dept.,IIT Kanpur,INDIA 39 MBA663:TQM<br>
slide40. CDF for Continuous Case R.N.Sengupta.IME Dept.,IIT Kanpur,INDIA 40 MBA663:TQM<br>
slide41. Standard Normal Distribution and Standard Normal Table(Cumulative) A normal distribution with mean=μ=0 and standard deviation=σ=1 is termed as a standard normal distribution R.N.Sengupta.IME Dept.,IIT Kanpur,INDIA 41 MBA663:TQM<br>
slide42. Six Sigma- An Overview Developed by Motorola around 1980s
Focus is on reducing variability of product quality characteristics to a level at which defects becomes extremely unlikely
We assume that a particular quality characteristic follow a normal distribution with mean=μ and standard deviation= σ R.N.Sengupta.IME Dept.,IIT Kanpur,INDIA 42 MBA663:TQM<br>
slide43. Sig Sigma(continued) The probability of producing a product within this specification is .9973 which transforms to around 2700 defective parts per million(ppm) (Three sigma quality performance)
Consider a product which has 100 components of above type and for it to work correctly all 100 must function correctly
So the probability that a particular product is non-defective from a basket of such products is given by:
=.9973*.9973….100times= (.9973)100 =.7631
So the probability that a product will be defective is around 23%
Now consider the fact that for a car has around 100000 components and a an airplane has around 1 to2million components R.N.Sengupta.IME Dept.,IIT Kanpur,INDIA 43 MBA663:TQM<br>
slide44. Six sigma concept Reduce the variability in process so that the specification limits are at least 6 standard deviations(σs) from the mean
Under such a scenario the probability that the item is non defective is .9999998 or .2 ppm
It is assumed that once six sigma level is reached, the process mean may shift by 1.5σs R.N.Sengupta.IME Dept.,IIT Kanpur,INDIA 44 MBA663:TQM<br>
slide45. Six Sigma – An Overview Six sigma is used for improving corporate business performance by improving quality and lowering costs
Individuals having special training on statistical methods and quality management/improvement tools are involved in implementing six sigma quality improvements
Designated as Green Belt(least experienced), Black Belt(team leads) and Master Black Belt(technical experts who work with multiple teams and share their expertise) R.N.Sengupta.IME Dept.,IIT Kanpur,INDIA 45 MBA663:TQM<br>
slide46. DMAIC - 5 Step Problem Solving Approach R.N.Sengupta.IME Dept.,IIT Kanpur,INDIA 46 MBA663:TQM<br>
slide47. Structured Problem Solving DMAIC DMAIC is a structured problem soling methodology that can be used for cycle time reduction, throughput improvement etc.
Each stage is followed by a “tollgate”
Evaluation after completion of a particular stage to ensure project is on track and to allow suggestions for modification
It uses a small set of powerful tools that can be specifically applied to each of the steps
Cause and Effect->Measure
Process capability analysis ->Measure
Hypothesis Testing-> Analyze R.N.Sengupta.IME Dept.,IIT Kanpur,INDIA 47 MBA663:TQM<br>
slide48. Define Objective is to identify and validate a project opportunity
Project must be important to customer as well as the business
Project charter to be prepared R.N.Sengupta.IME Dept.,IIT Kanpur,INDIA 48 MBA663:TQM<br>
slide49. Define Graphical understanding of flow in a process-SIPOC Diagram
Action plan for moving forward to other steps
Tentative timeline, individual work assignments etc.
Tollgate review
Are stakeholders identified?
Is the symptom appropriately being focussed? R.N.Sengupta.IME Dept.,IIT Kanpur,INDIA 49 MBA663:TQM<br>
slide50. Measure This step involves collection of data relating to quality, cost, throughput time etc.
Develop a list of Key Process Input Variable(KPIV) and Key Process Output Variable(KPOV)
Data collected tells us about the current state or baseline performance
Important to measure the capability of measurement system using tools gauge repeatability and reproducibility
Data collected can be displayed in forms of Pareto charts, histogram
If needed project charter to be updated and team makeup to be revaluated
Tollgate Review
All assumptions made for data collection
Complete process flow chart R.N.Sengupta.IME Dept.,IIT Kanpur,INDIA 50 MBA663:TQM<br>
slide51. Analyse Objective is to use data collected from previous step to understand cause-and-effect relationship and to identify sources of variability
Identify sources of common cause and assignable cause
Several tools are used in this step
Control charts to separate common cause from assignable cause
Hypothesis testing and confidence interval estimation to determine if different conditions of operation produce statistically different results
Regression analysis to model dependent and independent variables R.N.Sengupta.IME Dept.,IIT Kanpur,INDIA 51 MBA663:TQM<br>
slide52. Analyse (continued) Failure Modes and Effects Analysis(FMEA)
Used to prioritize different sources of error, variability or failure according to:
The likelihood that something will go wrong (ranked on a 1 to 10 scale with 1 = not likely and 10 = almost certain).
The ability to detect a failure, defect or error (ranked on a 1 to 10 scale with 1 = very likely to detect and 10 = very unlikely to detect).
The severity of a failure, defect or error (ranked on a 1 to 10 scale with 1 = little impact and 10 = extreme impact, including extreme financial loss, injury, or loss of life).
The three scores are multiplied to obtain a Risk Priority Number(RPN)
Tollgate Review
What opportunities are to be targeted for investigation?
Will the investigation of these opportunities help the desired outcome R.N.Sengupta.IME Dept.,IIT Kanpur,INDIA 52 MBA663:TQM<br>
slide53. Improve Creative thinking to about the specific change that can be made in the process
Redesigning process to eliminate bottleneck/reduce wastes
Mistake proofing – One correct way of doing things
Develop a solution and do a pilot test for the study
Tollgate Review
Adequate documentation of how the problem solution was obtained
Results of pilot test including data display, analysis, experiments and simulation analysis
Plans to implement the pilot test results on a full-scale basis
Analysis of any risks of implementing the solution, and appropriate risk-management plans R.N.Sengupta.IME Dept.,IIT Kanpur,INDIA 53 MBA663:TQM<br>
slide54. Control Objective is to complete all remaining project and to hand off the improved process to the owner along with a process control plan
The process owner should be provided with before and after data on key process metrics, operations and training documents, and updated current process maps
Control charts are an important statistical tool used in the control step of DMAIC
Tollgate Review
A summary of lessons learned from the project should be available
Data illustrating that the before and after results are in line with the project charter should be available
A list of opportunities to use the results of the project in other parts of the business should be prepared R.N.Sengupta.IME Dept.,IIT Kanpur,INDIA 54 MBA663:TQM<br>
slide55. Examples of implementation of DMAIC DuPont Litigation Case- To develop an efficient process to allow timely access to needed documents with minimal errors
Define
Rapid and error free access to needed documents
Project team - Process owners, Legal Subject matter experts, clerks, information systems specialist and a Black belt in six sigma process
Focus on CTQs involving reduction of cycle time, reduction of errors, elimination of non-value-added process activities, and reduction of costs
Started by mapping the entire document-production process R.N.Sengupta.IME Dept.,IIT Kanpur,INDIA 55 MBA663:TQM<br>
slide56. DuPont Litigation Case (continued) Measure
The team measured the degree to which the CTQs were being met by reviewing data in the electronic data base; obtaining actual invoices etc.
Errors: copy of wrong/confidential document
Analyze
FMEA analysis highlighted issues that required attention
Team interviewed persons involved in the process to understand the flow of work and the nature of problems
Some root causes identified included
A high turnover rate for the contractor’s clerks.
Inadequate training
The large volume of documents R.N.Sengupta.IME Dept.,IIT Kanpur,INDIA 56 MBA663:TQM<br>
slide57. DuPont Litigation Case (continued) Improve
the team proposed a digital scanning system for the documents
Solution rejected earlier because of higher costs
Actual loss in terms of errors etc. was identified to be higher
Worked with IT team to identify appropriate system
Control
Design of the new system to automatically track and report the estimated costs per document
The system also tracked performance on other critical CTQs and reported the information to users of the process
Explanations about how the new system worked and necessary training were provided for all those who used the system R.N.Sengupta.IME Dept.,IIT Kanpur,INDIA 57 MBA663:TQM<br>
slide58. A second example – Improving On Time Delivery Problem
On-time deliveries were at 85%, instead of the desired target value of 100%
Customer penalty clause of 15%
Customer concern regarding capability and schedule adherence of supplier
Define
Objective: 100% on-time delivery.
Maintaining a satisfied customer
Measure
The contractual lead time for delivery of the tool was eight weeks
The CTQ for this process was to meet the target contractual lead time
Certain historical data were available R.N.Sengupta.IME Dept.,IIT Kanpur,INDIA 58 MBA663:TQM<br>
slide59. Process Map R.N.Sengupta.IME Dept.,IIT Kanpur,INDIA 59 MBA663:TQM<br>
slide60. Improving On Time Delivery Analyze
Supplier quality issues
Purchase order process delay
Delay in customer confirmation
Incorrect tool configuration orders
Improve
Supplier Quality Control and Improvement
Improve the Internal Purchase Order Process
Improve the Ordering Process with the Customer
Control
Developed a new process map R.N.Sengupta.IME Dept.,IIT Kanpur,INDIA 60 MBA663:TQM<br>
slide61. Improved Process Map R.N.Sengupta.IME Dept.,IIT Kanpur,INDIA 61 MBA663:TQM<br>
slide62. DMADV A variation of DMAIC used for customer focussed services like product improvement, product adjustment or new product development
Define
Identify the needs and wants of customer through customer review, feedback etc.
Measure
Process required to manufacture the product/deliver the service are assigned metrics
Analyze
Results of manufacturing/service delivery process is tested by internal teams R.N.Sengupta.IME Dept.,IIT Kanpur,INDIA 62 MBA663:TQM<br>
slide63. DMADV (continued) Design
Results of the internal tests are compared with identified client requirements
Adjustments (if required) are made
Improved process is tested and presented to test customer groups for feedback
Verify
Continuous adjustment while product/service is delivered
New metrics to track and review customer feedback and review
Other area may be identified which may lead to new DMADV cycles R.N.Sengupta.IME Dept.,IIT Kanpur,INDIA 63 MBA663:TQM<br>
slide64. Three Generations of Six Sigma Six sigma implementation can be divided into three generations
The first generation focussed on defect elimination and variability reduction
Motorola is the best example
Second generation mainly focussed on integrating the above with improved business performance through cost reduction
GE is a pioneer in such efforts
Third generation is marked by focus on creating value throughout the organization and for its stakeholders
Owners, employees, customers, suppliers R.N.Sengupta.IME Dept.,IIT Kanpur,INDIA 64 MBA663:TQM<br>
slide65. Six Sigma Organization R.N.Sengupta.IME Dept.,IIT Kanpur,INDIA 65 MBA663:TQM<br>
slide66. DFSS and Lean Six sigma is often used in conjunction with DFSS and Lean
DFSS- Design for Six sigma
Used for new product development
VoC(Voice of Customer) is used for identification of new products
Critical quality requirements for such product are then developed
In place of DMAIC, DMADV(D-Design, V-Verify) is used
Lean uses several tools of industrial engineering and operations research
Use of simulation models to predict performance of new/redesigned systems R.N.Sengupta.IME Dept.,IIT Kanpur,INDIA 66 MBA663:TQM<br>
slide67. Combined Usage Model R.N.Sengupta.IME Dept.,IIT Kanpur,INDIA 67 MBA663:TQM<br>
slide68. Link between Quality and Productivity Rapid evolution of technology->urgency to exploit the new technology->problems in designing and manufacturing superior quality products
Dimensions of an optimal process
Economy, efficiency, productivity, quality
Effective quality improvement can be instrumental in increasing productivity and reducing cost
Basic categories of quality cost
Prevention Costs – new product review, Burn-in, Training etc.
Appraisal Costs – Inspection of incoming/outgoing products, maintaining accuracy of test equipment
Internal Failure Costs- Scrap, Rework, Downtime, Failure Analysis
External Failure costs- Warranty charges, liability costs, Complaint adjustment R.N.Sengupta.IME Dept.,IIT Kanpur,INDIA 68 MBA663:TQM<br>
slide69. Implementing Quality Improvement Management must recognize that quality is a multifaceted entity
Important step of strategic quality management is identification of those dimensions in which the organization will compete
Select and develop the “niches” of quality
In industries where a high percentage of parts in the end item are manufactured by outside suppliers, selecting suppliers is an important task
Selection of suppliers should be based on quality, schedule, and cost, rather than on cost alone R.N.Sengupta.IME Dept.,IIT Kanpur,INDIA 69 MBA663:TQM<br>
slide70. Implementing Quality Improvement Quality improvement must be a total, company-wide activity, and that every organizational unit must actively participate
A significant challenge to senior management
Responsibility of quality assurance is to assist management in providing quality assurance for the companies’ products
All of the individuals in the organization must have an understanding of the basic tools of quality improvement
There must be some specialised experts but everyone should know the basics R.N.Sengupta.IME Dept.,IIT Kanpur,INDIA 70 MBA663:TQM<br>
slide71. Toyota Production System(TPS) Developed by Toyota Motor Corporation to
Provide best quality
Lowest cost
Shortest lead time
It consist of two pillars
Jut in Time
Jidoka
TPS - Taiichi Ohno
Jidoka – Sakichi Toyoda
JIT – Kiichiro Toyoda
The Machine that Change World
Published by MIT in 1990 R.N.Sengupta.IME Dept.,IIT Kanpur,INDIA 71 MBA663:TQM<br>
slide72. Kaizen Kaizen consist of two words (Kai->change) and (Zen->good)
Broad philosophy is to focus on continuous improvement on all aspects of life
Removing all forms of waste
Focus on standardizing activities and processes
It is a 7 step cyclic process that involves several iterations
Identify an opportunity
Analyse the process
Develop an optimal solution
Implement the solution
Implement the solution
Study the result
Standardize the solution
Plan for the future R.N.Sengupta.IME Dept.,IIT Kanpur,INDIA 72 MBA663:TQM<br>
slide73. Some Areas covered under Kaizen Quality
Better product/service, reduced cost, process and methods
Cost
Reduction of expense and waste of manpower, better use of energy etc.
Delivery
Reducing delivery time, elimination of non-value adding activity
Management
Training, planning, documentation, information flow
Management support and action is of prime importance
Safety
Reducing hazardous process/methods, unsafe working condition, damage to environment etc. R.N.Sengupta.IME Dept.,IIT Kanpur,INDIA 73 MBA663:TQM<br>
slide74. Execution of Kaizen Kaizen should be preceded by a careful consideration of the three states
Now: Present Condition
Next: Desired State
New: How to Reach that State
A possible three stage implementation process
Encourage participation: Promoting kaizen specific activities through monetary or other benefits
Training and Education: Desired training to understand principles and problem solving techniques
Quality Level Improvement: Focus on alignment with organizational objective and planning objective R.N.Sengupta.IME Dept.,IIT Kanpur,INDIA 74 MBA663:TQM<br>
slide75. References http://www.sae.org/manufacturing/lean/column/leanjun01.htm
https://en.wikipedia.org/wiki/W._Edwards_Deming
Picture of Deming
https://en.wikipedia.org/wiki/Joseph_M._Juran
Picture of Juran
http://mitsloan.mit.edu/alumnimagazine/ss09-alumni-news.php
Picture of Feigenbaum
https://www.isixsigma.com/methodology/kaizen/kaizen-six-sigma-ensures-continuous-improvement/
http://businesscasestudies.co.uk/leyland-trucks/continuous-improvement-within-an-organisation/continuous-improvement-or-kaizen.html#axzz4Un8Si4k9
Kaizen case study example R.N.Sengupta.IME Dept.,IIT Kanpur,INDIA 75 MBA663:TQM<br>
slide76. References https://www.villanovau.com/resources/six-sigma/six-sigma-methodology-dmadv/#.WGz54IVOLIU R.N.Sengupta.IME Dept.,IIT Kanpur,INDIA 76 MBA663:TQM<br>