
U.S. Centers for Disease Control and Prevention









Description: U.S. Centers for Disease Control and Prevention Data Sources and Technical Notes Deaths in the general population with HIV disease as the underlying cause of death, 19872023United States Note. Data from CDC WONDER Online Database based on
Related Topics
Download Presentation
"U.S. Centers for Disease Control and Prevention" is the property of its rightful owner. Permission is granted to download and print the materials on this website for personal, non-commercial use only, and to display it on your personal computer provided you do not modify the materials and that you retain all copyright notices contained in the materials. By downloading content from our website, you accept the terms of this agreement.
Presentation Transcript
slide1. U.S. Centers for Disease Control and Prevention<br>
slide2. Data Sources and Technical Notes<br>
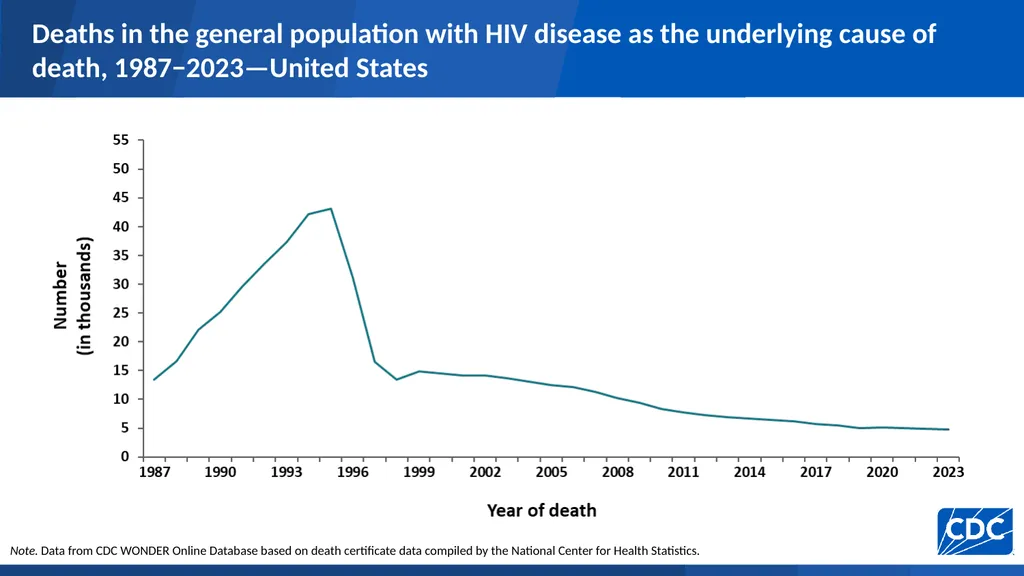
slide3. Deaths in the general population with HIV disease as the underlying cause of death, 1987−2023—United States Note. Data from CDC WONDER Online Database based on death certificate data compiled by the National Center for Health Statistics.<br>
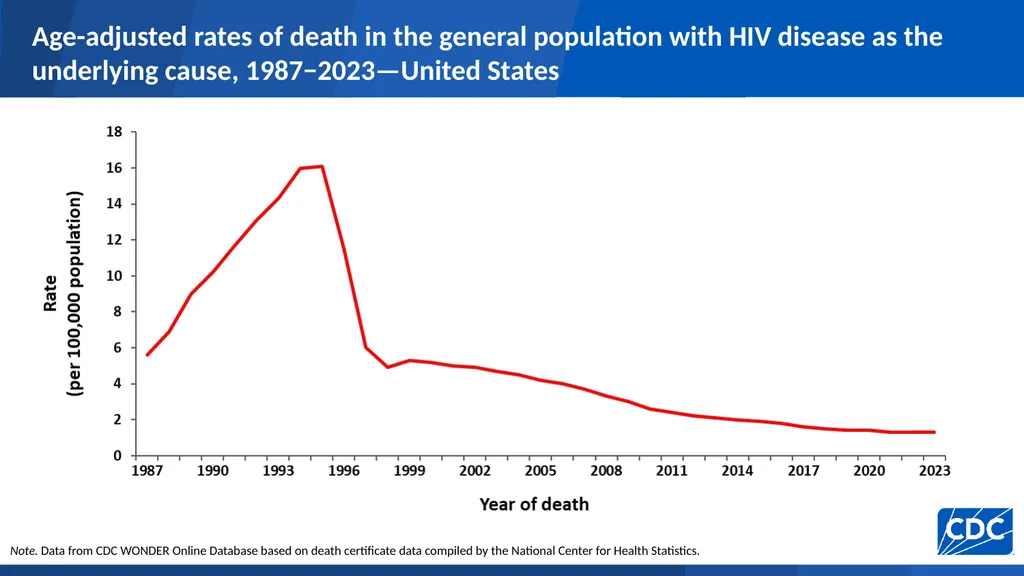
slide4. Age-adjusted rates of death in the general population with HIV disease as the underlying cause, 1987−2023—United States Note. Data from CDC WONDER Online Database based on death certificate data compiled by the National Center for Health Statistics.<br>
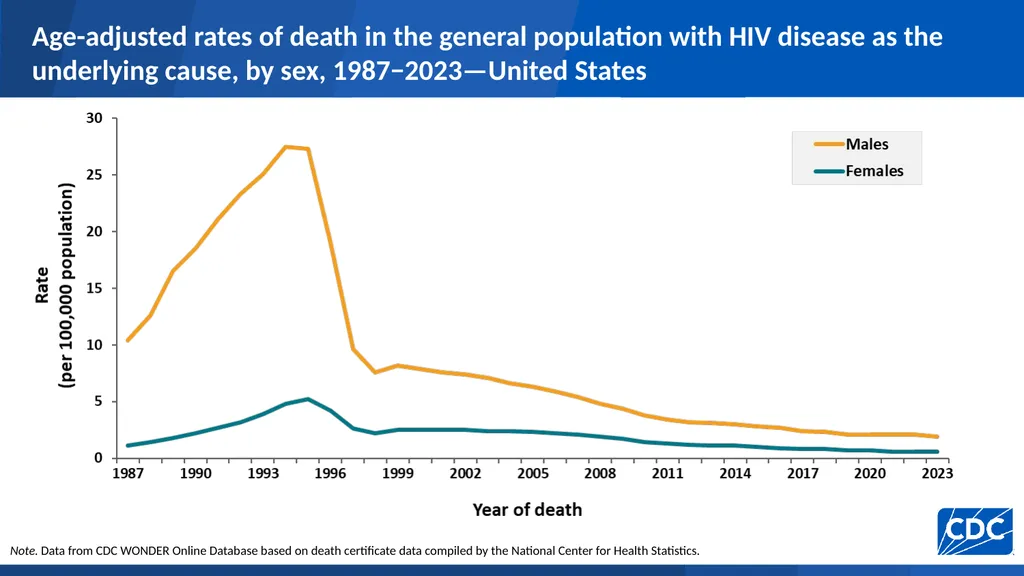
slide5. Age-adjusted rates of death in the general population with HIV disease as the underlying cause, by sex, 1987−2023—United States Note. Data from CDC WONDER Online Database based on death certificate data compiled by the National Center for Health Statistics.<br>
slide6. Age-adjusted rates and percentage distribution of deaths in the general population with HIV disease as the underlying cause by sex, 1987–2023—United States Note. Data from CDC WONDER Online Database based on death certificate data compiled by the National Center for Health Statistics.<br>
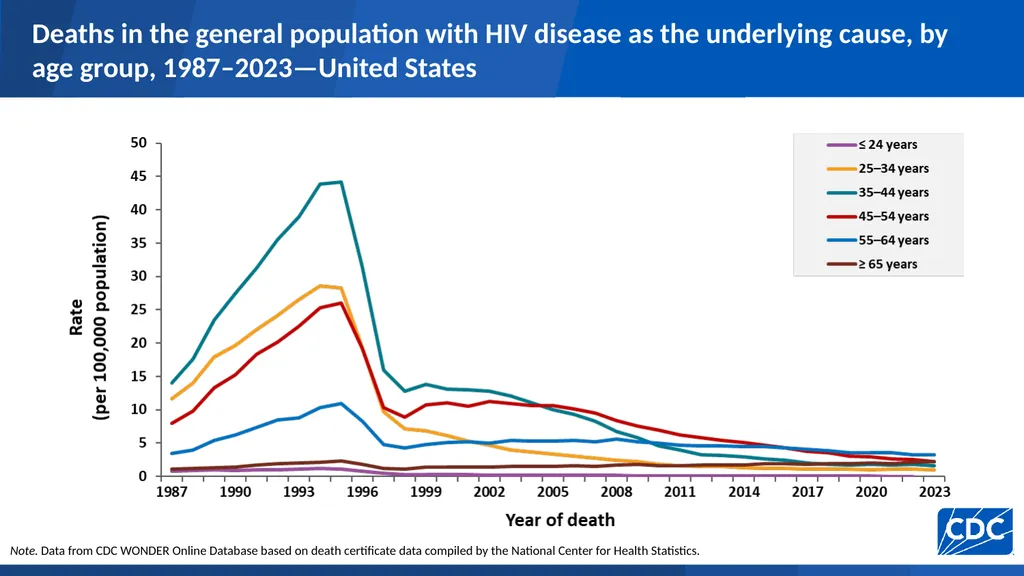
slide7. Deaths in the general population with HIV disease as the underlying cause, by age group, 1987–2023—United States Note. Data from CDC WONDER Online Database based on death certificate data compiled by the National Center for Health Statistics.<br>
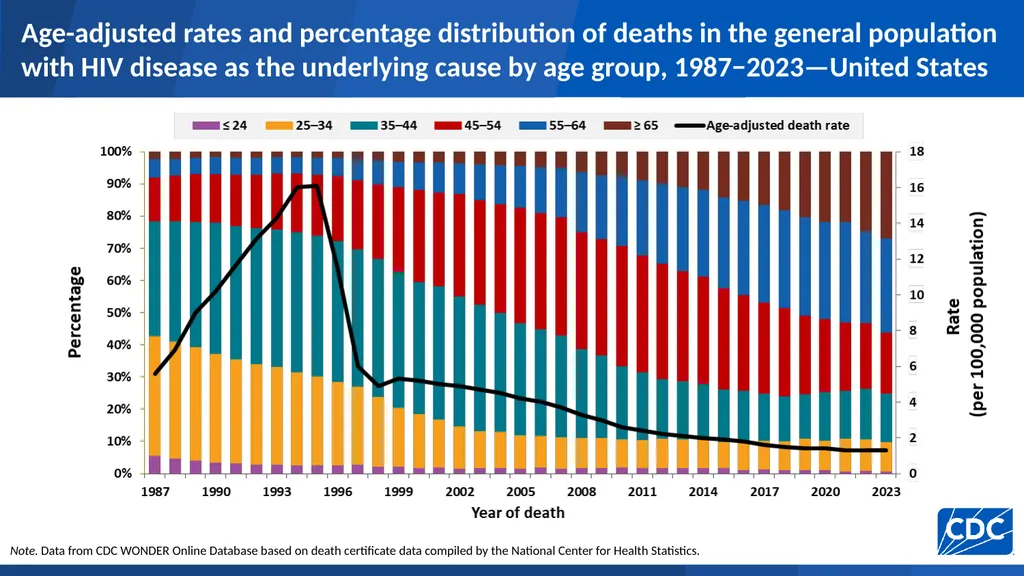
slide8. Age-adjusted rates and percentage distribution of deaths in the general population with HIV disease as the underlying cause by age group, 1987−2023—United States Note. Data from CDC WONDER Online Database based on death certificate data compiled by the National Center for Health Statistics.<br>
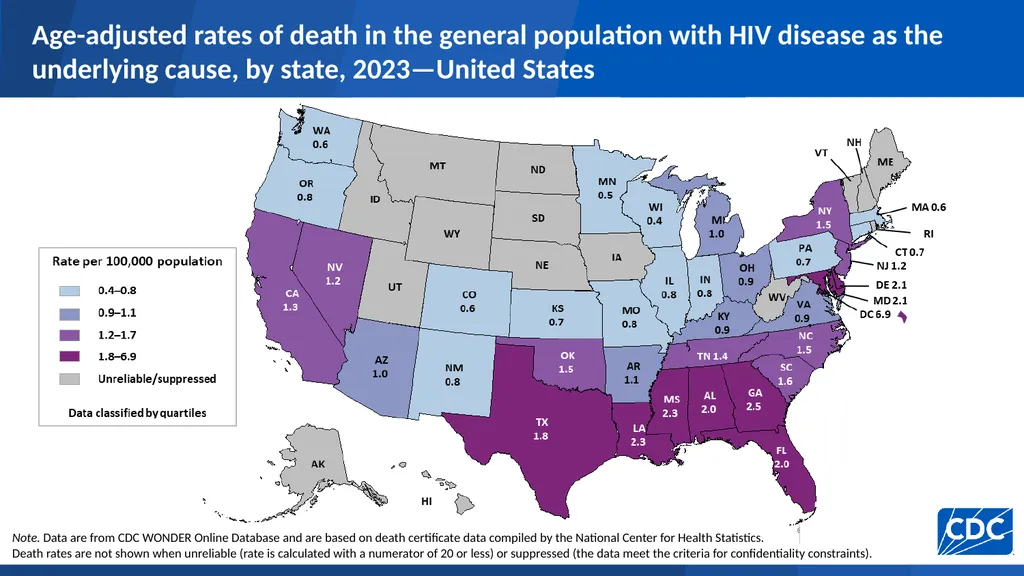
slide9. Age-adjusted rates of death in the general population with HIV disease as the underlying cause, by state, 2023—United States Note. Data are from CDC WONDER Online Database and are based on death certificate data compiled by the National Center for Health Statistics.
Death rates are not shown when unreliable (rate is calculated with a numerator of 20 or less) or suppressed (the data meet the criteria for confidentiality constraints).<br>
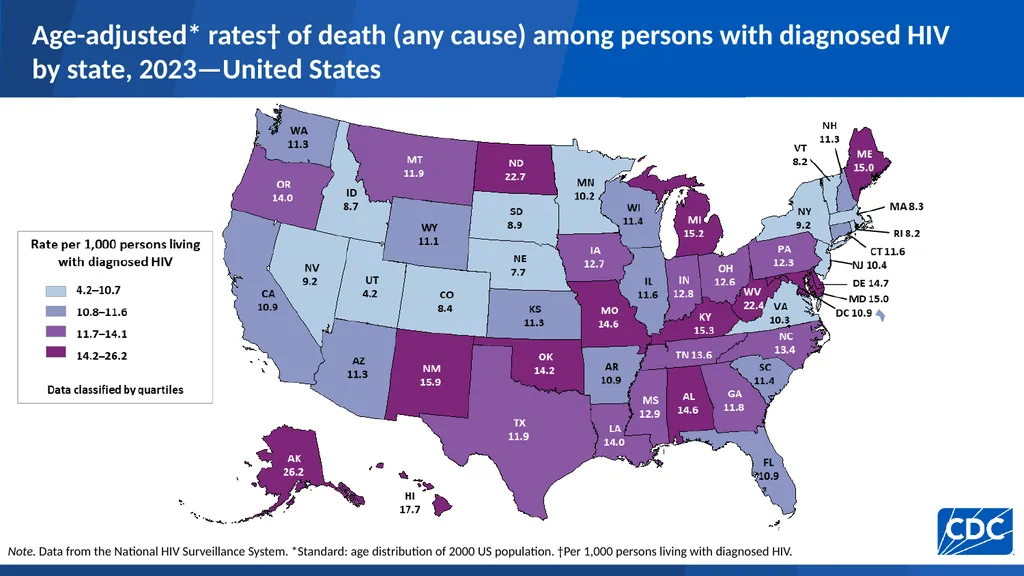
slide10. Age-adjusted* rates† of death (any cause) among persons with diagnosed HIV by state, 2023—United States Note. Data from the National HIV Surveillance System. *Standard: age distribution of 2000 US population. †Per 1,000 persons living with diagnosed HIV.<br>
slide11. Age-adjusted rates of death in the general population with HIV disease as the underlying cause, by region, 1987–2023—United States Note. Data from CDC WONDER Online Database based on death certificate data compiled by the National Center for Health Statistics.<br>
slide12. Age-adjusted rates and percentage distribution of deaths in the general population with HIV disease as the underlying cause by region, 1987−2023—United States Note. Data from CDC WONDER Online Database based on death certificate data compiled by the National Center for Health Statistics.<br>
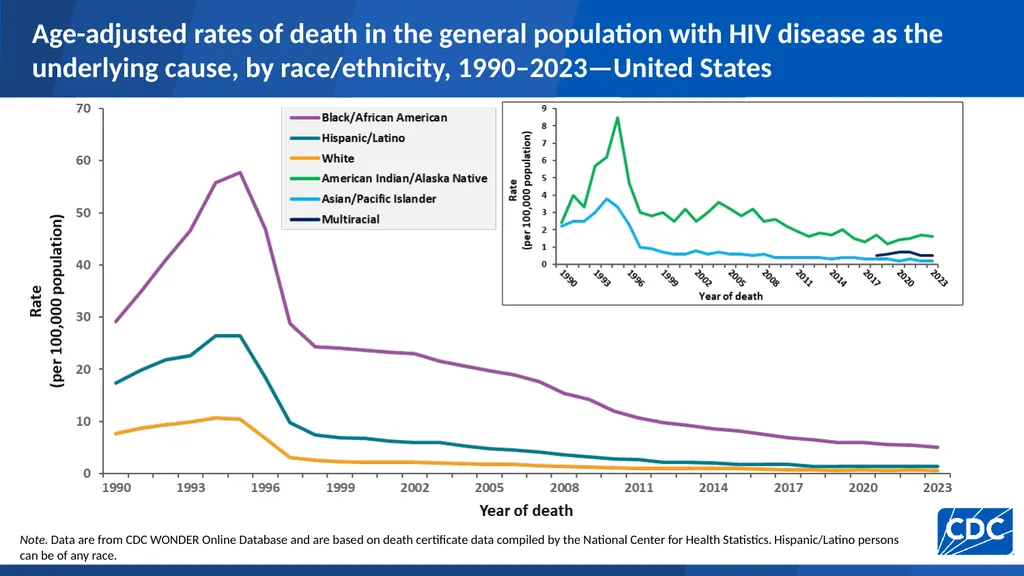
slide13. Age-adjusted rates of death in the general population with HIV disease as the underlying cause, by race/ethnicity, 1990–2023—United States Note. Data are from CDC WONDER Online Database and are based on death certificate data compiled by the National Center for Health Statistics. Hispanic/Latino persons can be of any race.<br>
slide14. Age-adjusted rates and percentage distribution of deaths in the general population with HIV disease as the underlying cause by race/ethnicity, 1990−2023—United States Note. Data are from CDC WONDER Online Database and are based on death certificate data compiled by the National Center for Health Statistics. Hispanic/Latino persons can be of any race.<br>
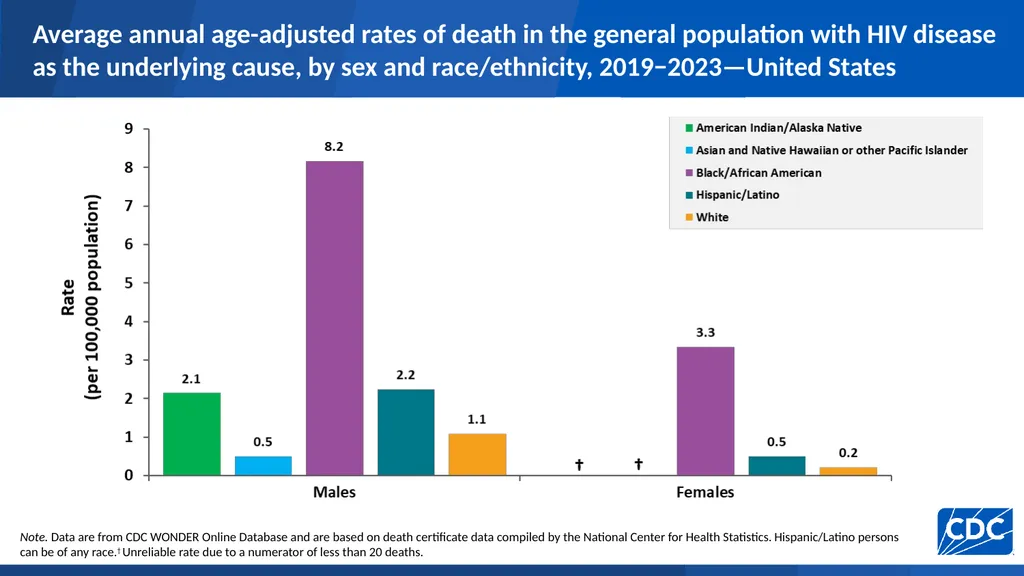
slide15. Average annual age-adjusted rates of death in the general population with HIV disease as the underlying cause, by sex and race/ethnicity, 2019−2023—United States Note. Data are from CDC WONDER Online Database and are based on death certificate data compiled by the National Center for Health Statistics. Hispanic/Latino persons can be of any race.† Unreliable rate due to a numerator of less than 20 deaths.<br>
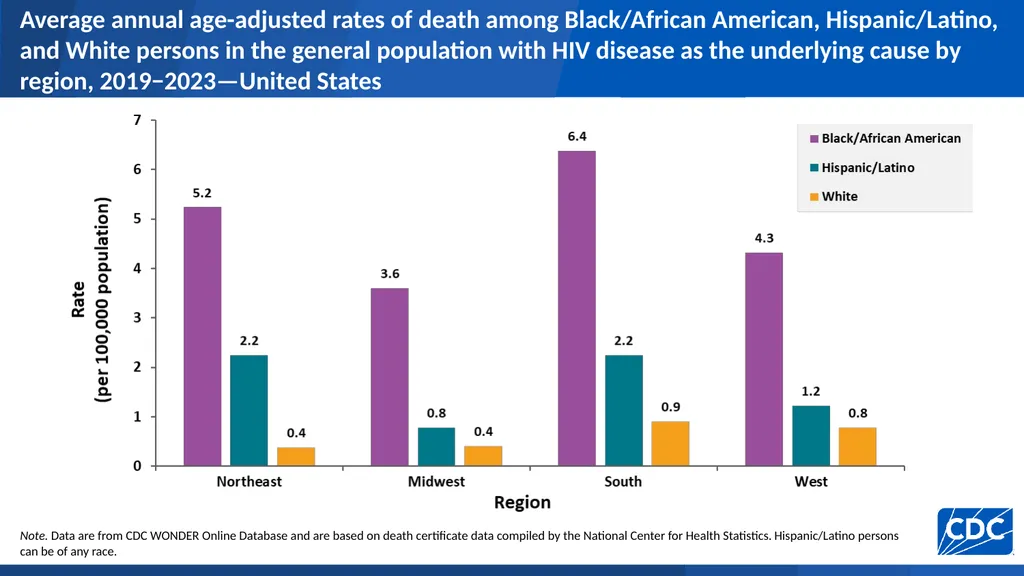
slide16. Average annual age-adjusted rates of death among Black/African American, Hispanic/Latino, and White persons in the general population with HIV disease as the underlying cause by region, 2019−2023—United States Note. Data are from CDC WONDER Online Database and are based on death certificate data compiled by the National Center for Health Statistics. Hispanic/Latino persons can be of any race.<br>
slide17. Trends in annual rates of death among persons aged 25–44 years<br>
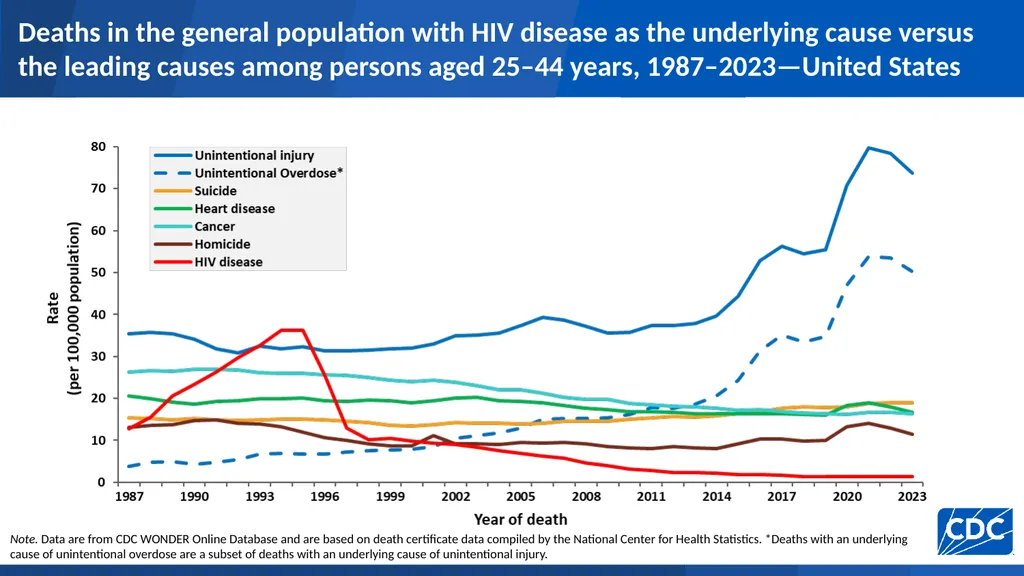
slide18. Deaths in the general population with HIV disease as the underlying cause versus the leading causes among persons aged 25–44 years, 1987–2023—United States Note. Data are from CDC WONDER Online Database and are based on death certificate data compiled by the National Center for Health Statistics. *Deaths with an underlying cause of unintentional overdose are a subset of deaths with an underlying cause of unintentional injury.<br>
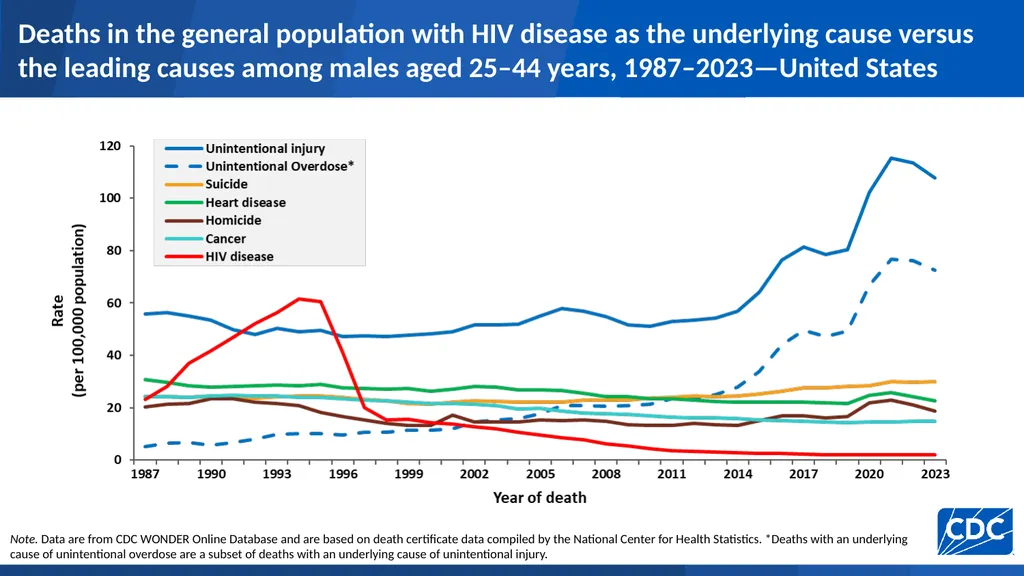
slide19. Deaths in the general population with HIV disease as the underlying cause versus the leading causes among males aged 25–44 years, 1987–2023—United States Note. Data are from CDC WONDER Online Database and are based on death certificate data compiled by the National Center for Health Statistics. *Deaths with an underlying cause of unintentional overdose are a subset of deaths with an underlying cause of unintentional injury.<br>
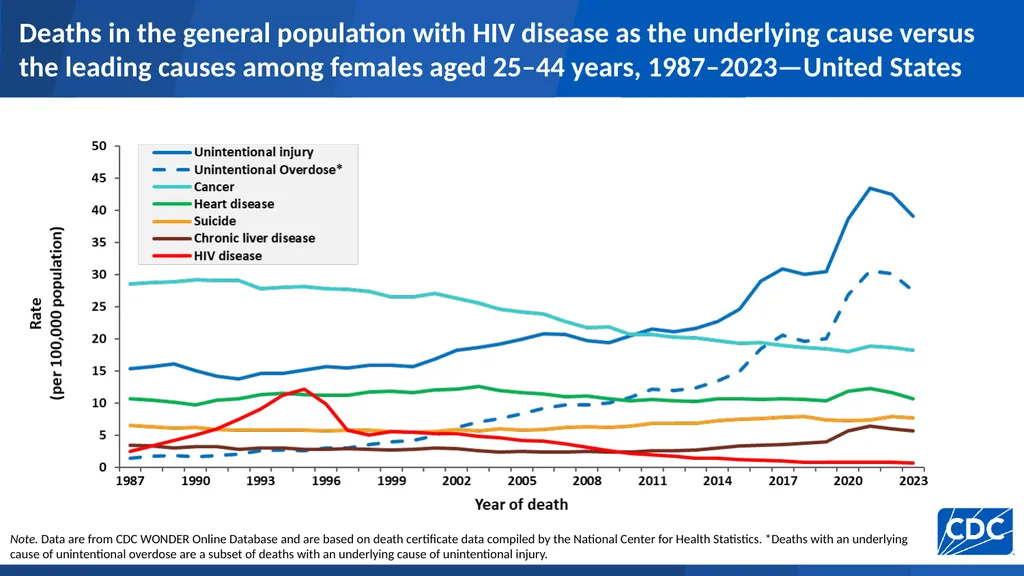
slide20. Deaths in the general population with HIV disease as the underlying cause versus the leading causes among females aged 25–44 years, 1987–2023—United States Note. Data are from CDC WONDER Online Database and are based on death certificate data compiled by the National Center for Health Statistics. *Deaths with an underlying cause of unintentional overdose are a subset of deaths with an underlying cause of unintentional injury.<br>
slide21. Deaths in the general population with HIV disease as the underlying cause versus the leading causes among Black/African American* males aged 25–44 years, 1999–2023—United States Note. Data are from CDC WONDER Online Database and are based on death certificate data compiled by the National Center for Health Statistics. *Does not include persons of Hispanic/Latino ethnicity. **Deaths with an underlying cause of unintentional overdose are a subset of deaths with an underlying cause of unintentional injury.<br>
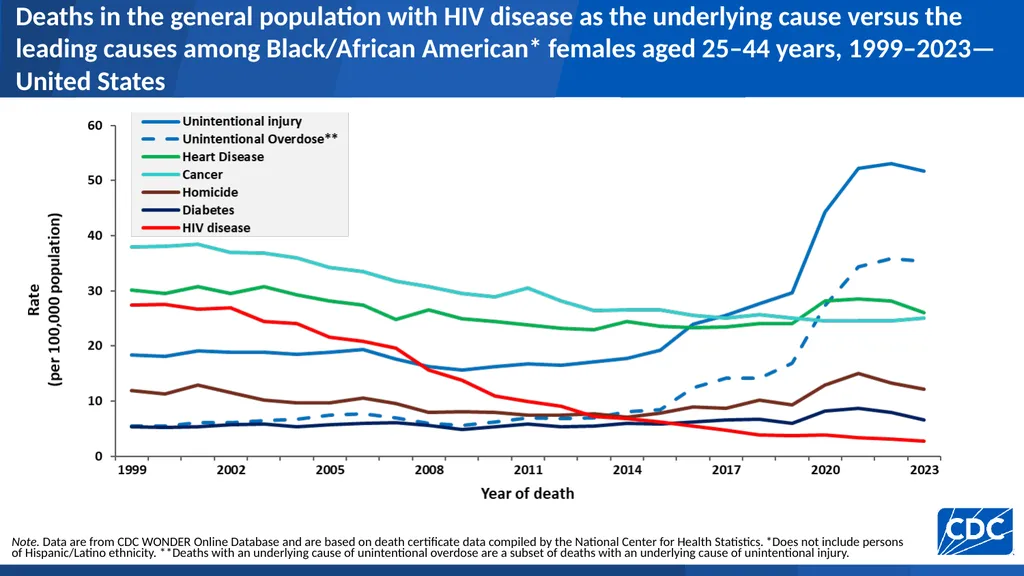
slide22. Deaths in the general population with HIV disease as the underlying cause versus the leading causes among Black/African American* females aged 25–44 years, 1999–2023—United States Note. Data are from CDC WONDER Online Database and are based on death certificate data compiled by the National Center for Health Statistics. *Does not include persons of Hispanic/Latino ethnicity. **Deaths with an underlying cause of unintentional overdose are a subset of deaths with an underlying cause of unintentional injury.<br>
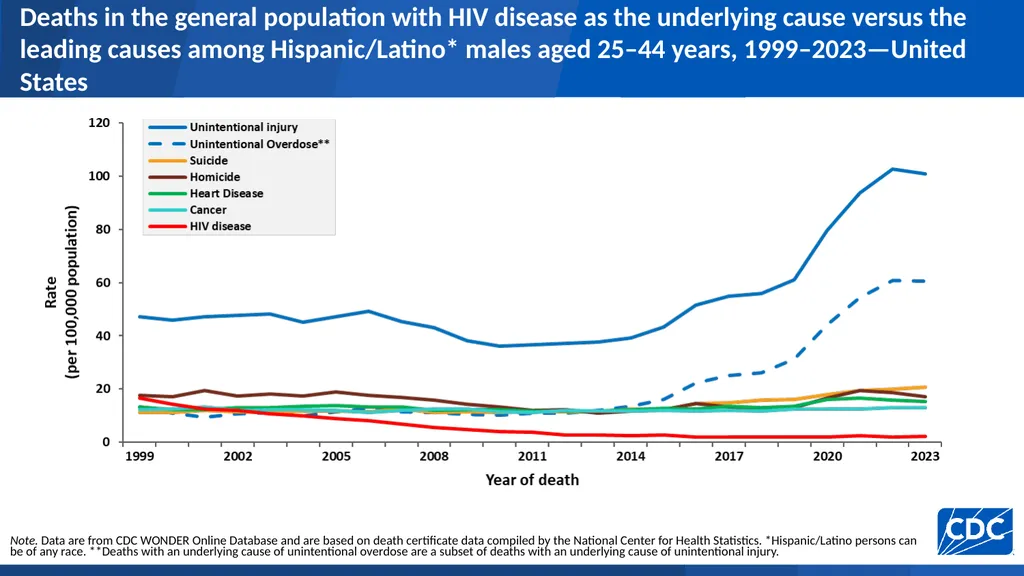
slide23. Deaths in the general population with HIV disease as the underlying cause versus the leading causes among Hispanic/Latino* males aged 25–44 years, 1999–2023—United States Note. Data are from CDC WONDER Online Database and are based on death certificate data compiled by the National Center for Health Statistics. *Hispanic/Latino persons can be of any race. **Deaths with an underlying cause of unintentional overdose are a subset of deaths with an underlying cause of unintentional injury.<br>
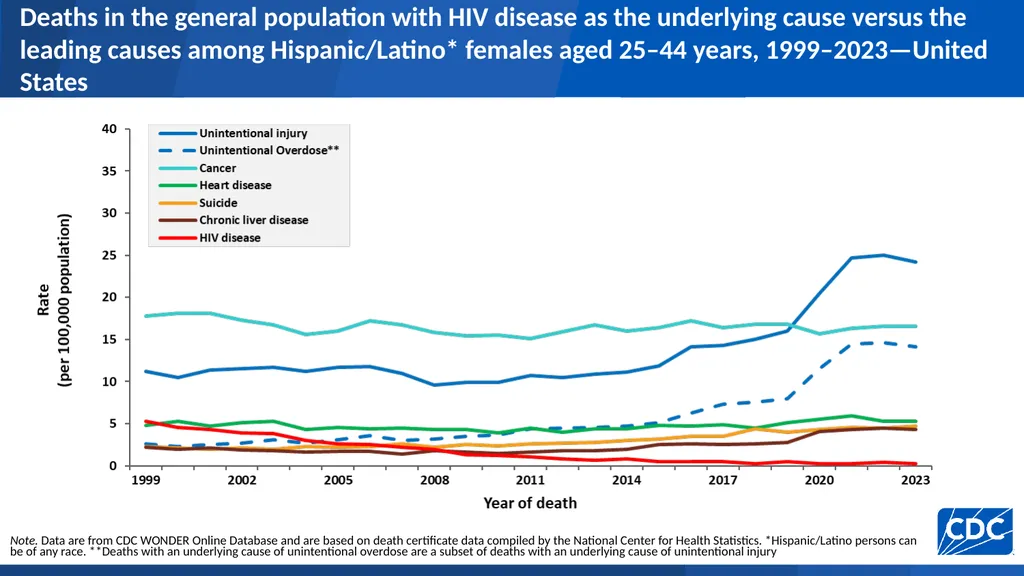
slide24. Deaths in the general population with HIV disease as the underlying cause versus the leading causes among Hispanic/Latino* females aged 25–44 years, 1999–2023—United States Note. Data are from CDC WONDER Online Database and are based on death certificate data compiled by the National Center for Health Statistics. *Hispanic/Latino persons can be of any race. **Deaths with an underlying cause of unintentional overdose are a subset of deaths with an underlying cause of unintentional injury<br>
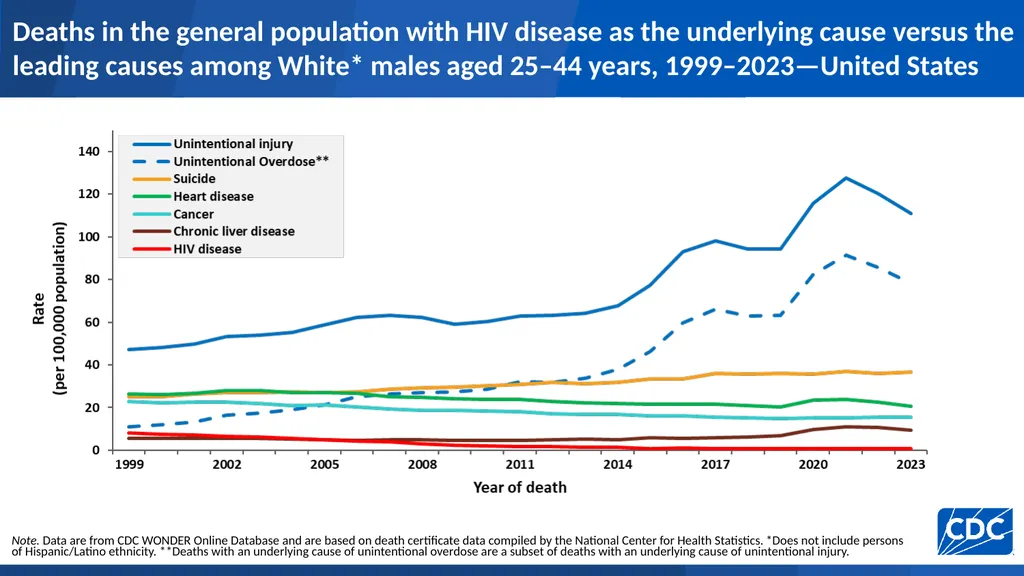
slide25. Deaths in the general population with HIV disease as the underlying cause versus the leading causes among White* males aged 25–44 years, 1999–2023—United States Note. Data are from CDC WONDER Online Database and are based on death certificate data compiled by the National Center for Health Statistics. *Does not include persons of Hispanic/Latino ethnicity. **Deaths with an underlying cause of unintentional overdose are a subset of deaths with an underlying cause of unintentional injury.<br>
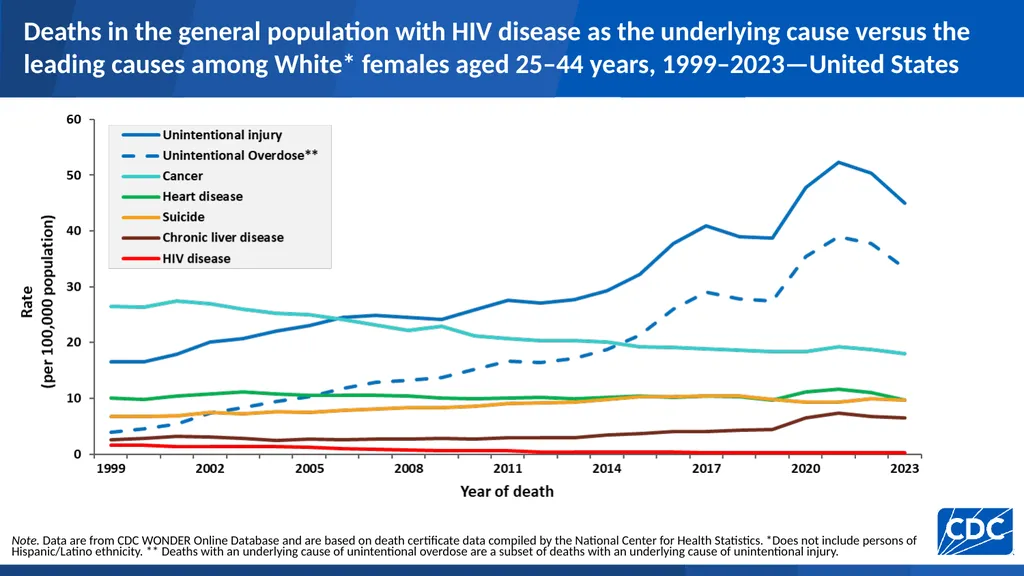
slide26. Deaths in the general population with HIV disease as the underlying cause versus the leading causes among White* females aged 25–44 years, 1999–2023—United States Note. Data are from CDC WONDER Online Database and are based on death certificate data compiled by the National Center for Health Statistics. *Does not include persons of Hispanic/Latino ethnicity. ** Deaths with an underlying cause of unintentional overdose are a subset of deaths with an underlying cause of unintentional injury.<br>
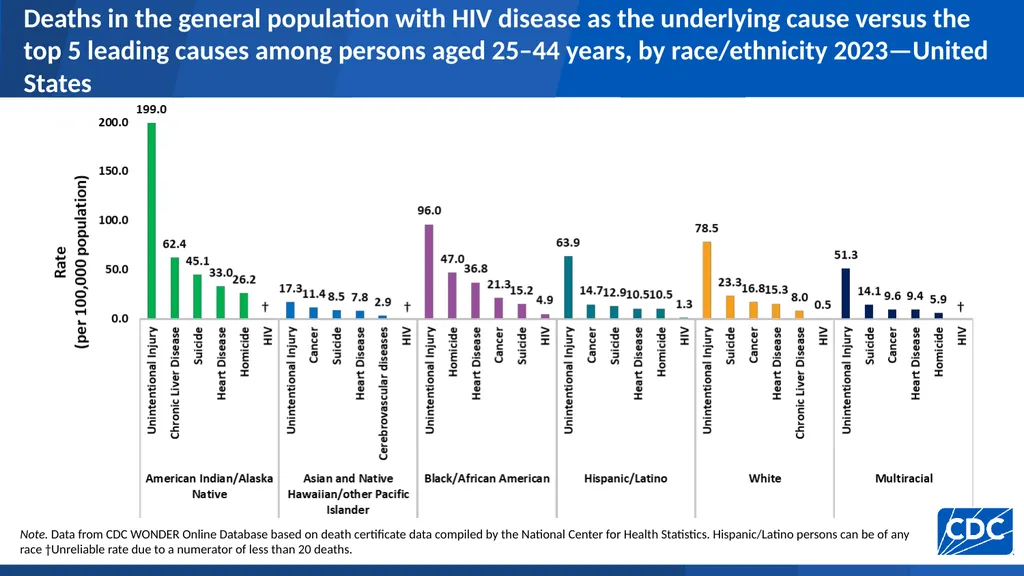
slide27. Deaths in the general population with HIV disease as the underlying cause versus the top 5 leading causes among persons aged 25–44 years, by race/ethnicity 2023—United States Note. Data from CDC WONDER Online Database based on death certificate data compiled by the National Center for Health Statistics. Hispanic/Latino persons can be of any race †Unreliable rate due to a numerator of less than 20 deaths.<br>
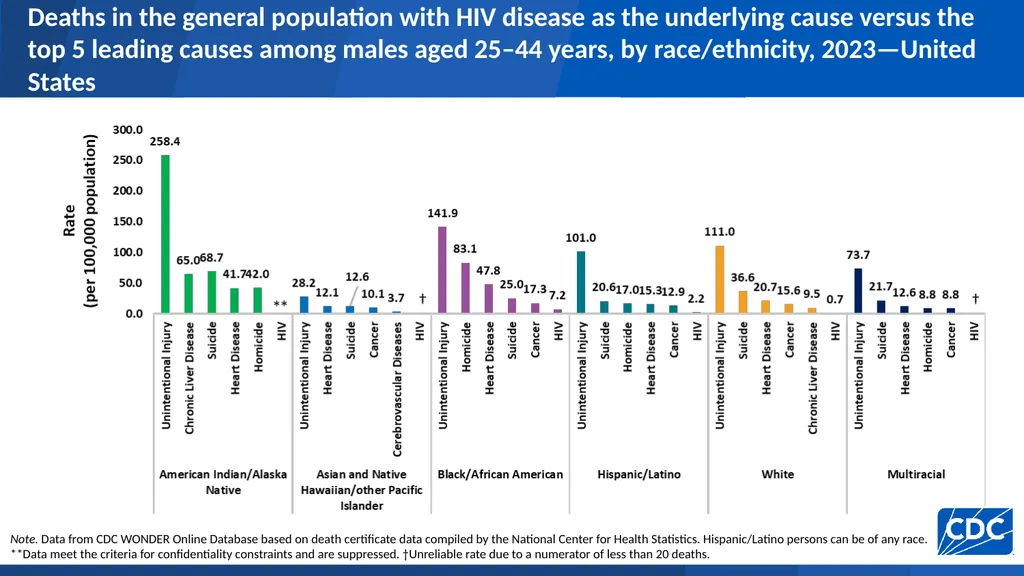
slide28. Deaths in the general population with HIV disease as the underlying cause versus the top 5 leading causes among males aged 25–44 years, by race/ethnicity, 2023—United States Note. Data from CDC WONDER Online Database based on death certificate data compiled by the National Center for Health Statistics. Hispanic/Latino persons can be of any race. **Data meet the criteria for confidentiality constraints and are suppressed. †Unreliable rate due to a numerator of less than 20 deaths.<br>
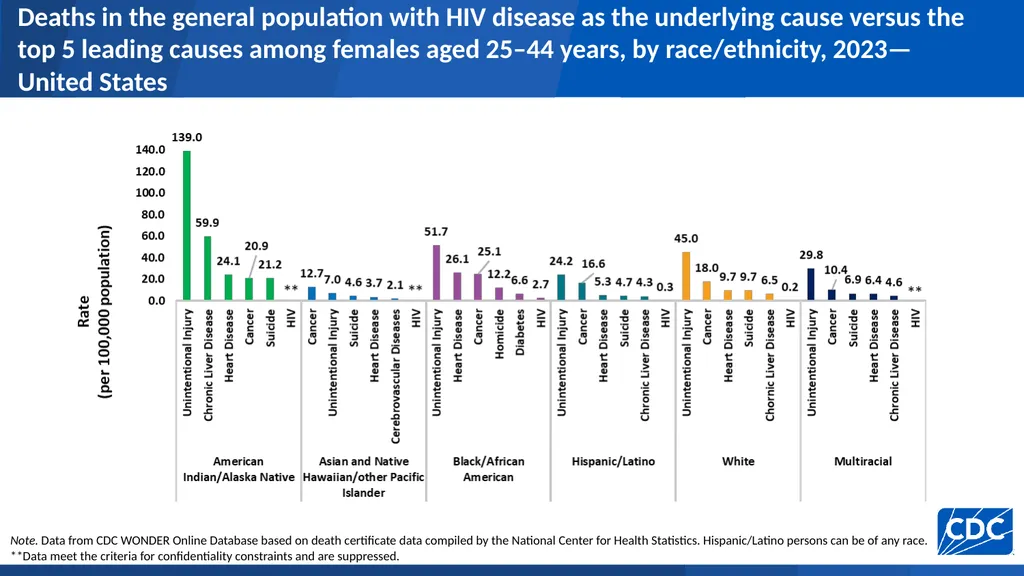
slide29. Deaths in the general population with HIV disease as the underlying cause versus the top 5 leading causes among females aged 25–44 years, by race/ethnicity, 2023—United States Note. Data from CDC WONDER Online Database based on death certificate data compiled by the National Center for Health Statistics. Hispanic/Latino persons can be of any race. **Data meet the criteria for confidentiality constraints and are suppressed.<br>
slide30. Leading causes of death among persons aged 25–44 years with diagnosed HIV<br>
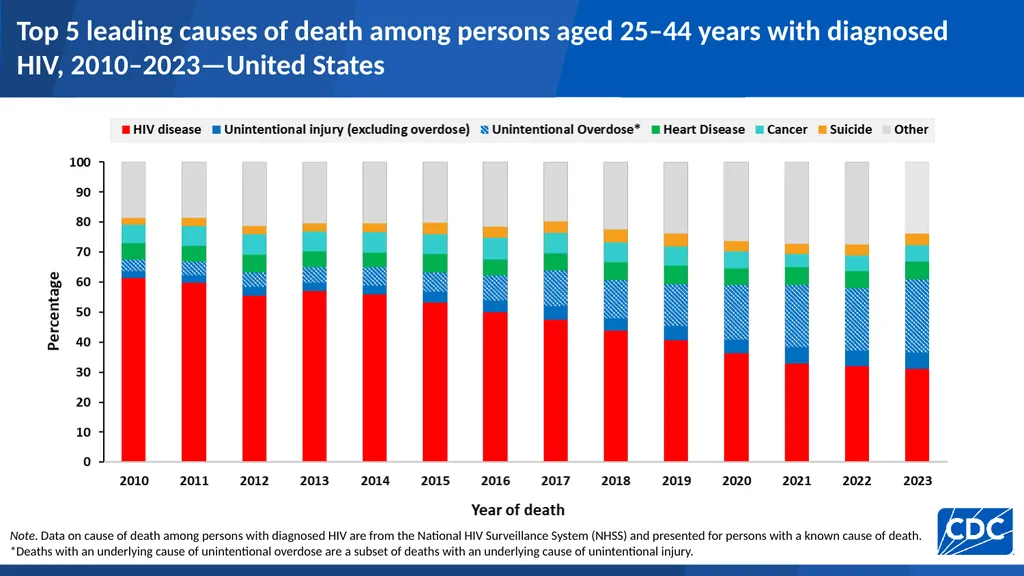
slide31. Top 5 leading causes of death among persons aged 25–44 years with diagnosed HIV, 2010–2023—United States Note. Data on cause of death among persons with diagnosed HIV are from the National HIV Surveillance System (NHSS) and presented for persons with a known cause of death.
*Deaths with an underlying cause of unintentional overdose are a subset of deaths with an underlying cause of unintentional injury.<br>
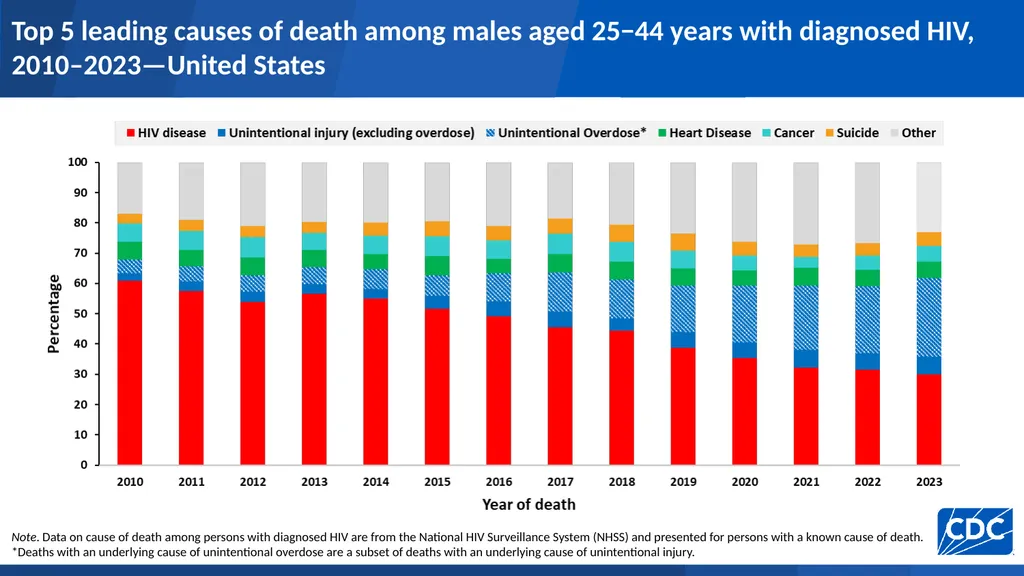
slide32. Top 5 leading causes of death among males aged 25−44 years with diagnosed HIV, 2010–2023—United States Note. Data on cause of death among persons with diagnosed HIV are from the National HIV Surveillance System (NHSS) and presented for persons with a known cause of death.
*Deaths with an underlying cause of unintentional overdose are a subset of deaths with an underlying cause of unintentional injury.<br>
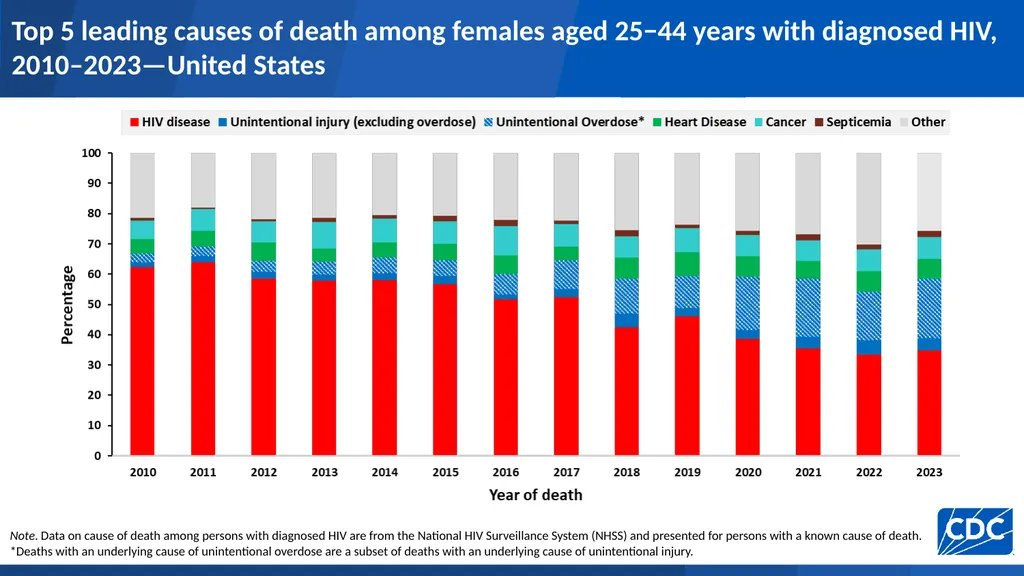
slide33. Top 5 leading causes of death among females aged 25−44 years with diagnosed HIV, 2010–2023—United States Note. Data on cause of death among persons with diagnosed HIV are from the National HIV Surveillance System (NHSS) and presented for persons with a known cause of death.
*Deaths with an underlying cause of unintentional overdose are a subset of deaths with an underlying cause of unintentional injury.<br>
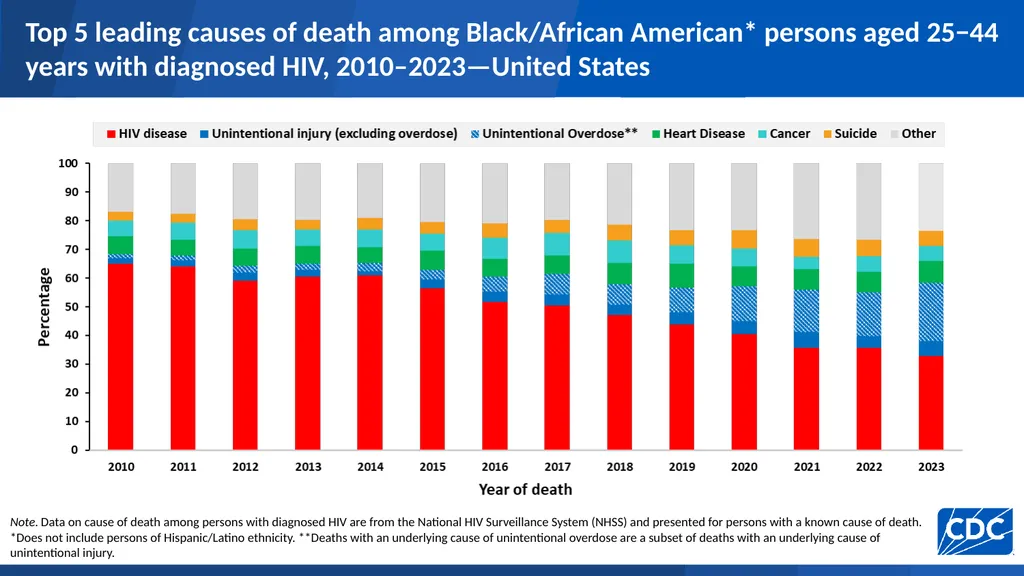
slide34. Top 5 leading causes of death among Black/African American* persons aged 25−44 years with diagnosed HIV, 2010–2023—United States Note. Data on cause of death among persons with diagnosed HIV are from the National HIV Surveillance System (NHSS) and presented for persons with a known cause of death.
*Does not include persons of Hispanic/Latino ethnicity. **Deaths with an underlying cause of unintentional overdose are a subset of deaths with an underlying cause of unintentional injury.<br>
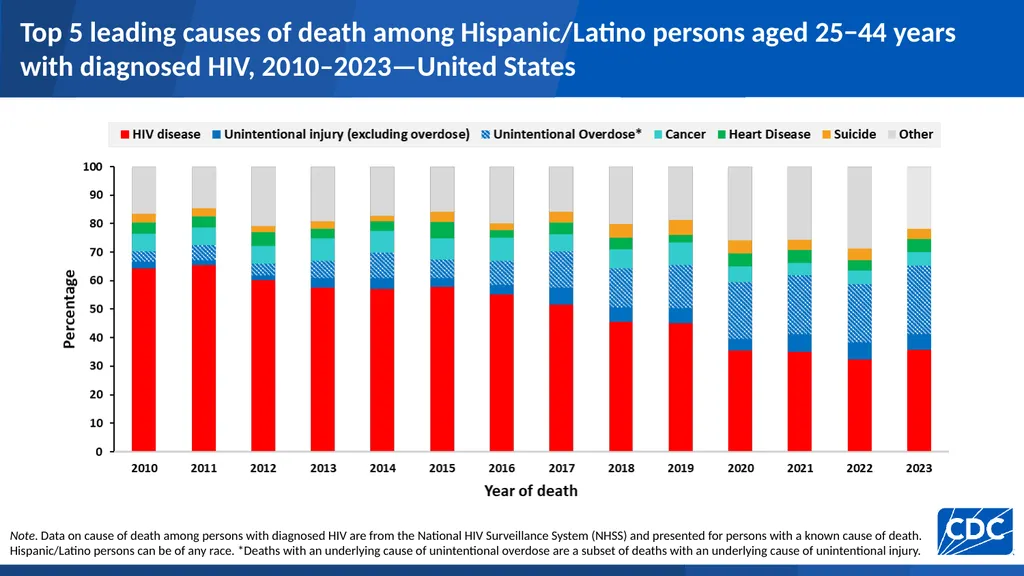
slide35. Top 5 leading causes of death among Hispanic/Latino persons aged 25−44 years with diagnosed HIV, 2010–2023—United States Note. Data on cause of death among persons with diagnosed HIV are from the National HIV Surveillance System (NHSS) and presented for persons with a known cause of death.
Hispanic/Latino persons can be of any race. *Deaths with an underlying cause of unintentional overdose are a subset of deaths with an underlying cause of unintentional injury.<br>
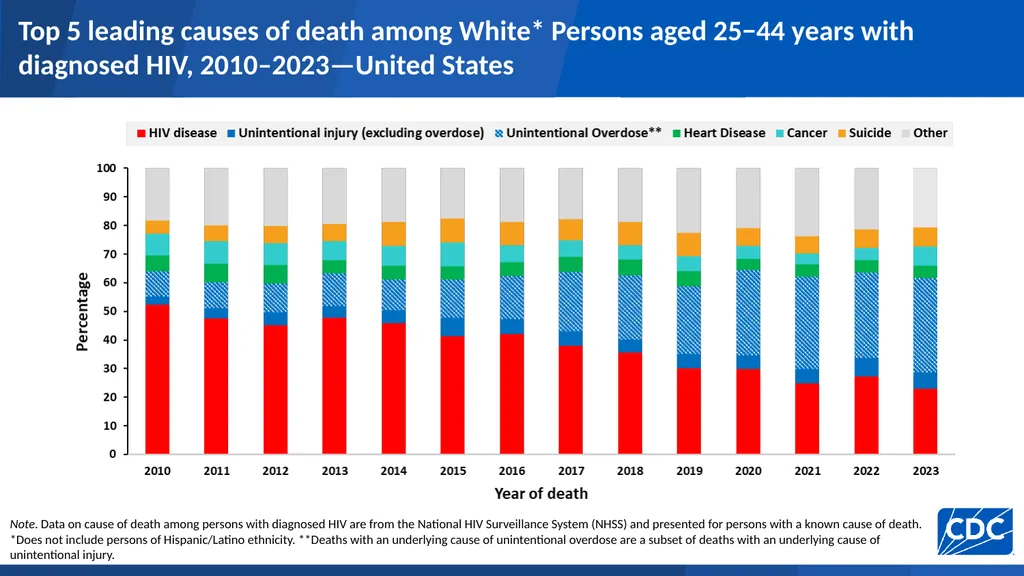
slide36. Top 5 leading causes of death among White* Persons aged 25−44 years with diagnosed HIV, 2010–2023—United States Note. Data on cause of death among persons with diagnosed HIV are from the National HIV Surveillance System (NHSS) and presented for persons with a known cause of death.
*Does not include persons of Hispanic/Latino ethnicity. **Deaths with an underlying cause of unintentional overdose are a subset of deaths with an underlying cause of unintentional injury.<br>
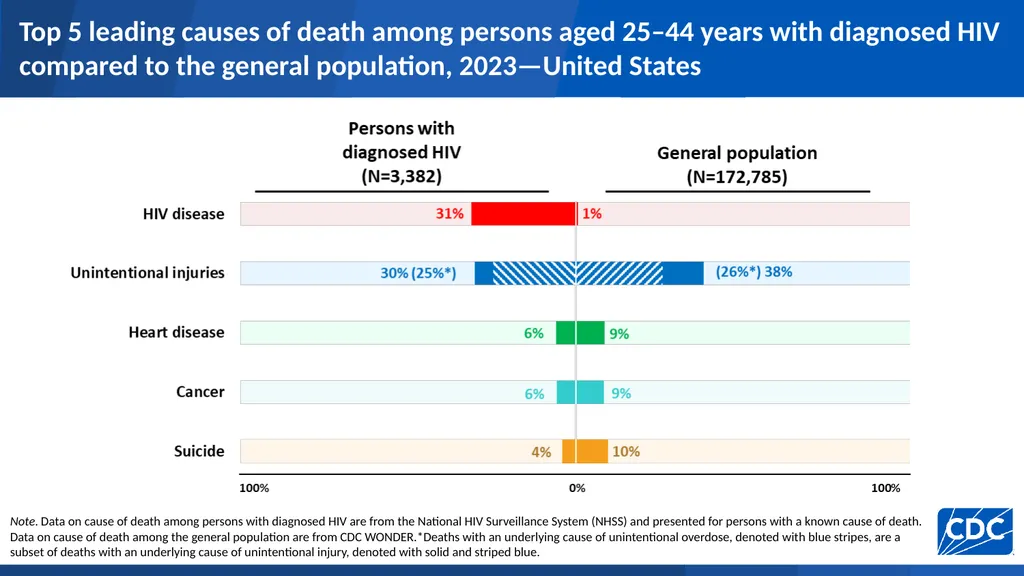
slide37. Top 5 leading causes of death among persons aged 25–44 years with diagnosed HIV compared to the general population, 2023—United States Note. Data on cause of death among persons with diagnosed HIV are from the National HIV Surveillance System (NHSS) and presented for persons with a known cause of death. Data on cause of death among the general population are from CDC WONDER.*Deaths with an underlying cause of unintentional overdose, denoted with blue stripes, are a subset of deaths with an underlying cause of unintentional injury, denoted with solid and striped blue.<br>
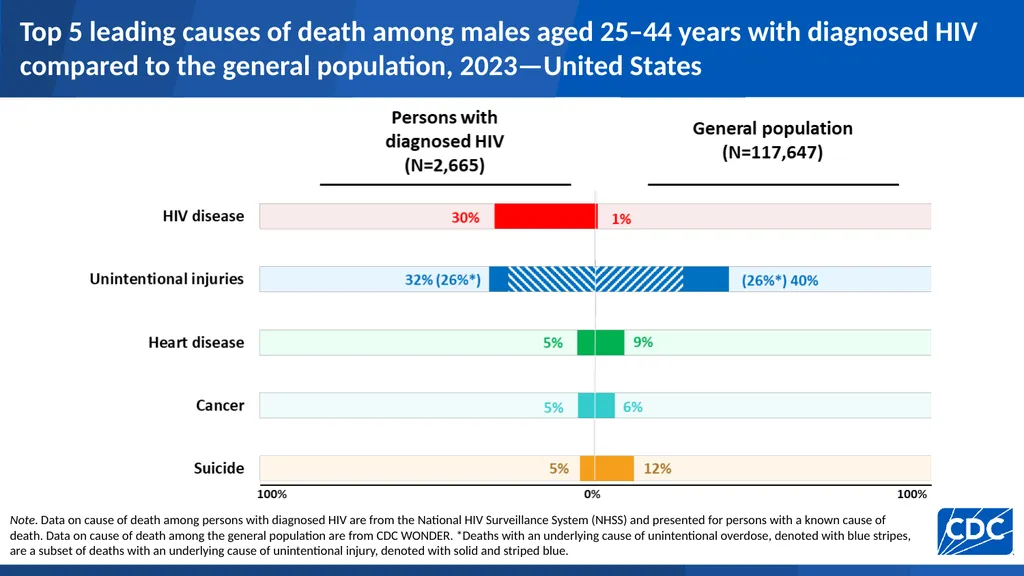
slide38. Top 5 leading causes of death among males aged 25–44 years with diagnosed HIV compared to the general population, 2023—United States Note. Data on cause of death among persons with diagnosed HIV are from the National HIV Surveillance System (NHSS) and presented for persons with a known cause of death. Data on cause of death among the general population are from CDC WONDER. *Deaths with an underlying cause of unintentional overdose, denoted with blue stripes, are a subset of deaths with an underlying cause of unintentional injury, denoted with solid and striped blue.<br>
slide39. Top 5 leading causes of death among females aged 25–44 years with diagnosed HIV compared to the general population, 2023—United States Note. Data on cause of death among persons with diagnosed HIV are from the National HIV Surveillance System (NHSS) and presented for persons with a known cause of death. Data on cause of death among the general population are from CDC WONDER. *Deaths with an underlying cause of unintentional overdose, denoted with blue stripes, are a subset of deaths with an underlying cause of unintentional injury, denoted with solid and striped blue.<br>
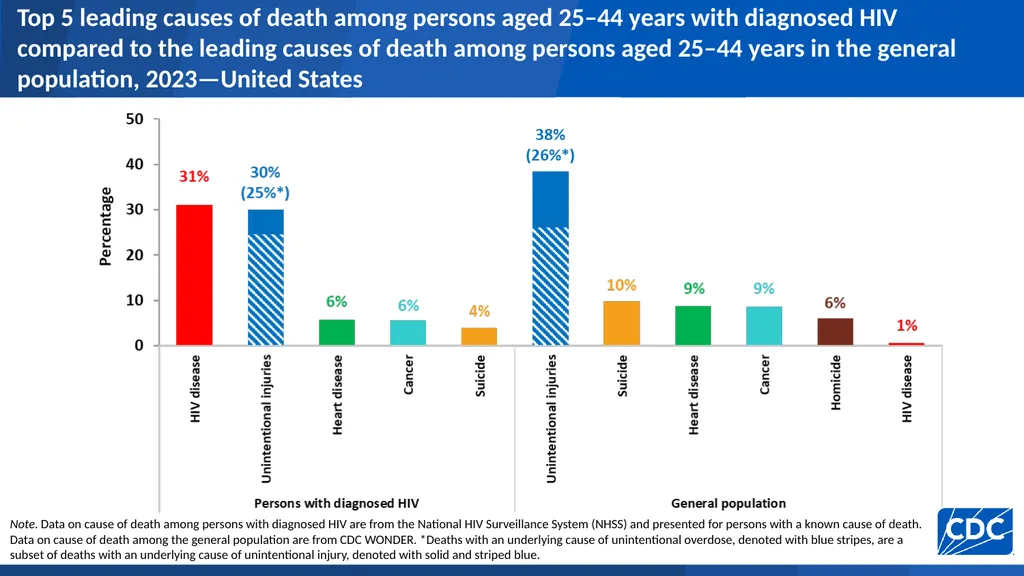
slide40. Top 5 leading causes of death among persons aged 25–44 years with diagnosed HIV compared to the leading causes of death among persons aged 25–44 years in the general population, 2023—United States Note. Data on cause of death among persons with diagnosed HIV are from the National HIV Surveillance System (NHSS) and presented for persons with a known cause of death. Data on cause of death among the general population are from CDC WONDER. *Deaths with an underlying cause of unintentional overdose, denoted with blue stripes, are a subset of deaths with an underlying cause of unintentional injury, denoted with solid and striped blue.<br>
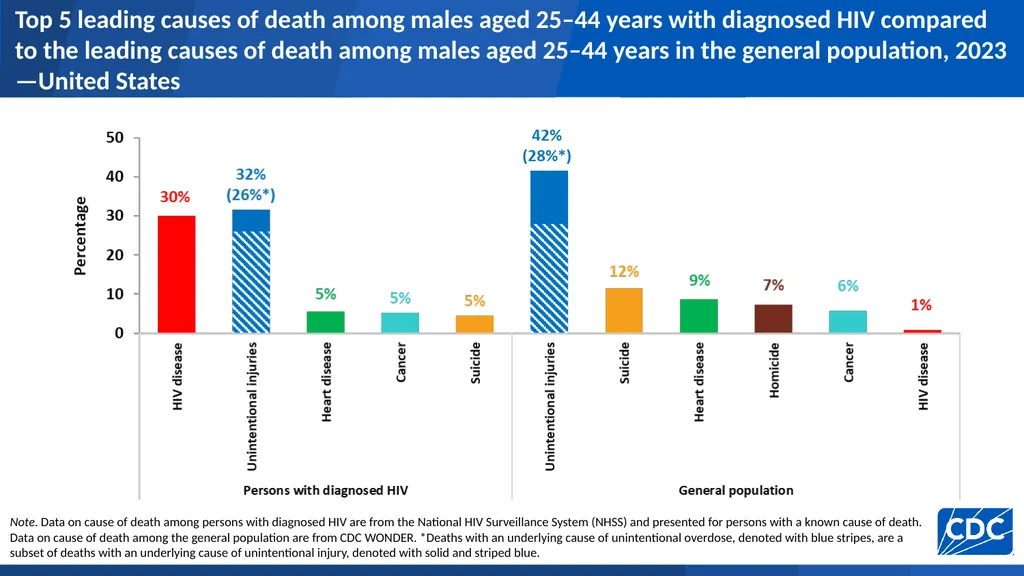
slide41. Top 5 leading causes of death among males aged 25–44 years with diagnosed HIV compared to the leading causes of death among males aged 25–44 years in the general population, 2023—United States Note. Data on cause of death among persons with diagnosed HIV are from the National HIV Surveillance System (NHSS) and presented for persons with a known cause of death. Data on cause of death among the general population are from CDC WONDER. *Deaths with an underlying cause of unintentional overdose, denoted with blue stripes, are a subset of deaths with an underlying cause of unintentional injury, denoted with solid and striped blue.<br>
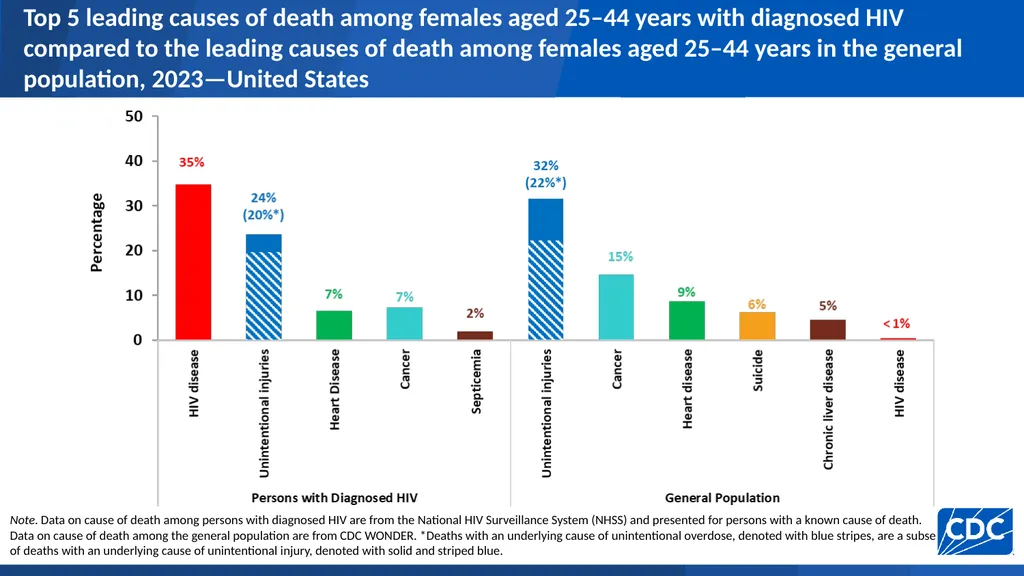
slide42. Top 5 leading causes of death among females aged 25–44 years with diagnosed HIV compared to the leading causes of death among females aged 25–44 years in the general population, 2023—United States Note. Data on cause of death among persons with diagnosed HIV are from the National HIV Surveillance System (NHSS) and presented for persons with a known cause of death. Data on cause of death among the general population are from CDC WONDER. *Deaths with an underlying cause of unintentional overdose, denoted with blue stripes, are a subset of deaths with an underlying cause of unintentional injury, denoted with solid and striped blue.<br>
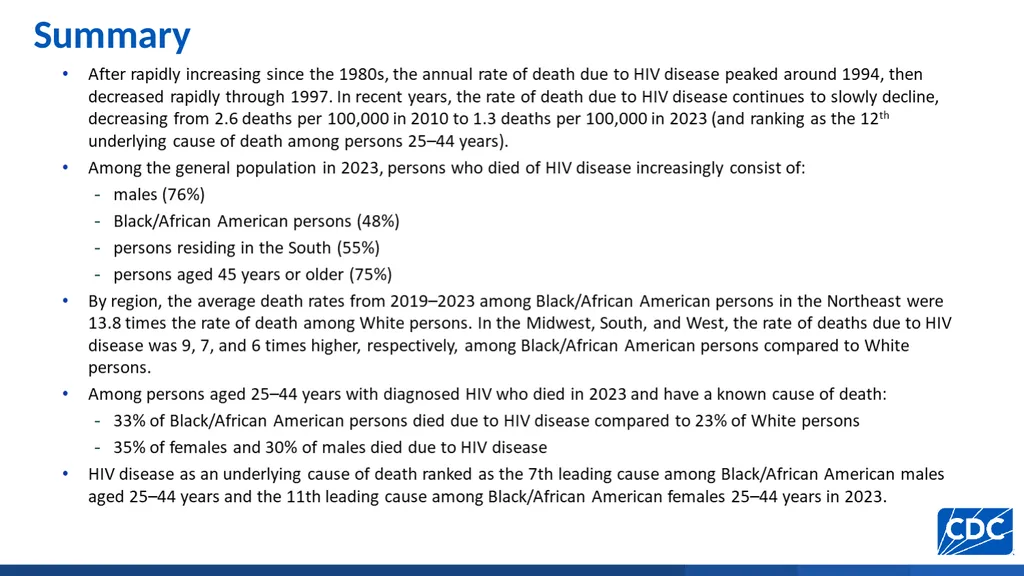
slide43. Summary<br>
slide2. Data Sources and Technical Notes<br>
slide3. Deaths in the general population with HIV disease as the underlying cause of death, 1987−2023—United States Note. Data from CDC WONDER Online Database based on death certificate data compiled by the National Center for Health Statistics.<br>
slide4. Age-adjusted rates of death in the general population with HIV disease as the underlying cause, 1987−2023—United States Note. Data from CDC WONDER Online Database based on death certificate data compiled by the National Center for Health Statistics.<br>
slide5. Age-adjusted rates of death in the general population with HIV disease as the underlying cause, by sex, 1987−2023—United States Note. Data from CDC WONDER Online Database based on death certificate data compiled by the National Center for Health Statistics.<br>
slide6. Age-adjusted rates and percentage distribution of deaths in the general population with HIV disease as the underlying cause by sex, 1987–2023—United States Note. Data from CDC WONDER Online Database based on death certificate data compiled by the National Center for Health Statistics.<br>
slide7. Deaths in the general population with HIV disease as the underlying cause, by age group, 1987–2023—United States Note. Data from CDC WONDER Online Database based on death certificate data compiled by the National Center for Health Statistics.<br>
slide8. Age-adjusted rates and percentage distribution of deaths in the general population with HIV disease as the underlying cause by age group, 1987−2023—United States Note. Data from CDC WONDER Online Database based on death certificate data compiled by the National Center for Health Statistics.<br>
slide9. Age-adjusted rates of death in the general population with HIV disease as the underlying cause, by state, 2023—United States Note. Data are from CDC WONDER Online Database and are based on death certificate data compiled by the National Center for Health Statistics.
Death rates are not shown when unreliable (rate is calculated with a numerator of 20 or less) or suppressed (the data meet the criteria for confidentiality constraints).<br>
slide10. Age-adjusted* rates† of death (any cause) among persons with diagnosed HIV by state, 2023—United States Note. Data from the National HIV Surveillance System. *Standard: age distribution of 2000 US population. †Per 1,000 persons living with diagnosed HIV.<br>
slide11. Age-adjusted rates of death in the general population with HIV disease as the underlying cause, by region, 1987–2023—United States Note. Data from CDC WONDER Online Database based on death certificate data compiled by the National Center for Health Statistics.<br>
slide12. Age-adjusted rates and percentage distribution of deaths in the general population with HIV disease as the underlying cause by region, 1987−2023—United States Note. Data from CDC WONDER Online Database based on death certificate data compiled by the National Center for Health Statistics.<br>
slide13. Age-adjusted rates of death in the general population with HIV disease as the underlying cause, by race/ethnicity, 1990–2023—United States Note. Data are from CDC WONDER Online Database and are based on death certificate data compiled by the National Center for Health Statistics. Hispanic/Latino persons can be of any race.<br>
slide14. Age-adjusted rates and percentage distribution of deaths in the general population with HIV disease as the underlying cause by race/ethnicity, 1990−2023—United States Note. Data are from CDC WONDER Online Database and are based on death certificate data compiled by the National Center for Health Statistics. Hispanic/Latino persons can be of any race.<br>
slide15. Average annual age-adjusted rates of death in the general population with HIV disease as the underlying cause, by sex and race/ethnicity, 2019−2023—United States Note. Data are from CDC WONDER Online Database and are based on death certificate data compiled by the National Center for Health Statistics. Hispanic/Latino persons can be of any race.† Unreliable rate due to a numerator of less than 20 deaths.<br>
slide16. Average annual age-adjusted rates of death among Black/African American, Hispanic/Latino, and White persons in the general population with HIV disease as the underlying cause by region, 2019−2023—United States Note. Data are from CDC WONDER Online Database and are based on death certificate data compiled by the National Center for Health Statistics. Hispanic/Latino persons can be of any race.<br>
slide17. Trends in annual rates of death among persons aged 25–44 years<br>
slide18. Deaths in the general population with HIV disease as the underlying cause versus the leading causes among persons aged 25–44 years, 1987–2023—United States Note. Data are from CDC WONDER Online Database and are based on death certificate data compiled by the National Center for Health Statistics. *Deaths with an underlying cause of unintentional overdose are a subset of deaths with an underlying cause of unintentional injury.<br>
slide19. Deaths in the general population with HIV disease as the underlying cause versus the leading causes among males aged 25–44 years, 1987–2023—United States Note. Data are from CDC WONDER Online Database and are based on death certificate data compiled by the National Center for Health Statistics. *Deaths with an underlying cause of unintentional overdose are a subset of deaths with an underlying cause of unintentional injury.<br>
slide20. Deaths in the general population with HIV disease as the underlying cause versus the leading causes among females aged 25–44 years, 1987–2023—United States Note. Data are from CDC WONDER Online Database and are based on death certificate data compiled by the National Center for Health Statistics. *Deaths with an underlying cause of unintentional overdose are a subset of deaths with an underlying cause of unintentional injury.<br>
slide21. Deaths in the general population with HIV disease as the underlying cause versus the leading causes among Black/African American* males aged 25–44 years, 1999–2023—United States Note. Data are from CDC WONDER Online Database and are based on death certificate data compiled by the National Center for Health Statistics. *Does not include persons of Hispanic/Latino ethnicity. **Deaths with an underlying cause of unintentional overdose are a subset of deaths with an underlying cause of unintentional injury.<br>
slide22. Deaths in the general population with HIV disease as the underlying cause versus the leading causes among Black/African American* females aged 25–44 years, 1999–2023—United States Note. Data are from CDC WONDER Online Database and are based on death certificate data compiled by the National Center for Health Statistics. *Does not include persons of Hispanic/Latino ethnicity. **Deaths with an underlying cause of unintentional overdose are a subset of deaths with an underlying cause of unintentional injury.<br>
slide23. Deaths in the general population with HIV disease as the underlying cause versus the leading causes among Hispanic/Latino* males aged 25–44 years, 1999–2023—United States Note. Data are from CDC WONDER Online Database and are based on death certificate data compiled by the National Center for Health Statistics. *Hispanic/Latino persons can be of any race. **Deaths with an underlying cause of unintentional overdose are a subset of deaths with an underlying cause of unintentional injury.<br>
slide24. Deaths in the general population with HIV disease as the underlying cause versus the leading causes among Hispanic/Latino* females aged 25–44 years, 1999–2023—United States Note. Data are from CDC WONDER Online Database and are based on death certificate data compiled by the National Center for Health Statistics. *Hispanic/Latino persons can be of any race. **Deaths with an underlying cause of unintentional overdose are a subset of deaths with an underlying cause of unintentional injury<br>
slide25. Deaths in the general population with HIV disease as the underlying cause versus the leading causes among White* males aged 25–44 years, 1999–2023—United States Note. Data are from CDC WONDER Online Database and are based on death certificate data compiled by the National Center for Health Statistics. *Does not include persons of Hispanic/Latino ethnicity. **Deaths with an underlying cause of unintentional overdose are a subset of deaths with an underlying cause of unintentional injury.<br>
slide26. Deaths in the general population with HIV disease as the underlying cause versus the leading causes among White* females aged 25–44 years, 1999–2023—United States Note. Data are from CDC WONDER Online Database and are based on death certificate data compiled by the National Center for Health Statistics. *Does not include persons of Hispanic/Latino ethnicity. ** Deaths with an underlying cause of unintentional overdose are a subset of deaths with an underlying cause of unintentional injury.<br>
slide27. Deaths in the general population with HIV disease as the underlying cause versus the top 5 leading causes among persons aged 25–44 years, by race/ethnicity 2023—United States Note. Data from CDC WONDER Online Database based on death certificate data compiled by the National Center for Health Statistics. Hispanic/Latino persons can be of any race †Unreliable rate due to a numerator of less than 20 deaths.<br>
slide28. Deaths in the general population with HIV disease as the underlying cause versus the top 5 leading causes among males aged 25–44 years, by race/ethnicity, 2023—United States Note. Data from CDC WONDER Online Database based on death certificate data compiled by the National Center for Health Statistics. Hispanic/Latino persons can be of any race. **Data meet the criteria for confidentiality constraints and are suppressed. †Unreliable rate due to a numerator of less than 20 deaths.<br>
slide29. Deaths in the general population with HIV disease as the underlying cause versus the top 5 leading causes among females aged 25–44 years, by race/ethnicity, 2023—United States Note. Data from CDC WONDER Online Database based on death certificate data compiled by the National Center for Health Statistics. Hispanic/Latino persons can be of any race. **Data meet the criteria for confidentiality constraints and are suppressed.<br>
slide30. Leading causes of death among persons aged 25–44 years with diagnosed HIV<br>
slide31. Top 5 leading causes of death among persons aged 25–44 years with diagnosed HIV, 2010–2023—United States Note. Data on cause of death among persons with diagnosed HIV are from the National HIV Surveillance System (NHSS) and presented for persons with a known cause of death.
*Deaths with an underlying cause of unintentional overdose are a subset of deaths with an underlying cause of unintentional injury.<br>
slide32. Top 5 leading causes of death among males aged 25−44 years with diagnosed HIV, 2010–2023—United States Note. Data on cause of death among persons with diagnosed HIV are from the National HIV Surveillance System (NHSS) and presented for persons with a known cause of death.
*Deaths with an underlying cause of unintentional overdose are a subset of deaths with an underlying cause of unintentional injury.<br>
slide33. Top 5 leading causes of death among females aged 25−44 years with diagnosed HIV, 2010–2023—United States Note. Data on cause of death among persons with diagnosed HIV are from the National HIV Surveillance System (NHSS) and presented for persons with a known cause of death.
*Deaths with an underlying cause of unintentional overdose are a subset of deaths with an underlying cause of unintentional injury.<br>
slide34. Top 5 leading causes of death among Black/African American* persons aged 25−44 years with diagnosed HIV, 2010–2023—United States Note. Data on cause of death among persons with diagnosed HIV are from the National HIV Surveillance System (NHSS) and presented for persons with a known cause of death.
*Does not include persons of Hispanic/Latino ethnicity. **Deaths with an underlying cause of unintentional overdose are a subset of deaths with an underlying cause of unintentional injury.<br>
slide35. Top 5 leading causes of death among Hispanic/Latino persons aged 25−44 years with diagnosed HIV, 2010–2023—United States Note. Data on cause of death among persons with diagnosed HIV are from the National HIV Surveillance System (NHSS) and presented for persons with a known cause of death.
Hispanic/Latino persons can be of any race. *Deaths with an underlying cause of unintentional overdose are a subset of deaths with an underlying cause of unintentional injury.<br>
slide36. Top 5 leading causes of death among White* Persons aged 25−44 years with diagnosed HIV, 2010–2023—United States Note. Data on cause of death among persons with diagnosed HIV are from the National HIV Surveillance System (NHSS) and presented for persons with a known cause of death.
*Does not include persons of Hispanic/Latino ethnicity. **Deaths with an underlying cause of unintentional overdose are a subset of deaths with an underlying cause of unintentional injury.<br>
slide37. Top 5 leading causes of death among persons aged 25–44 years with diagnosed HIV compared to the general population, 2023—United States Note. Data on cause of death among persons with diagnosed HIV are from the National HIV Surveillance System (NHSS) and presented for persons with a known cause of death. Data on cause of death among the general population are from CDC WONDER.*Deaths with an underlying cause of unintentional overdose, denoted with blue stripes, are a subset of deaths with an underlying cause of unintentional injury, denoted with solid and striped blue.<br>
slide38. Top 5 leading causes of death among males aged 25–44 years with diagnosed HIV compared to the general population, 2023—United States Note. Data on cause of death among persons with diagnosed HIV are from the National HIV Surveillance System (NHSS) and presented for persons with a known cause of death. Data on cause of death among the general population are from CDC WONDER. *Deaths with an underlying cause of unintentional overdose, denoted with blue stripes, are a subset of deaths with an underlying cause of unintentional injury, denoted with solid and striped blue.<br>
slide39. Top 5 leading causes of death among females aged 25–44 years with diagnosed HIV compared to the general population, 2023—United States Note. Data on cause of death among persons with diagnosed HIV are from the National HIV Surveillance System (NHSS) and presented for persons with a known cause of death. Data on cause of death among the general population are from CDC WONDER. *Deaths with an underlying cause of unintentional overdose, denoted with blue stripes, are a subset of deaths with an underlying cause of unintentional injury, denoted with solid and striped blue.<br>
slide40. Top 5 leading causes of death among persons aged 25–44 years with diagnosed HIV compared to the leading causes of death among persons aged 25–44 years in the general population, 2023—United States Note. Data on cause of death among persons with diagnosed HIV are from the National HIV Surveillance System (NHSS) and presented for persons with a known cause of death. Data on cause of death among the general population are from CDC WONDER. *Deaths with an underlying cause of unintentional overdose, denoted with blue stripes, are a subset of deaths with an underlying cause of unintentional injury, denoted with solid and striped blue.<br>
slide41. Top 5 leading causes of death among males aged 25–44 years with diagnosed HIV compared to the leading causes of death among males aged 25–44 years in the general population, 2023—United States Note. Data on cause of death among persons with diagnosed HIV are from the National HIV Surveillance System (NHSS) and presented for persons with a known cause of death. Data on cause of death among the general population are from CDC WONDER. *Deaths with an underlying cause of unintentional overdose, denoted with blue stripes, are a subset of deaths with an underlying cause of unintentional injury, denoted with solid and striped blue.<br>
slide42. Top 5 leading causes of death among females aged 25–44 years with diagnosed HIV compared to the leading causes of death among females aged 25–44 years in the general population, 2023—United States Note. Data on cause of death among persons with diagnosed HIV are from the National HIV Surveillance System (NHSS) and presented for persons with a known cause of death. Data on cause of death among the general population are from CDC WONDER. *Deaths with an underlying cause of unintentional overdose, denoted with blue stripes, are a subset of deaths with an underlying cause of unintentional injury, denoted with solid and striped blue.<br>
slide43. Summary<br>