Understanding the Expense Prediction Bias Chuck Howard Sauder School of Business University of British Columbia David Hardisty Sauder School of Business University of British Columbia Melissa Knoll Consumer Financial Protection Bureau US
"Understanding the Expense Prediction Bias Chuck" is the property of its rightful owner. Permission is granted to
download and print the materials on this website for personal, non-commercial use only, and to display it
on your personal computer provided you do not modify the materials and that you retain all copyright
notices contained in the materials. By downloading content from our website, you accept the terms of this
agreement.
Presentation Transcript
01
Understanding the Expense Prediction Bias Chuck Howard
Sauder School of Business
University of British Columbia
David Hardisty
Sauder School of Business
University of British Columbia
Melissa Knoll
Consumer Financial Protection Bureau
US Federal Government
Abigail Sussman
Booth School of Business
University of Chicago<br>
02
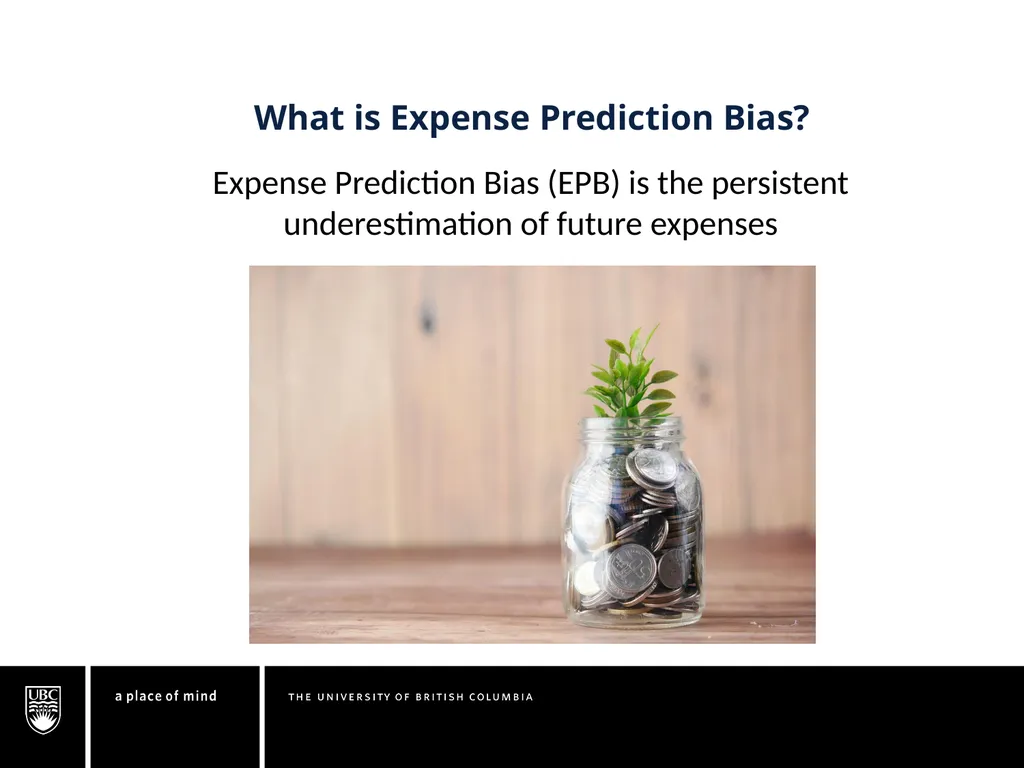
What is Expense Prediction Bias? Expense Prediction Bias (EPB) is the persistent underestimation of future expenses<br>
03
Background – Expense Misprediction Previous research on expense misprediction has shown that people tend to under-predict their future expenses
Ulkumen, Thomas & Morowitz (2008): monthly (vs. yearly) budget forecasts are much lower than recorded expenses
Peetz & Buehler (2009): people underestimate future spending as a result of their savings goals
Sussman & Alter (2012): consumers underestimate their spending on exceptional expenses due to narrow categorization<br>
04
Research Questions Why is the bias important?
How big is it?
Does it predict negative financial outcomes?
How can we neutralize it?
If the answer to the questions above is “yes” how can make this thing go away?<br>
05
Study 1 - Overview How big is the expense prediction bias in an adult sample?
Is there a corresponding income bias?<br>
06
Participants Participants were adult Americans recruited
online via Amazon Mechanical Turk
Mean age = 34
Strong majority report having at least some college education (mode response is a 4 year degree)
Mode income is $30,000 - $39,999<br>
07
Study 1 – Method 200 participants were asked to recall and predict their expenses and income for last week and next week
EPB score = recalled expenses minus predicted expenses<br>
08
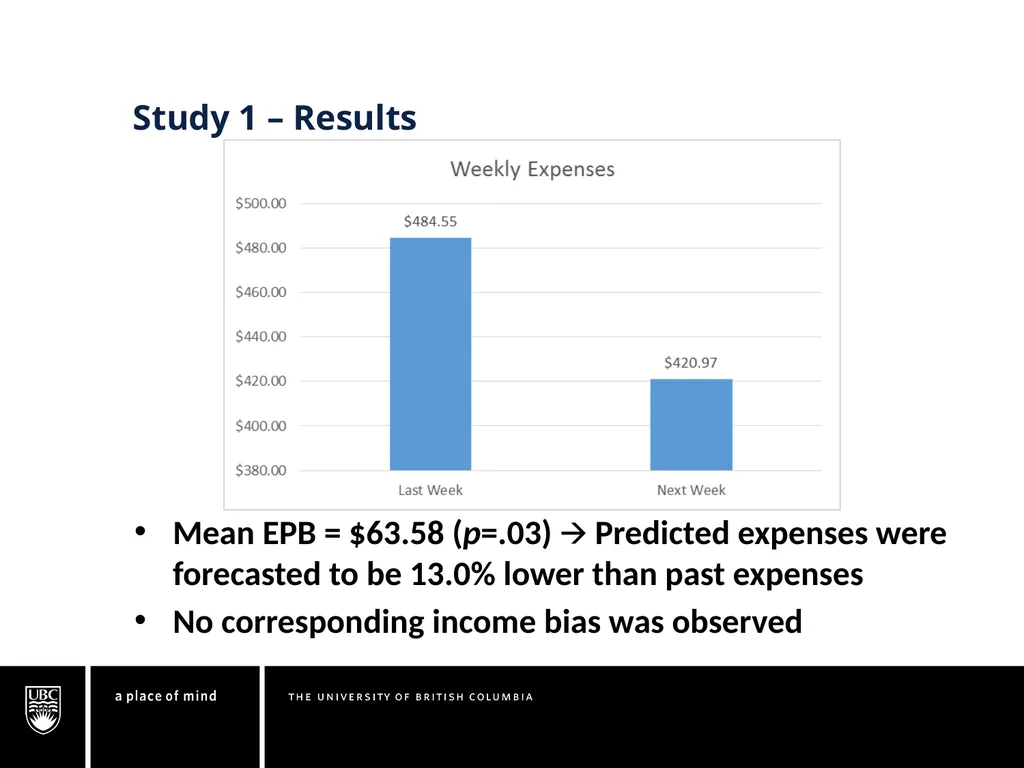
Study 1 – Results Mean EPB = $63.58 (p=.03) 🡪 Predicted expenses were forecasted to be 13.0% lower than past expenses
No corresponding income bias was observed<br>
09
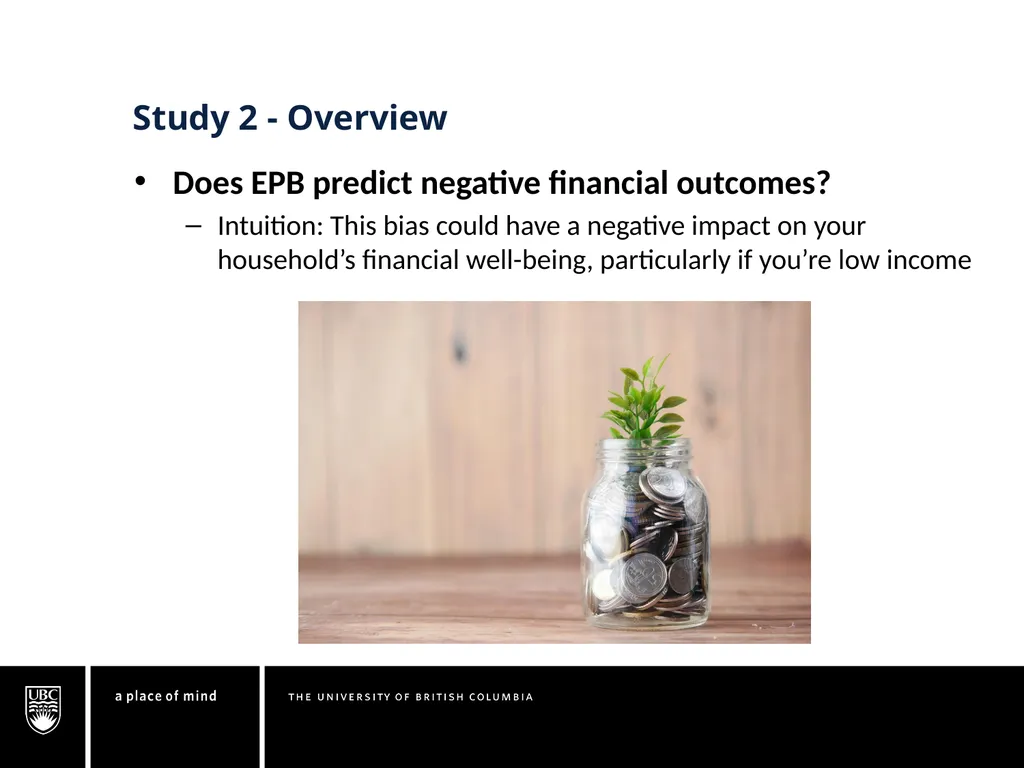
Study 2 - Overview Does EPB predict negative financial outcomes?
Intuition: This bias could have a negative impact on your household’s financial well-being, particularly if you’re low income<br>
10
Study 2 - Overview Does considering past expenses neutralize EPB?
Planning fallacy: The underestimation of the time it will take to complete a future task, despite the knowledge that previous tasks have generally taken longer than planned (Kahneman & Tversky, 1979; Buehler, Griffin & Peetz, 2010)
People focus on plan-based scenarios rather than on relevant past experiences while generating their predictions (Buehler, Griffin & Ross, 1994)<br>
11
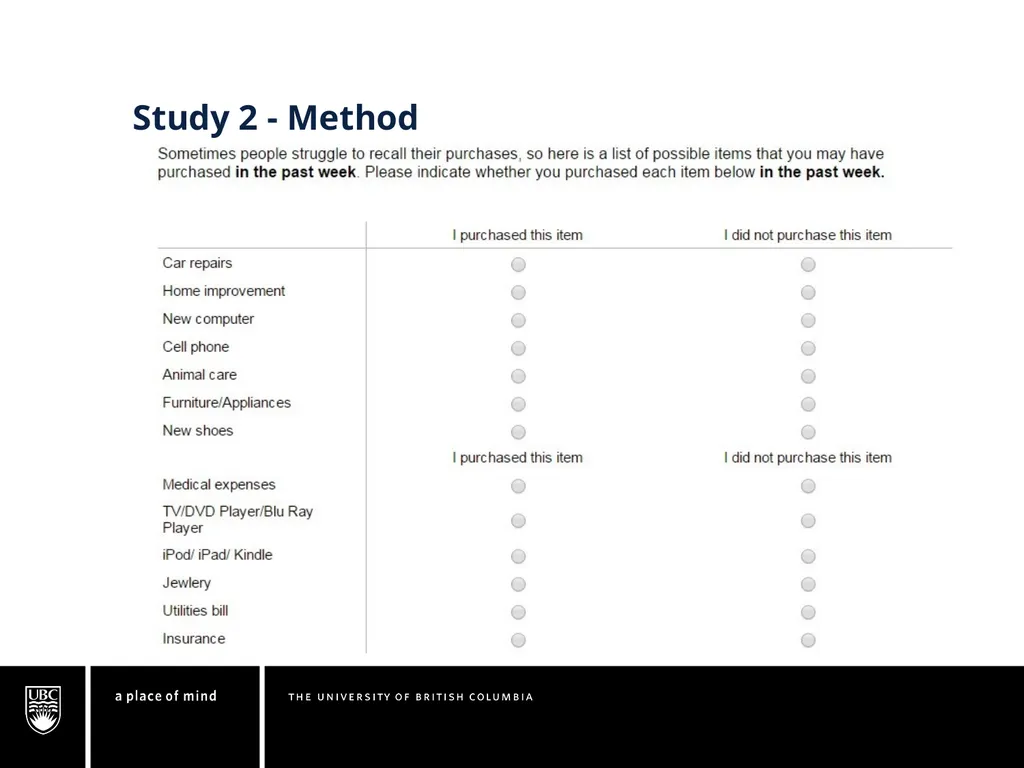
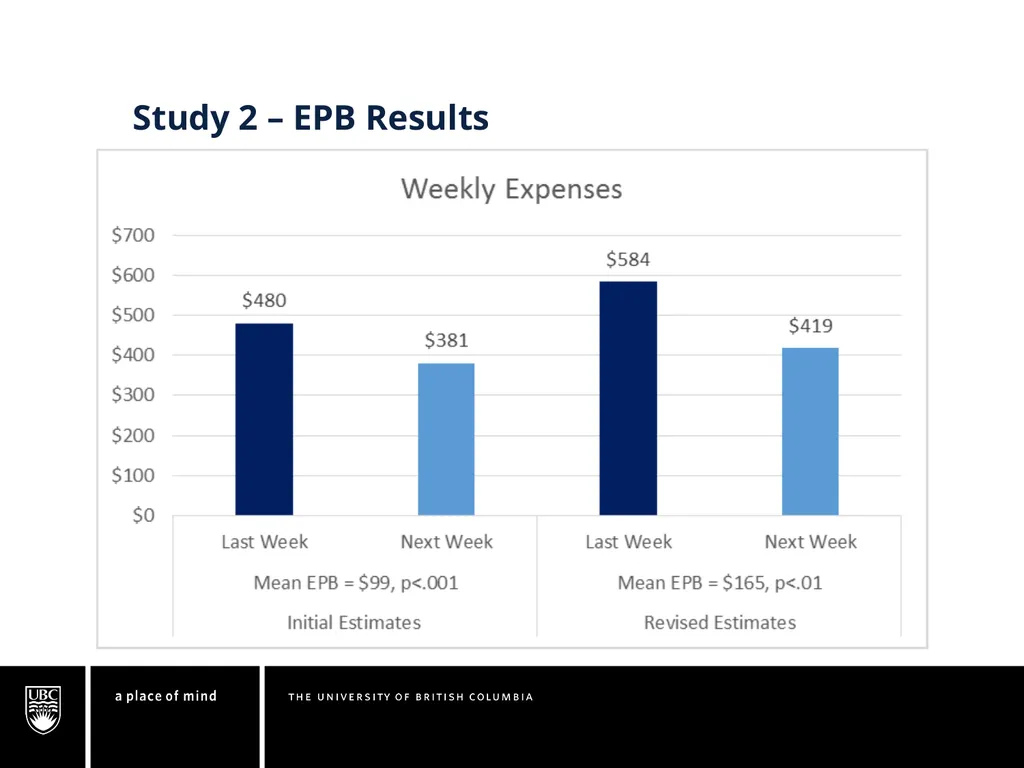
Study 2 - Method 1514 participants recalled and predicted their expenses, then they were provided with a list of common expenses to consider and given the option to revise their initial estimates
Participants were also asked to report their experience with payday loans<br>
12
Study 2 - Method<br>
13
Study 2 – EPB Results<br>
14
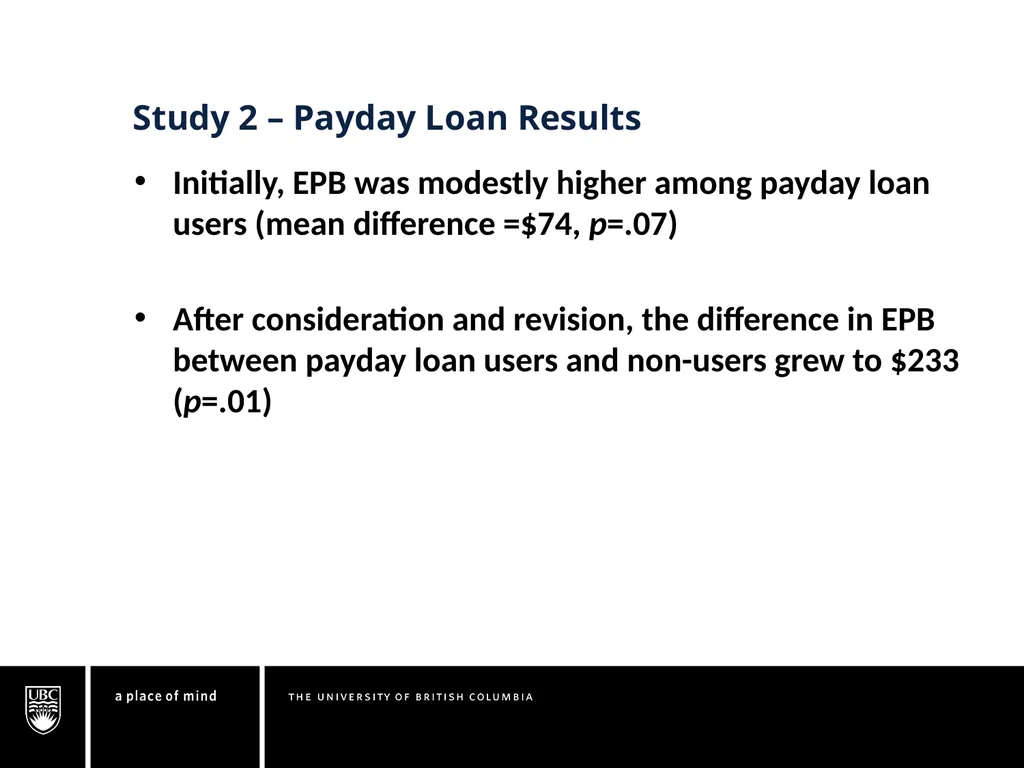
Study 2 – Payday Loan Results Initially, EPB was modestly higher among payday loan users (mean difference =$74, p=.07)
After consideration and revision, the difference in EPB between payday loan users and non-users grew to $233 (p=.01)<br>
15
Study 3 – Overview Is EPB impacted by expense categorization?
The planning fallacy can be ameliorated when people “unpack” multifaceted tasks into subcomponents (Kruger & Evans, 2004)<br>
16
Study 3 – Overview Are people underestimating the dollar amount of future expenses, and/or the number of future expenses they will encounter?<br>
17
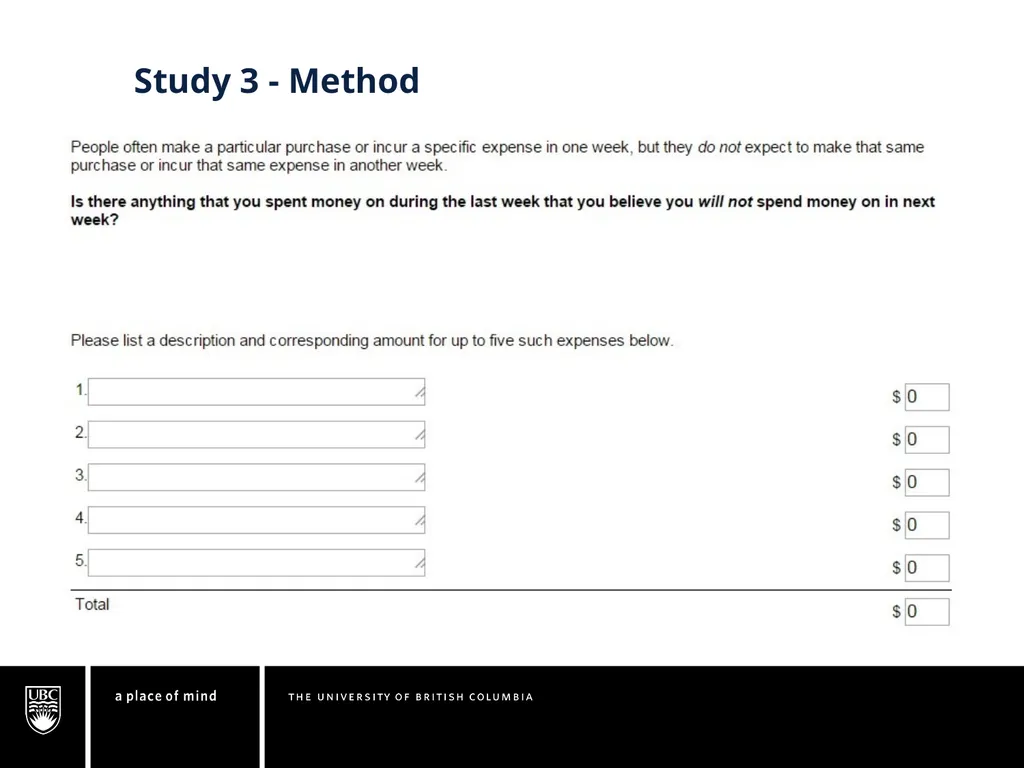
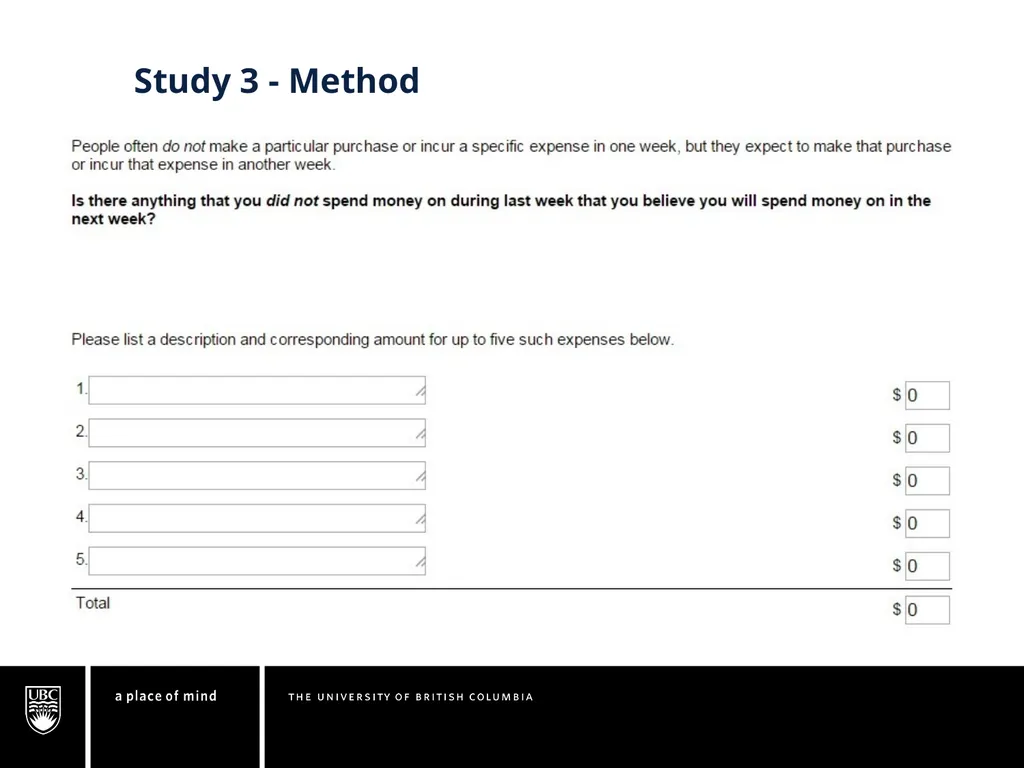
Study 3 - Method 405 participants were randomly assigned to recall and predict expenses in either a single general expense category, or in multiple expense categories (required, optional, expected, unexpected)
Expense listing task<br>
18
Study 3 - Method<br>
19
Study 3 - Method<br>
20
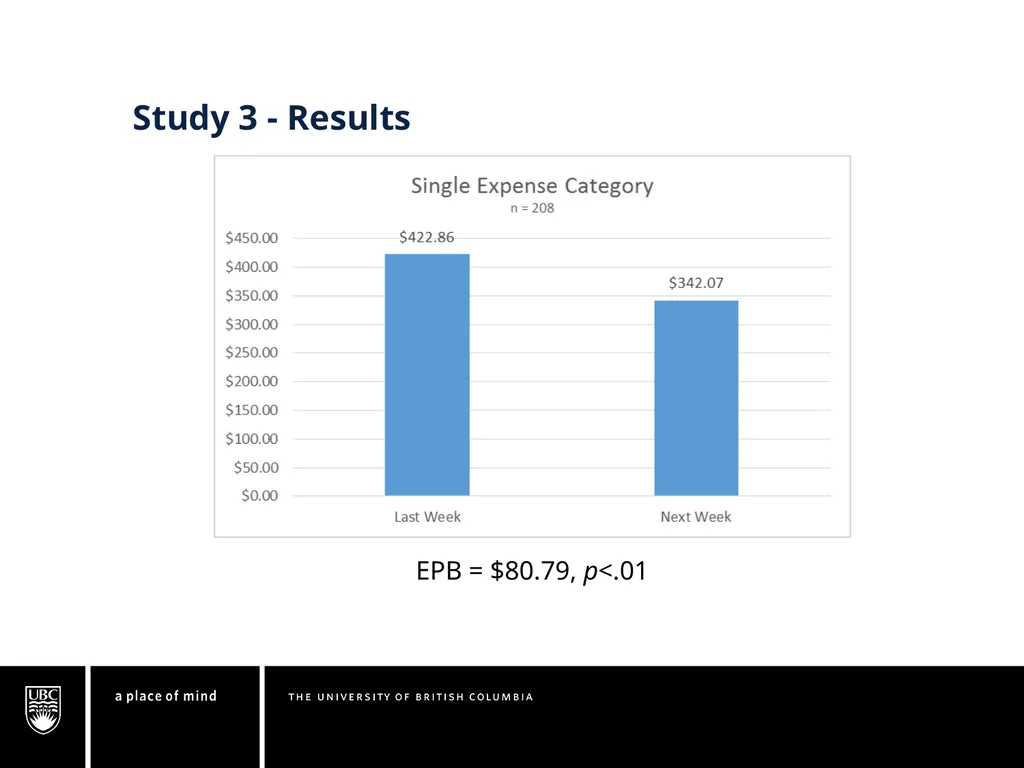
Study 3 - Results EPB = $80.79, p<.01<br>
21
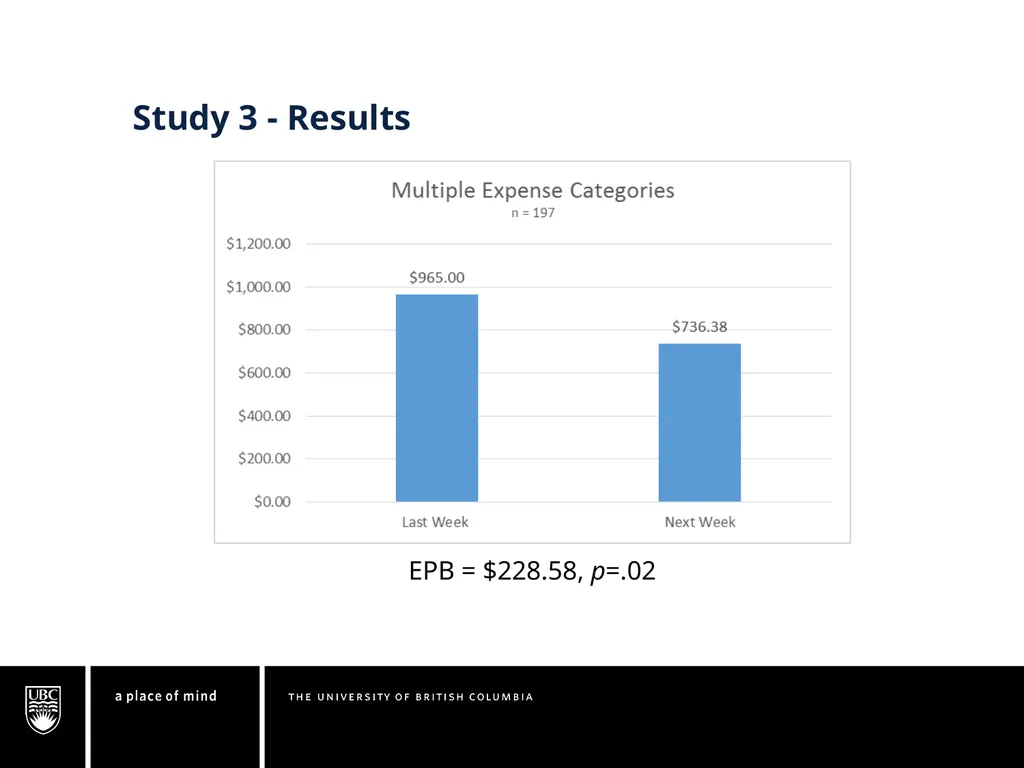
Study 3 - Results EPB = $228.58, p=.02<br>
22
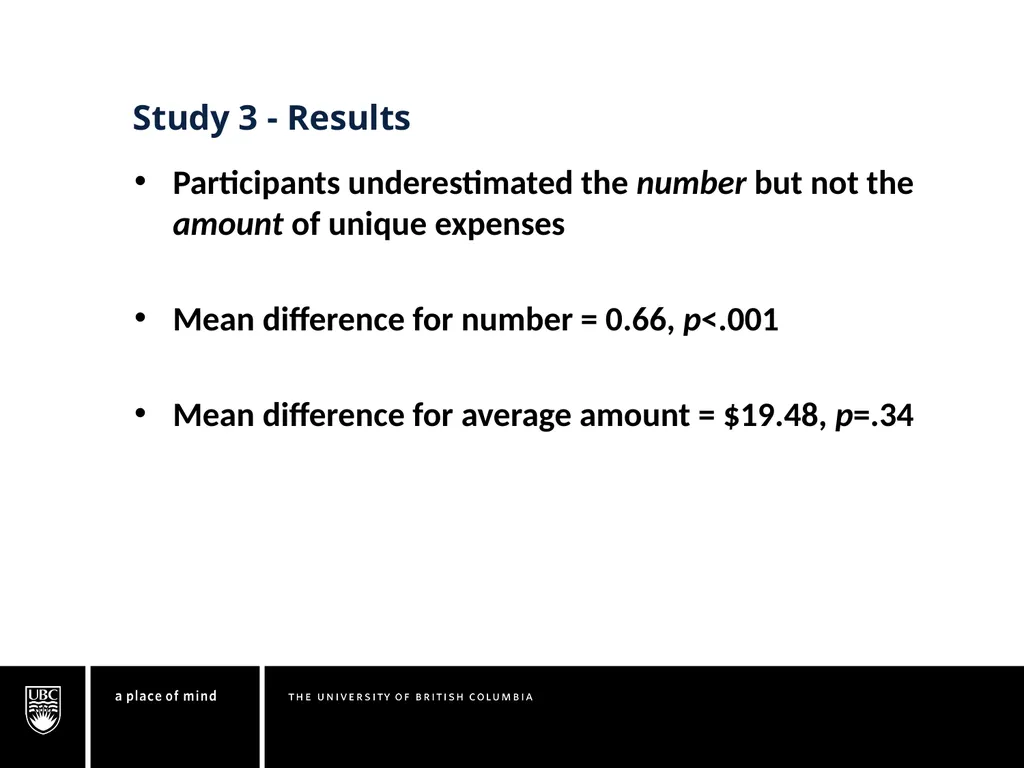
Study 3 - Results Participants underestimated the number but not the amount of unique expenses
Mean difference for number = 0.66, p<.001
Mean difference for average amount = $19.48, p=.34<br>
23
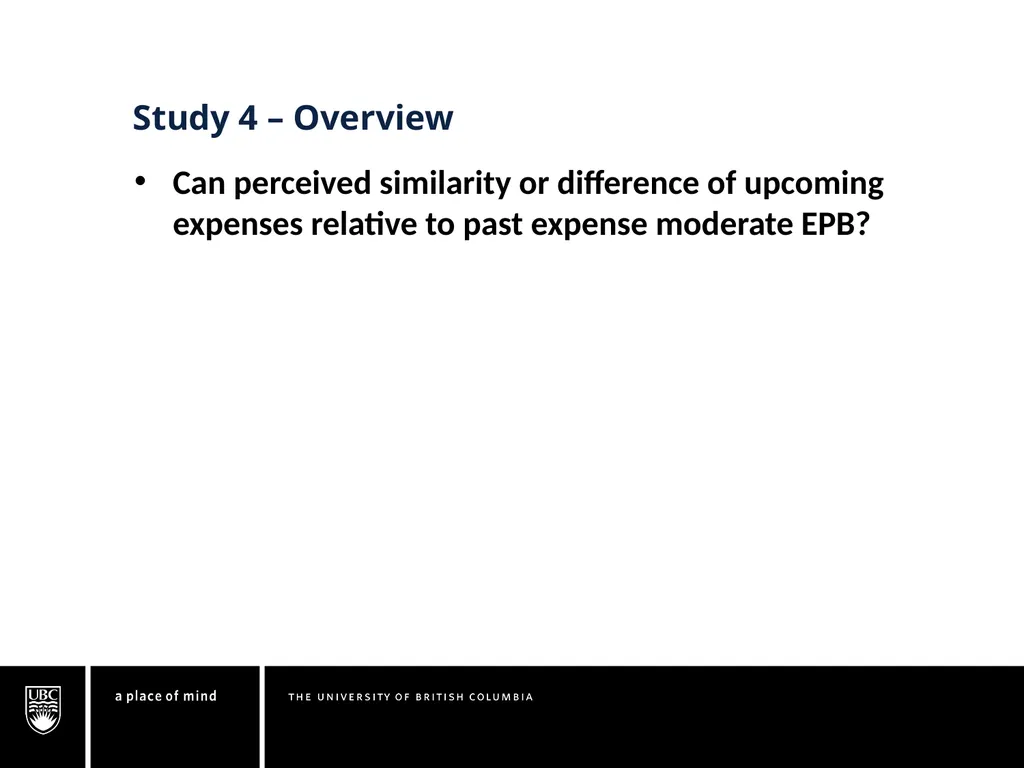
Study 4 – Overview Can perceived similarity or difference of upcoming expenses relative to past expense moderate EPB?<br>
24
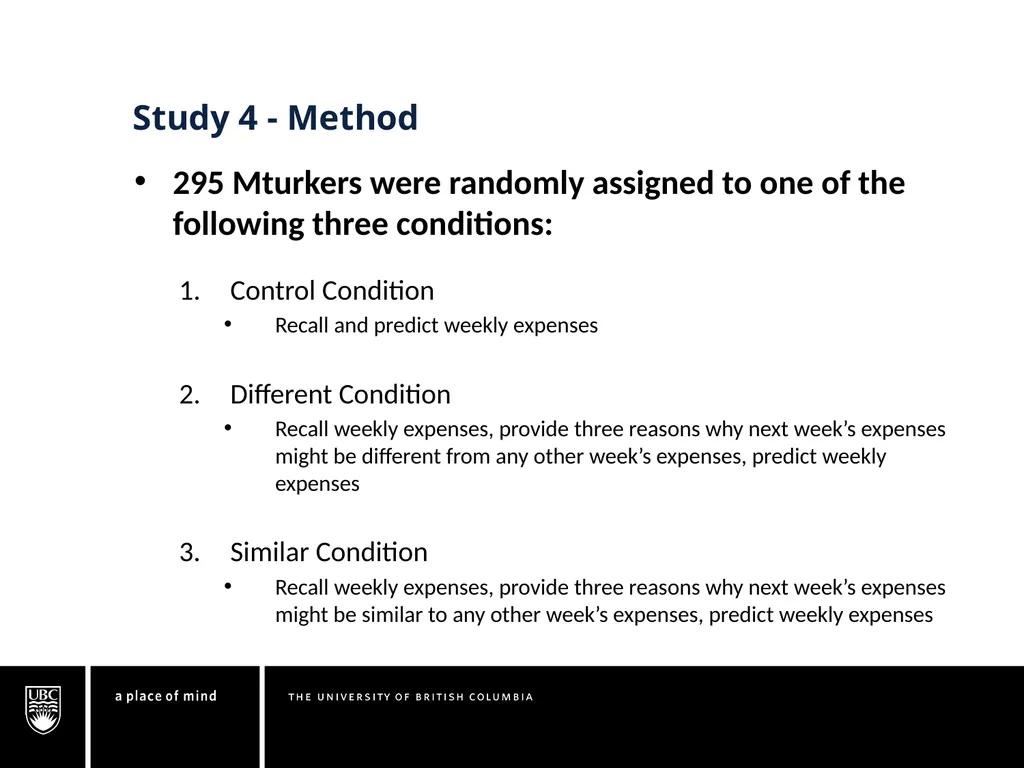
Study 4 - Method 295 Mturkers were randomly assigned to one of the following three conditions:
Control Condition
Recall and predict weekly expenses
Different Condition
Recall weekly expenses, provide three reasons why next week’s expenses might be different from any other week’s expenses, predict weekly expenses
Similar Condition
Recall weekly expenses, provide three reasons why next week’s expenses might be similar to any other week’s expenses, predict weekly expenses<br>
25
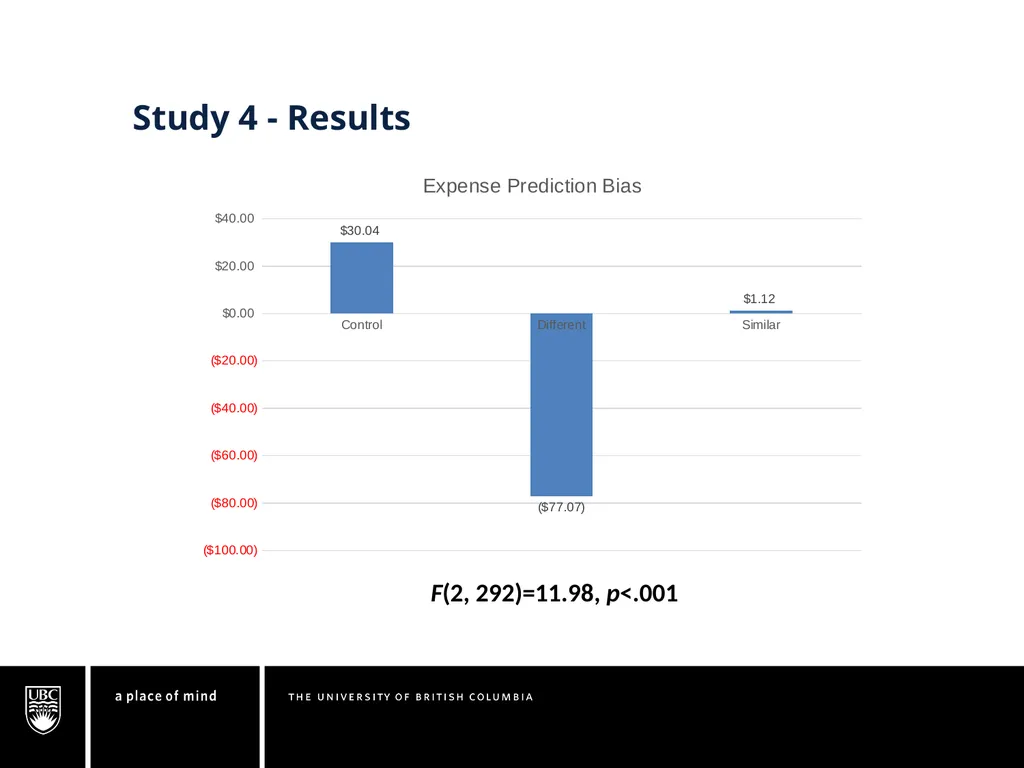
Study 4 - Results F(2, 292)=11.98, p<.001<br>
26
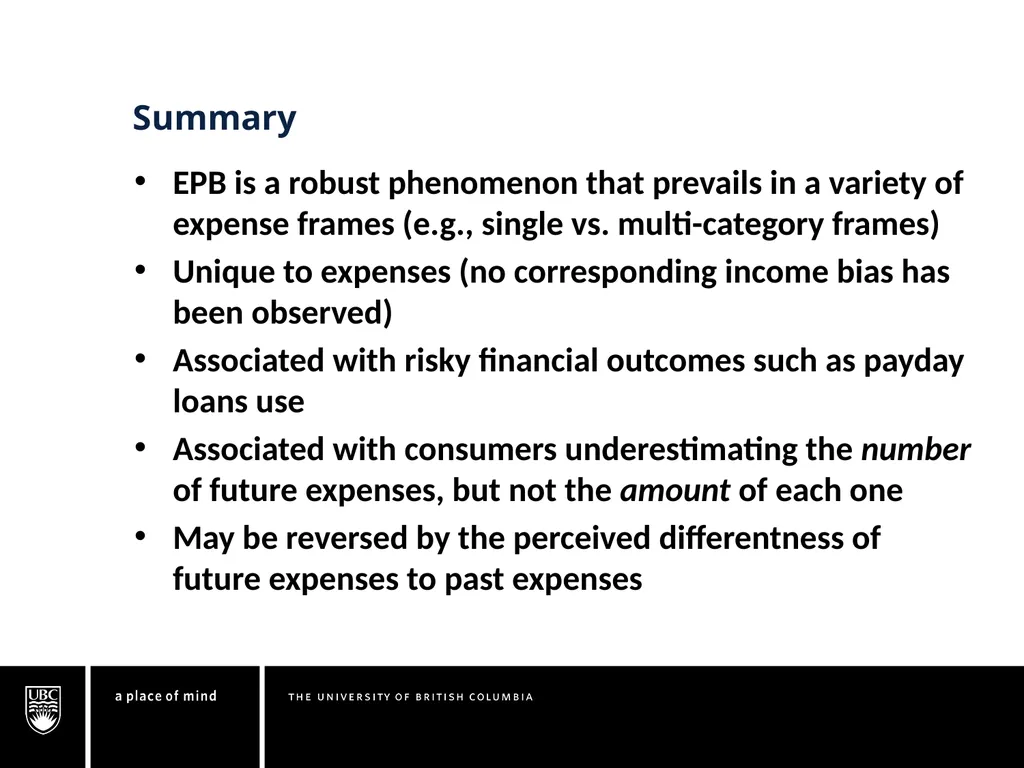
Summary EPB is a robust phenomenon that prevails in a variety of expense frames (e.g., single vs. multi-category frames)
Unique to expenses (no corresponding income bias has been observed)
Associated with risky financial outcomes such as payday loans use
Associated with consumers underestimating the number of future expenses, but not the amount of each one
May be reversed by the perceived differentness of future expenses to past expenses<br>
27
Directions for Future Research What are the downstream consequences of the bias?
Acceptability of payday loan rates
Sensitivity to APR<br>