USING DATA TO SUPPORT STORIES Theophilus Abbah, PhD Introduction Data brings to mind statistics: facts, figures and numbers. We also have symbols, images in the form of visualization Computers: data processing Quantitative data: use of
"USING DATA TO SUPPORT STORIES Theophilus Abbah," is the property of its rightful owner. Permission is granted to
download and print the materials on this website for personal, non-commercial use only, and to display it
on your personal computer provided you do not modify the materials and that you retain all copyright
notices contained in the materials. By downloading content from our website, you accept the terms of this
agreement.
Presentation Transcript
01
USING DATA TO SUPPORT STORIES Theophilus Abbah, PhD<br>
02
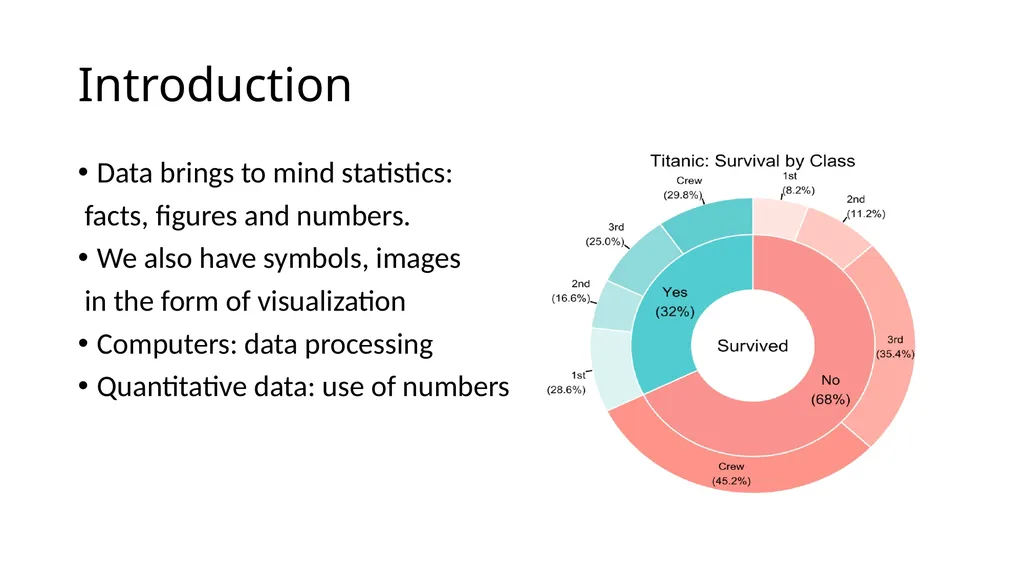
Introduction Data brings to mind statistics:
facts, figures and numbers.
We also have symbols, images
in the form of visualization
Computers: data processing
Quantitative data: use of numbers<br>
03
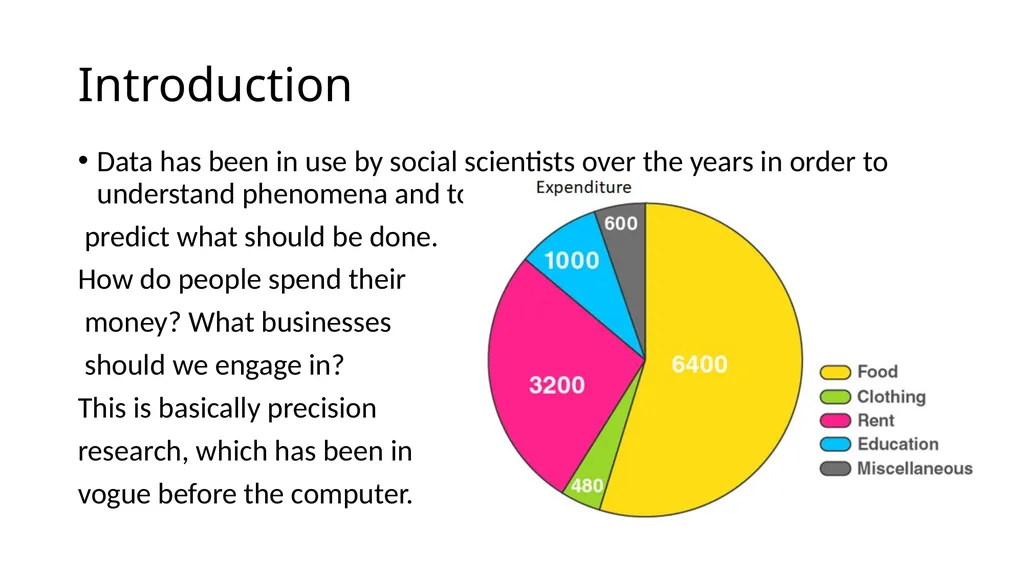
Introduction Data has been in use by social scientists over the years in order to understand phenomena and to
predict what should be done.
How do people spend their
money? What businesses
should we engage in?
This is basically precision
research, which has been in
vogue before the computer.<br>
04
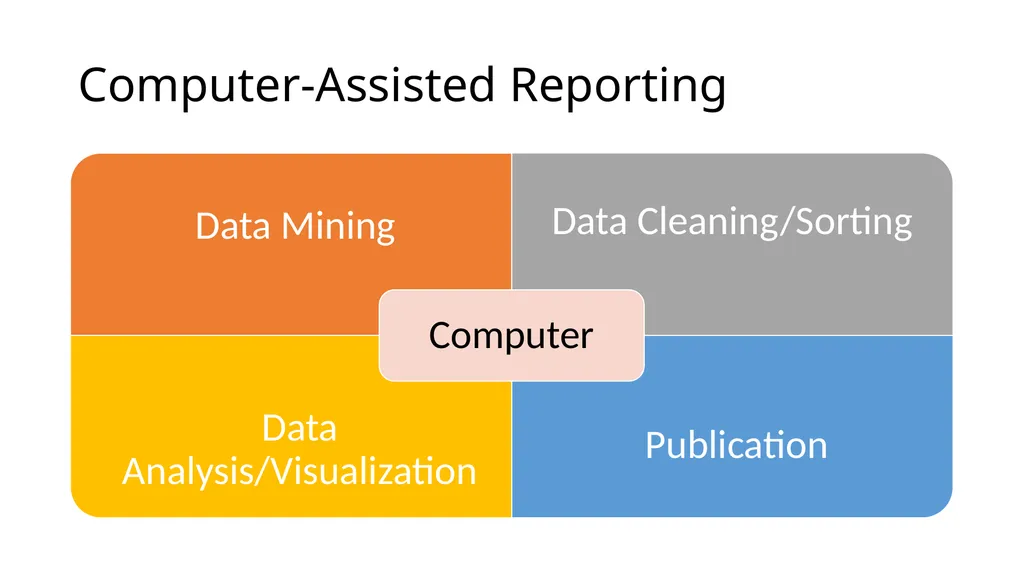
Computer-Assisted Reporting<br>
05
Data in stories In today’s journalism data is used to present stories in a compelling manner:
Read this story: What is the situation in Gaza’s Khan Younis as Israel intensifies attacks? | Israel-Palestine conflict News | Al Jazeera<br>
06
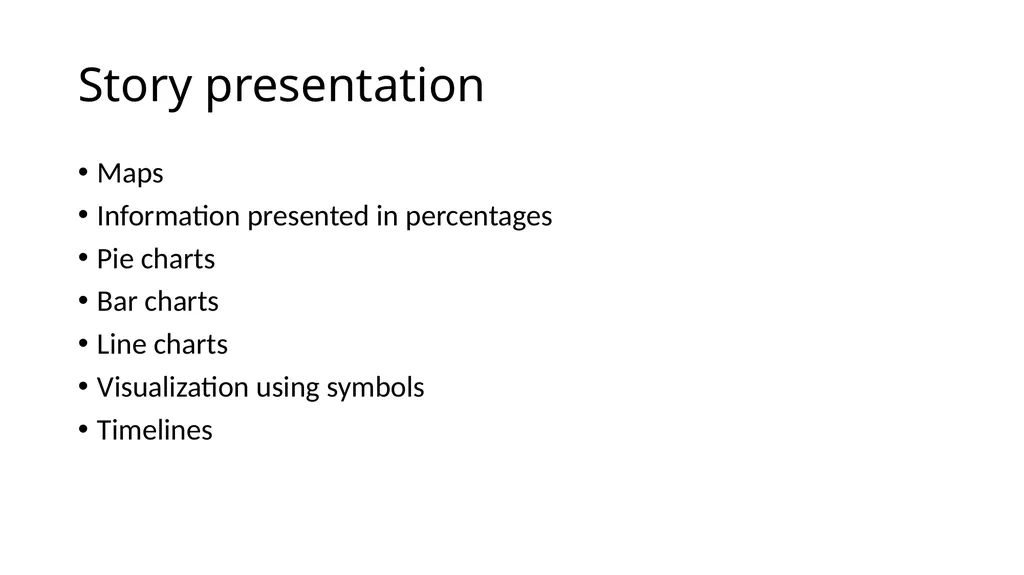
Story presentation Maps
Information presented in percentages
Pie charts
Bar charts
Line charts
Visualization using symbols
Timelines<br>
07
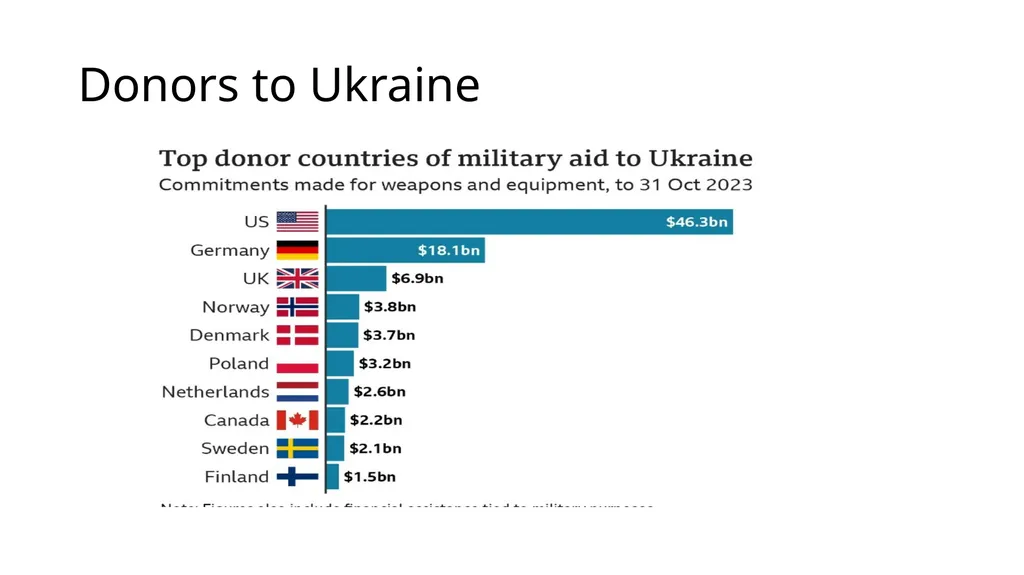
Data in stories Read this BBC story: The impact will be felt in Ukraine war if US aid dries up - BBC News<br>
08
Donors to Ukraine<br>
09
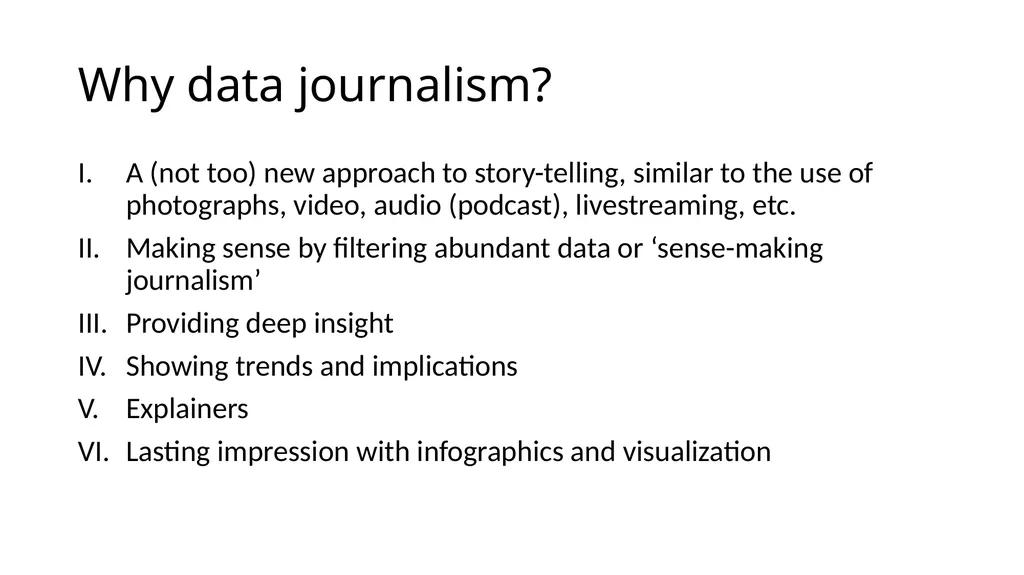
Why data journalism? A (not too) new approach to story-telling, similar to the use of photographs, video, audio (podcast), livestreaming, etc.
Making sense by filtering abundant data or ‘sense-making journalism’
Providing deep insight
Showing trends and implications
Explainers
Lasting impression with infographics and visualization<br>
10
How do journalists gather data? In the age of the Internet, data gathering is made easier because of diverse tools that are available. What journalists must strive to do is know how to use the various tools. This is what data mining is all about.
We need primary data & secondary data.
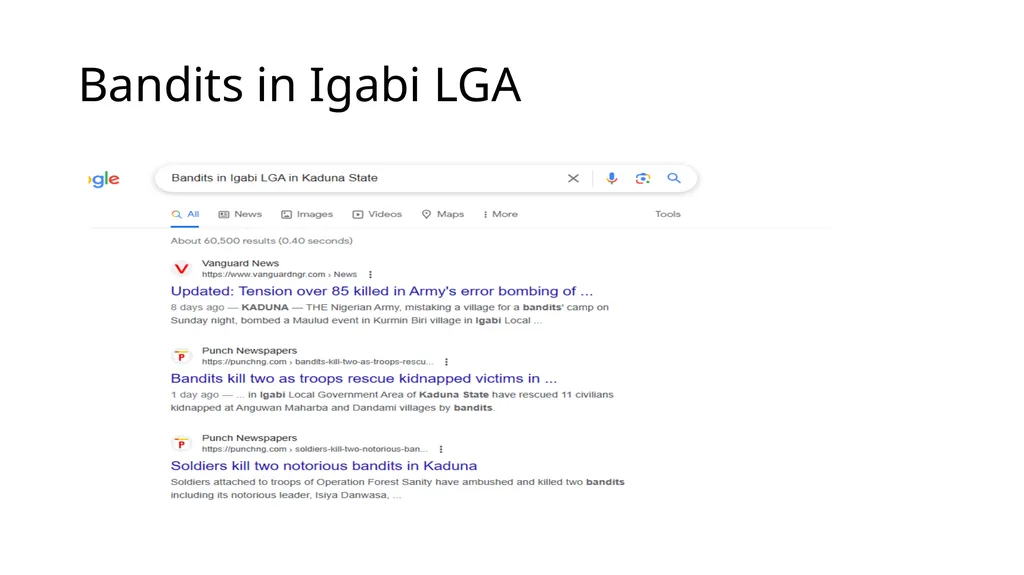
For instance, in trying to find out why the military would mistakenly kill so many persons in Igabi Local Government Area in Kaduna State, you may want to know how bandits threaten the lives of the people in the area. You could just do simple Google Search<br>
11
Bandits in Igabi LGA<br>
12
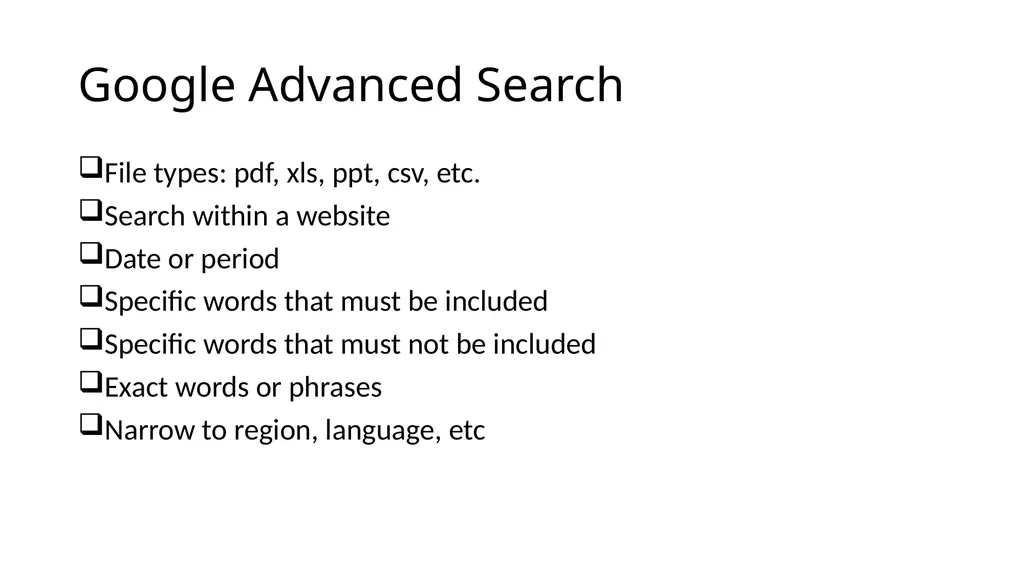
Google Advanced Search File types: pdf, xls, ppt, csv, etc.
Search within a website
Date or period
Specific words that must be included
Specific words that must not be included
Exact words or phrases
Narrow to region, language, etc<br>
13
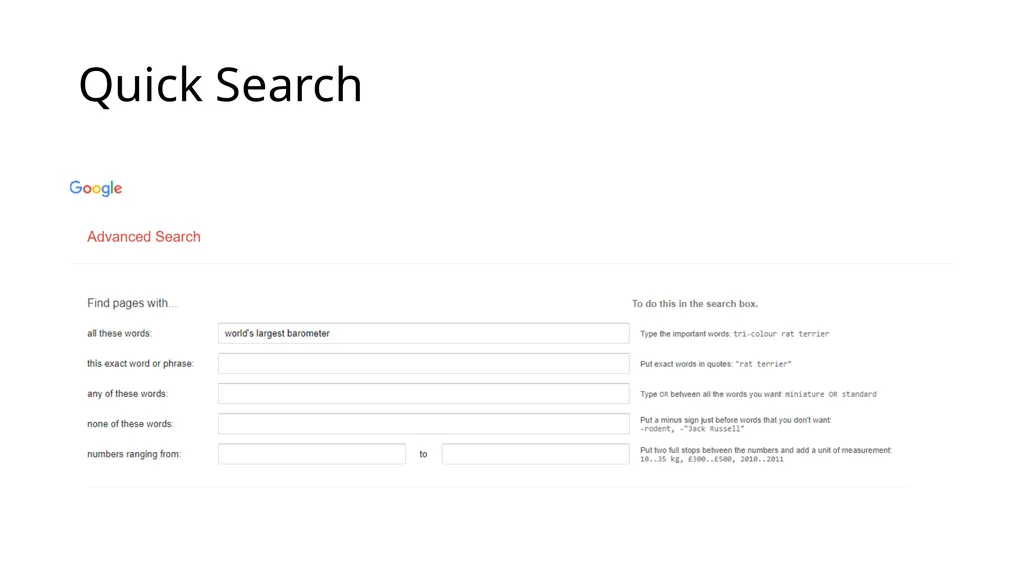
Quick Search<br>
14
Using Google If you right-click your mouse, select ‘Web Capture’, you will be able to download all the stories about ‘bandits in Igabi’. The hard work there, however, is for you to count the number of attacks by bandits in the LGA and the number of deaths.
Doing it manually could be tough, so also is the process of scraping the data from websites, uploading them on your Excel for cleaning and analysis. You may need to use premium version of tools.
You may be lucky: some researchers may have gathered the data already. You need to extract (give credit), and use it in a way it will be relevant to your story. For instance, if the data is about bandit attacks in Kaduna State, you could isolate the data on Igabi LGA for your analysis.<br>
15
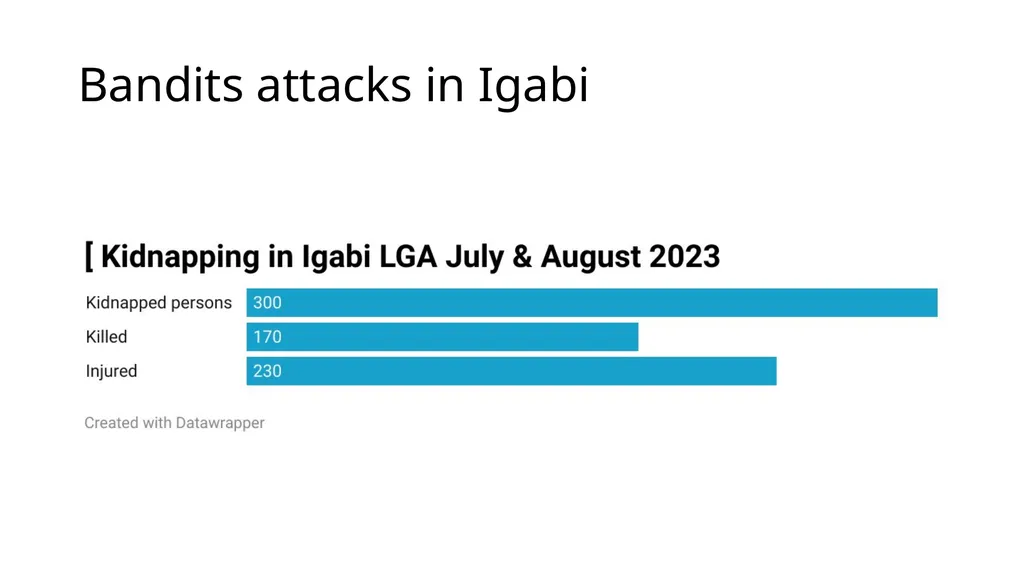
Bandits attacks in Igabi<br>
16
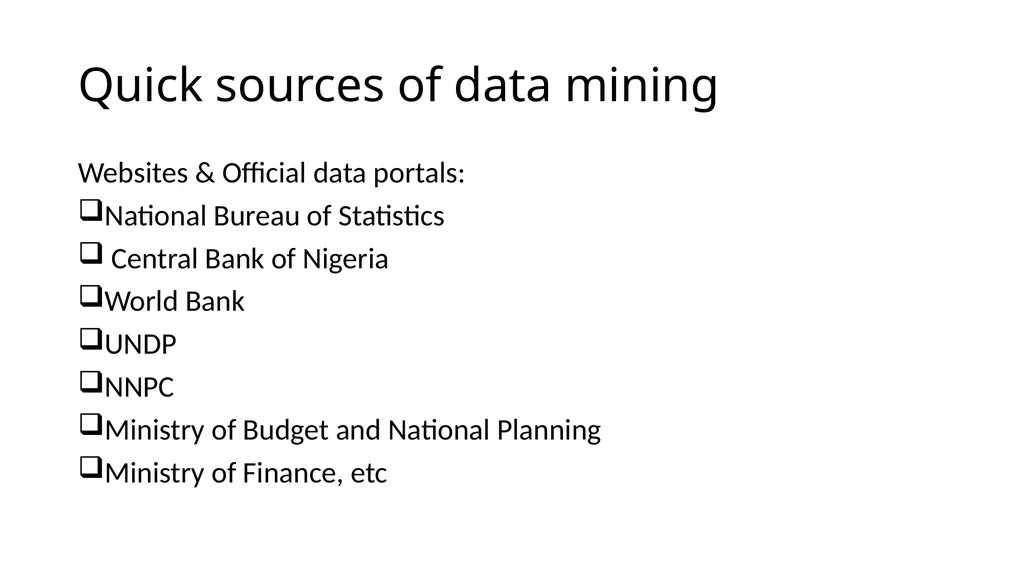
Quick sources of data mining Websites & Official data portals:
National Bureau of Statistics
Central Bank of Nigeria
World Bank
UNDP
NNPC
Ministry of Budget and National Planning
Ministry of Finance, etc<br>
17
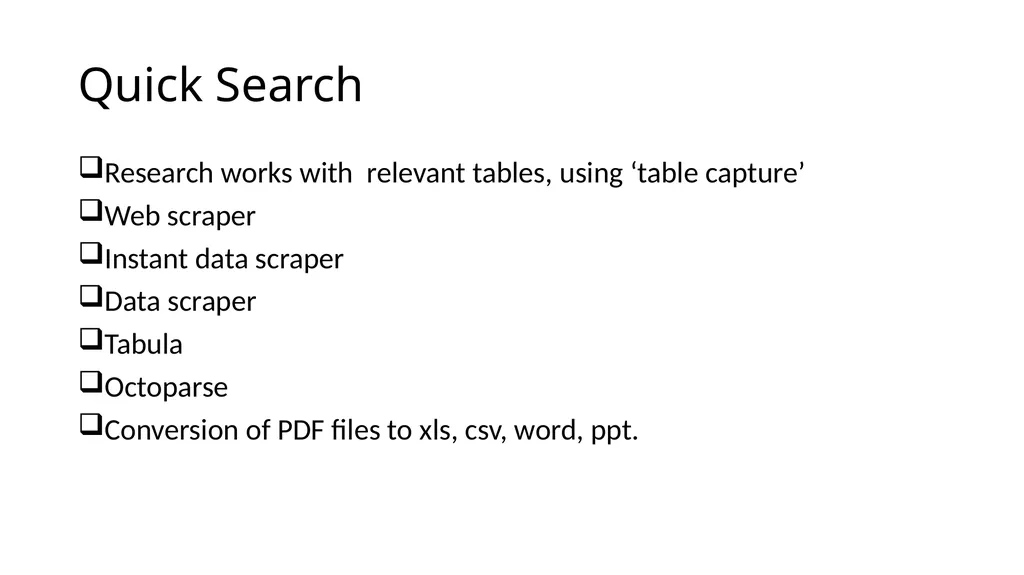
Quick Search Research works with relevant tables, using ‘table capture’
Web scraper
Instant data scraper
Data scraper
Tabula
Octoparse
Conversion of PDF files to xls, csv, word, ppt.<br>
18
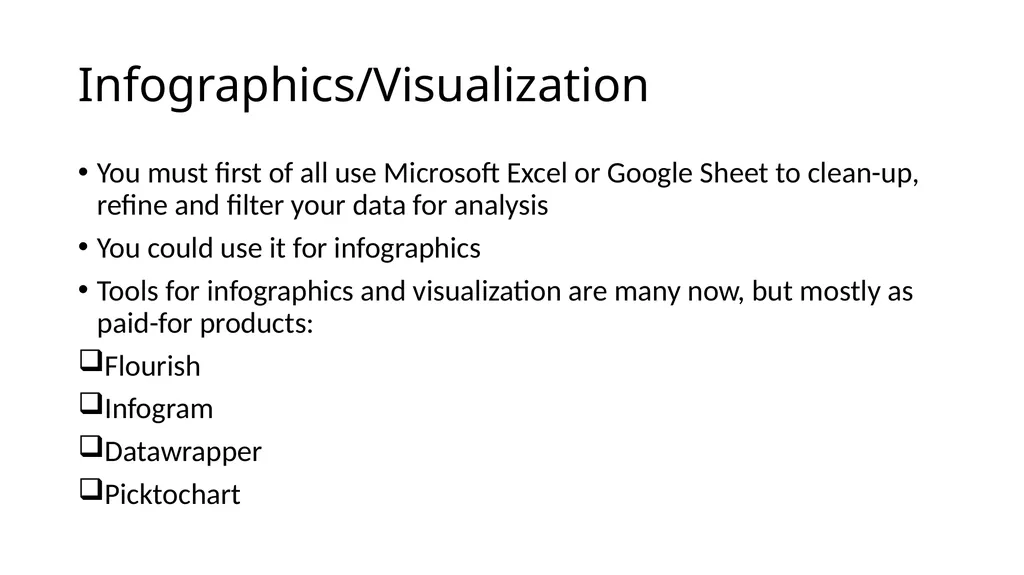
Infographics/Visualization You must first of all use Microsoft Excel or Google Sheet to clean-up, refine and filter your data for analysis
You could use it for infographics
Tools for infographics and visualization are many now, but mostly as paid-for products:
Flourish
Infogram
Datawrapper
Picktochart<br>
19
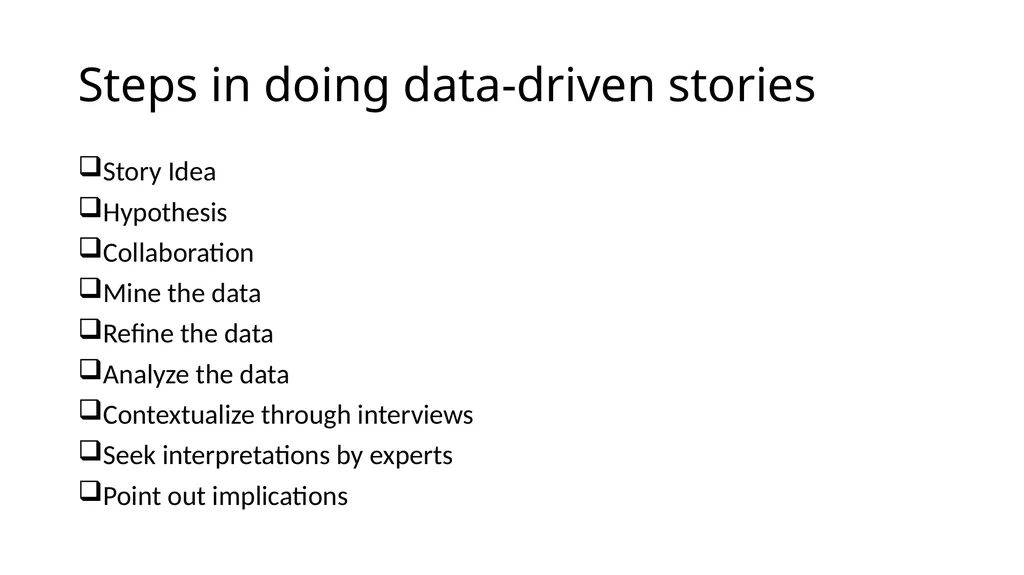
Steps in doing data-driven stories Story Idea
Hypothesis
Collaboration
Mine the data
Refine the data
Analyze the data
Contextualize through interviews
Seek interpretations by experts
Point out implications<br>
20
Resources 1. Beginner’s Guide to Extracting Data from PDFs – Global Investigative Journalism Network (gijn.org)
No Coding Required: A Step-by-Step Guide to Scraping Websites With Data Miner – Global Investigative Journalism Network (gijn.org)
data mining – Global Investigative Journalism Network (gijn.org)
Visualization Tools – Global Investigative Journalism Network (gijn.org)
Getting Started – Tip Sheets – Global Investigative Journalism Network (gijn.org)<br>