Using MRMS Rotational Tracks for Northeastern US Tornado Warning Guidance Brian J. Frugis NOAANWS Albany, New York 23rd Northeast Regional Operational Workshop 2-3 November 2022 Motivation Although infrequent, tornadoes do occur within
"Using MRMS Rotational Tracks for Northeastern US" is the property of its rightful owner. Permission is granted to
download and print the materials on this website for personal, non-commercial use only, and to display it
on your personal computer provided you do not modify the materials and that you retain all copyright
notices contained in the materials. By downloading content from our website, you accept the terms of this
agreement.
Presentation Transcript
01
Using MRMS Rotational Tracks for Northeastern US Tornado Warning Guidance Brian J. Frugis
NOAA/NWS Albany, New York
23rd Northeast Regional Operational Workshop
2-3 November 2022<br>
02
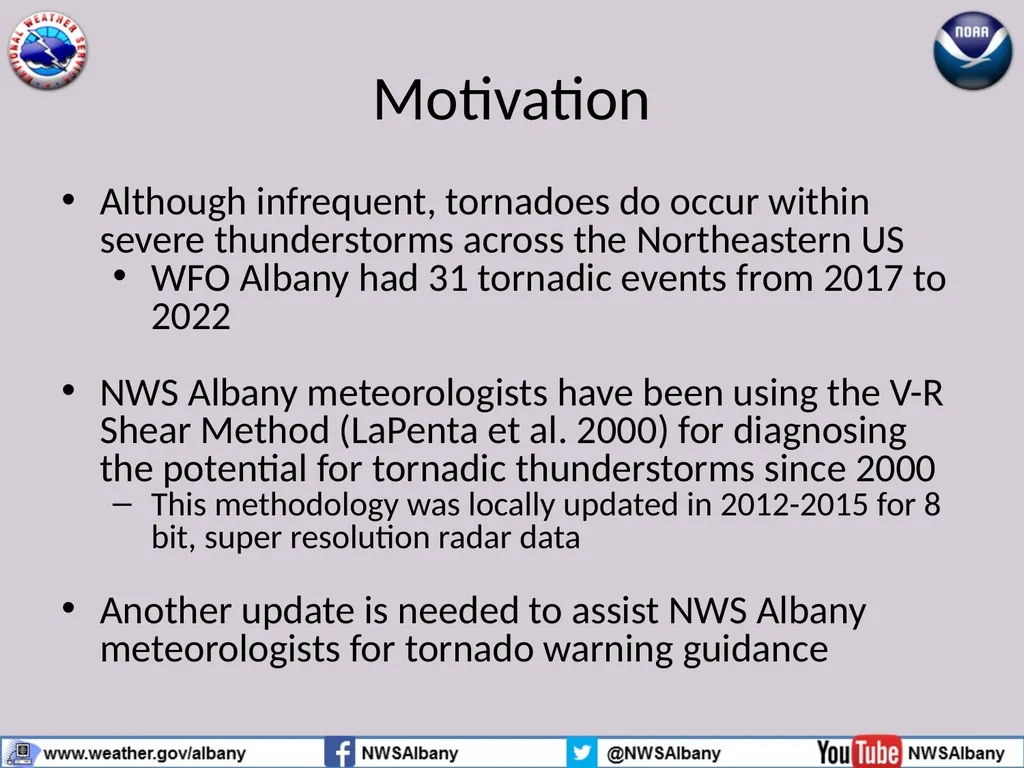
Motivation Although infrequent, tornadoes do occur within severe thunderstorms across the Northeastern US
WFO Albany had 31 tornadic events from 2017 to 2022
NWS Albany meteorologists have been using the V-R Shear Method (LaPenta et al. 2000) for diagnosing the potential for tornadic thunderstorms since 2000
This methodology was locally updated in 2012-2015 for 8 bit, super resolution radar data
Another update is needed to assist NWS Albany meteorologists for tornado warning guidance<br>
03
Original V-R Shear Study (LaPenta et al. 2000) Maximum observed gate-to-gate shear below 3 km was found to be useful in identifying tornadic storms (LaPenta et al. 2000)
S=Vr/(D*1800)
Shear (S) is measured in units of s-1, rotational velocity (Vr) in knots and D is the diameter of which S is calculated in n mi.
Vm is the maximum strength of the mesocyclone, which can be found using a vertical cross-section over a 3.5 n mi width
Radar data was 4 bit and had to be range normalized due to radar resolution and beam spreading<br>
04
Expanded V-R Shear Study (2012-2015) 8-bit radar data from 76 tornadoes from 2003-15 were examined using both the Weather Event Simulator (WES) & Gibson Ridge Software’s GR2Analyst.
21 null cases (storms with strong rotation that prompted tornado warnings but didn’t produce a tornado) were also looked at.
Shear was calculated for each tornado using a diameter of 0.5 n mi for all tornadoes from 2008-15 within 60 n mi of radar (since super-res data was available). The old methodology for determining D was used for tornadoes from 2003-08.
The maximum velocity differential of the mesocyclone (Vm) was calculated for each storm using a vertical cross-section
Results of S and Vm were compared to the nomogram graphic created by the LaPenta study<br>
05
Using the V-R Shear Method Rotational Velocity of tornadic couplet from 0.5° SRM measured over 0.5 nm width (about 10 nm from KENX radar located just south-southeast of tornadic couplet)
Vr=42.5 kts, S=0.0472 s-1 Cross-Section of SRM over 3.5 nm width of Mesocyclone.
Max Strength: 89 kts
(Vm=Max inbound + Max Outbound of Meso)<br>
06
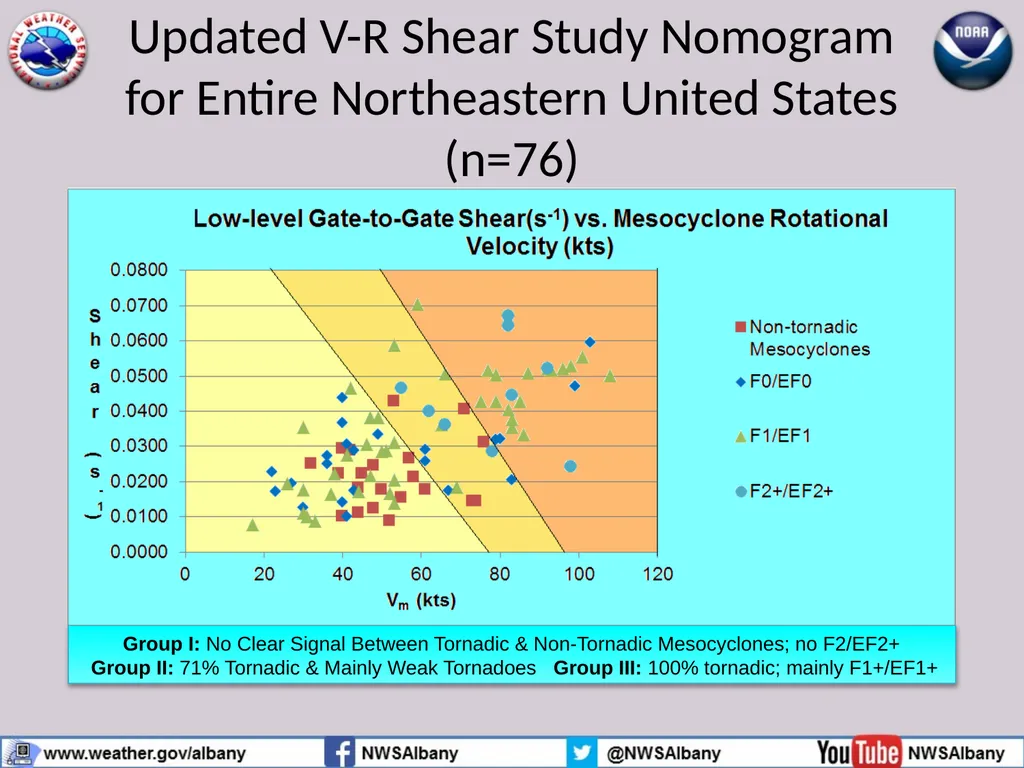
Updated V-R Shear Study Nomogram for Entire Northeastern United States (n=76) Group I: No Clear Signal Between Tornadic & Non-Tornadic Mesocyclones; no F2/EF2+
Group II: 71% Tornadic & Mainly Weak Tornadoes Group III: 100% tornadic; mainly F1+/EF1+<br>
07
Limitations of V-R Shear Method This methodology relies on taking measurements of both low level and mid level rotation to compare to nomogram
Warning meteorologists at ALY preferred using FSI (4-D Storm Investigator) since it was embedded in AWIPS and can be used along with the V-R Shear Tool built into D2D
FSI is no longer supported by recent AWIPS build
The loss of having FSI would require the warning meteorologist to use GR2Analyst, but the V-R Shear tool is still located within D2D
All in all, this takes a lot of time and effort when time is at a premium. We need a faster and easier way to assess rotation for potential tornadic storms<br>
08
Recent ALY Tornado Climatology 2017-2022 (n=31)<br>
09
MRMS Azimuthal Shear & Rotation Tracks Multi-Radar Multi Sensor (MRMS) system produces plots showing maximum azimuthal shear for both low layer (0-2 km) and mid layer (3-6 km)
The maximum azimuthal shear is calculated using a Linear Least Squares Derivative method on radial velocity data from individual radars and then blended into a large multi-radar mosaic for the CONUS (NWS VLAB page) MRMS Low-Level Rotation Tracks from 27 Aug 2020 at 18:12Z. Values exceeding 0.015 s-1 over the Catskills were associated with a tornado.<br>
10
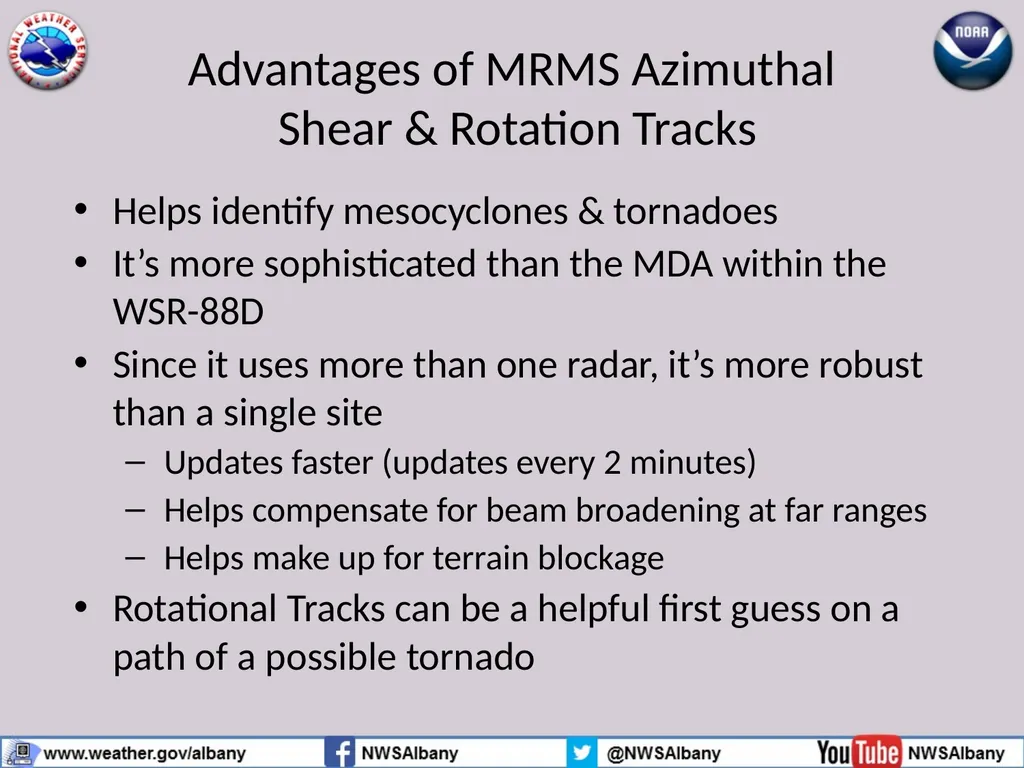
Advantages of MRMS Azimuthal Shear & Rotation Tracks Helps identify mesocyclones & tornadoes
It’s more sophisticated than the MDA within the WSR-88D
Since it uses more than one radar, it’s more robust than a single site
Updates faster (updates every 2 minutes)
Helps compensate for beam broadening at far ranges
Helps make up for terrain blockage
Rotational Tracks can be a helpful first guess on a path of a possible tornado<br>
11
Radar & Applications Course (RAC) Guidance In addition to the usual items to examine when diagnosing tornado potential (Vr, TVS, TDS, etc.), RAC recommends examining MRMS Rotation Tracks
Low level values of 0.015 s-1 & mid-level values of 0.010 s-1 suggest the potential for possible tornado formation<br>
12
Methodology for 2022 MRMS Rotation Track Study Highest values of azimuthal shear were calculated for both low and mid levels for all tornadic events in the ALY area from 2017 to 2022
The MRMS archive located on the MRMS Development Products Viewer (https://mrms-dev.nssl.noaa.gov/qvs/vmrms/viewer/) was utilized
Max azimuthal shear values were also calculated for all null events from 2017 to 2022
Null events were classified as events when tornado warnings were issued but no tornado was confirmed
25 events fit this classification<br>
13
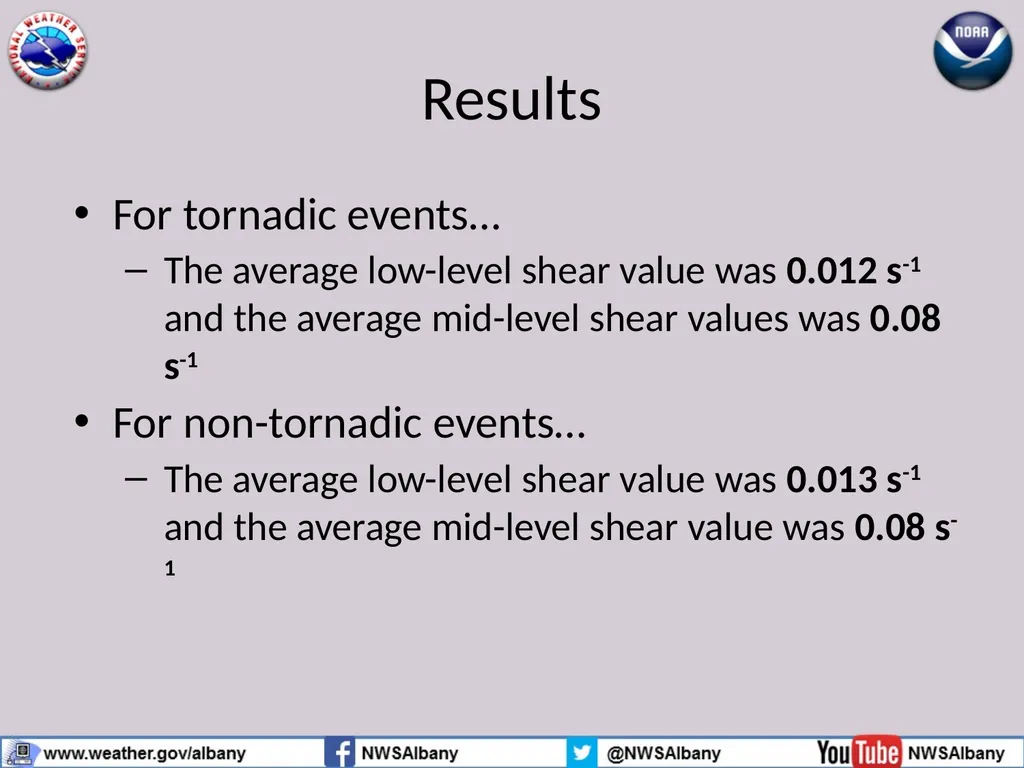
Results For tornadic events…
The average low-level shear value was 0.012 s-1 and the average mid-level shear values was 0.08 s-1
For non-tornadic events…
The average low-level shear value was 0.013 s-1 and the average mid-level shear value was 0.08 s-1<br>
14
Results: Tornadic vs. Non-Tornadic (Null) Events These box and whisker plots show similar values for both tornadic and non-tornadic events. The low-level rotation distribution is slightly higher for the non-tornadic events, which is somewhat surprising!<br>
15
Results: Shear by Tornado Strength<br>
16
Results: Shear by Storm Type<br>
17
Discussion Limited data set may have an impact on these results
Without any EF2+ tornadic events, it’s hard to say if these values would be different for stronger events
As with the V-R Shear method, there are some overlap in the value between weak tornadic and non-tornadic events
As usual with warning guidance items, MRMS rotation tracks aren’t a silver bullet and need to be used in conjunction with other methods and guidance<br>
18
Summary NWS Albany has been using the V-R Shear Methodology for assessing tornadic potential, but this could use an update
Using MRMS Max Azimuthal Shear (Rotation Tracks) could be a fast way of examining low and mid level rotation within a possible tornadic storm
MRMS has an advantage over the legacy V-R Shear, as it utilizes more than one radar site, reducing issues with beam widening and terrain
Although the dataset is limited so far, shear values between tornadic and non-tornadic storms are similar, but this could be due to all tornadic events being on the weaker side
Supercells may show slightly higher values than QLCS/Squall Line, but more work needs to be done to confirm this<br>
19
Future Work More storms needs to be examined. Other Northeastern US tornadic events can be looked at to expand the dataset
May try to incorporate other quick assessments of rotation (such as GR2Analyst’s “NROT”) into the study as well
Would be interesting to incorporate ProbSevere (ProbTor) into this work as well<br>