Using NPMRDS Data for System Performance Chris Upchurch Wichita Area Metropolitan Planning Organization MAP-21 System Performance Measures Level of Travel Time Reliability Peak Hour Travel Time Ratio Truck Travel Time Reliability Average
Related Topics
Download this presentation From Below
"Using NPMRDS Data for System Performance Chris" is the property of its rightful owner. Permission is granted to
download and print the materials on this website for personal, non-commercial use only, and to display it
on your personal computer provided you do not modify the materials and that you retain all copyright
notices contained in the materials. By downloading content from our website, you accept the terms of this
agreement.
Share
Embed code
Presentation Transcript
01
Using NPMRDS Data for System Performance Chris Upchurch
Wichita Area Metropolitan
Planning Organization<br>
02
MAP-21 System Performance Measures Level of Travel Time Reliability
Peak Hour Travel Time Ratio
Truck Travel Time Reliability
Average Truck Speed<br>
03
MAP-21 System Performance Measures How many of you plan to calculate these yourselves?<br>
04
MAP-21 System Performance Measures How many of you plan to calculate these yourselves?
How many plan to hire a consultant or buy off-the-shelf software?<br>
05
MAP-21 System Performance Measures How many of you plan to calculate these yourselves?
How many plan to hire a consultant or buy off-the-shelf software?
How many haven’t made a decision?<br>
06
What is NPMRDS? National
Performance
Management
Research
Data
Set<br>
07
What is NPMRDS? Travel time data for road segments
5 minute time increments (epochs)
Covers the National Highway System
Travel time data
All vehicles
Trucks<br>
08
How many have downloaded NPMRDS data and looked at it?<br>
09
How many of you have done something with NPMRDS data?<br>
10
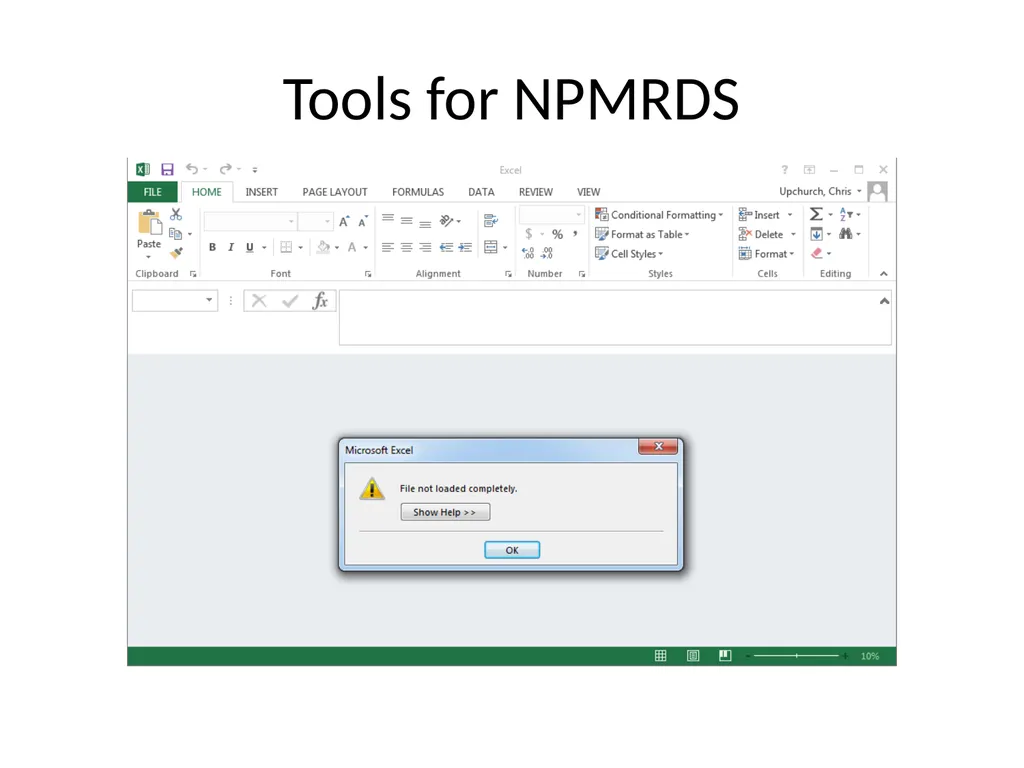
Tools for NPMRDS<br>
11
Tools for NPMRDS Statistical Tools
Databases
Custom software<br>
12
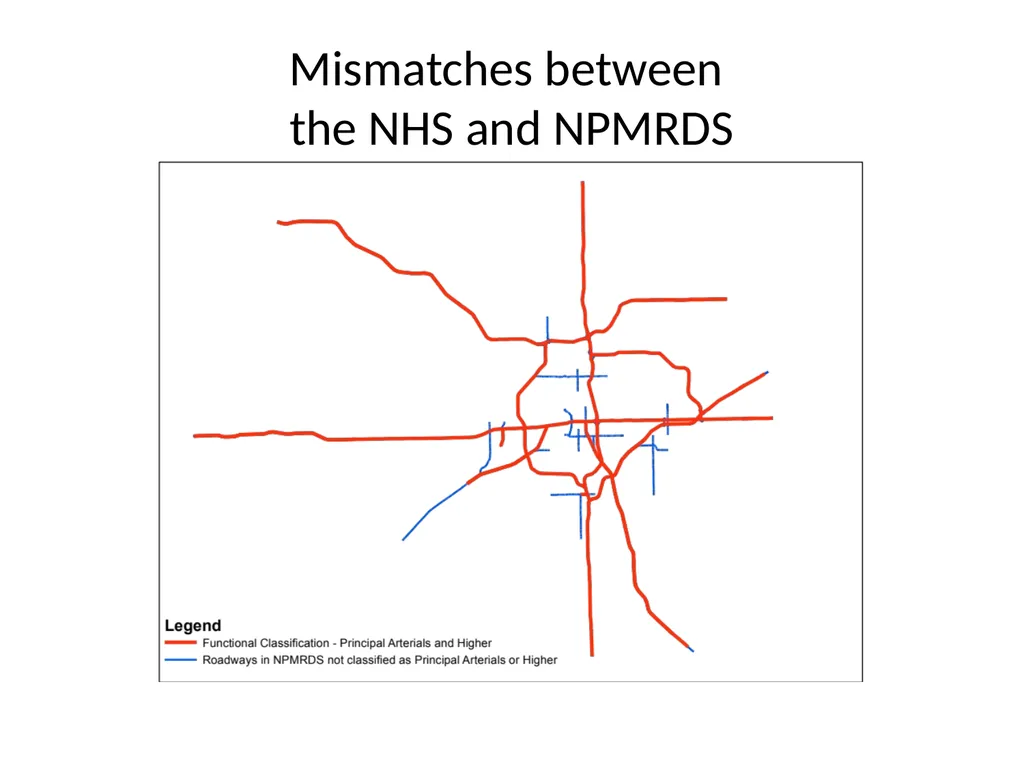
Mismatches between the NHS and NPMRDS<br>
13
Level of Travel Time Reliability Divide:
80th Percentile Speed
50th Percentile speed
If a segment has a ratio of <1.5 it is considered reliable
Measure: Percentage of reliable mileage<br>
14
Level of Travel Time Reliability:
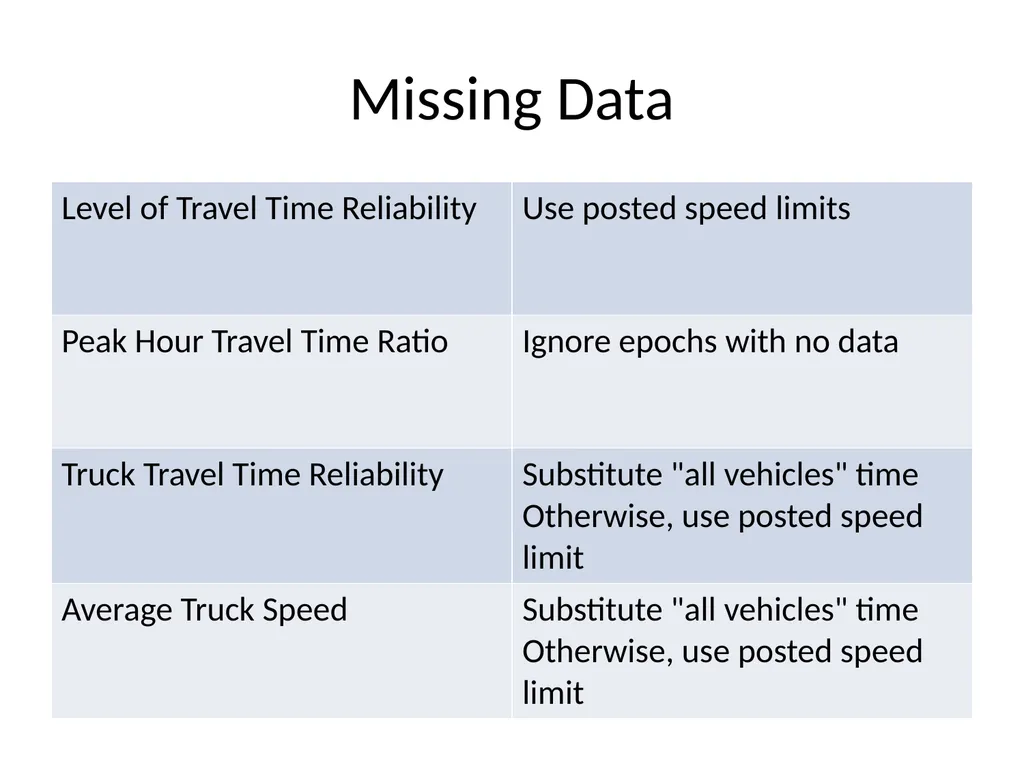
Handling Missing Data For epochs with missing data, use the posted speed limit for that segment
Speed limits often change within a travel segment<br>
15
Level of Travel Time Reliability:
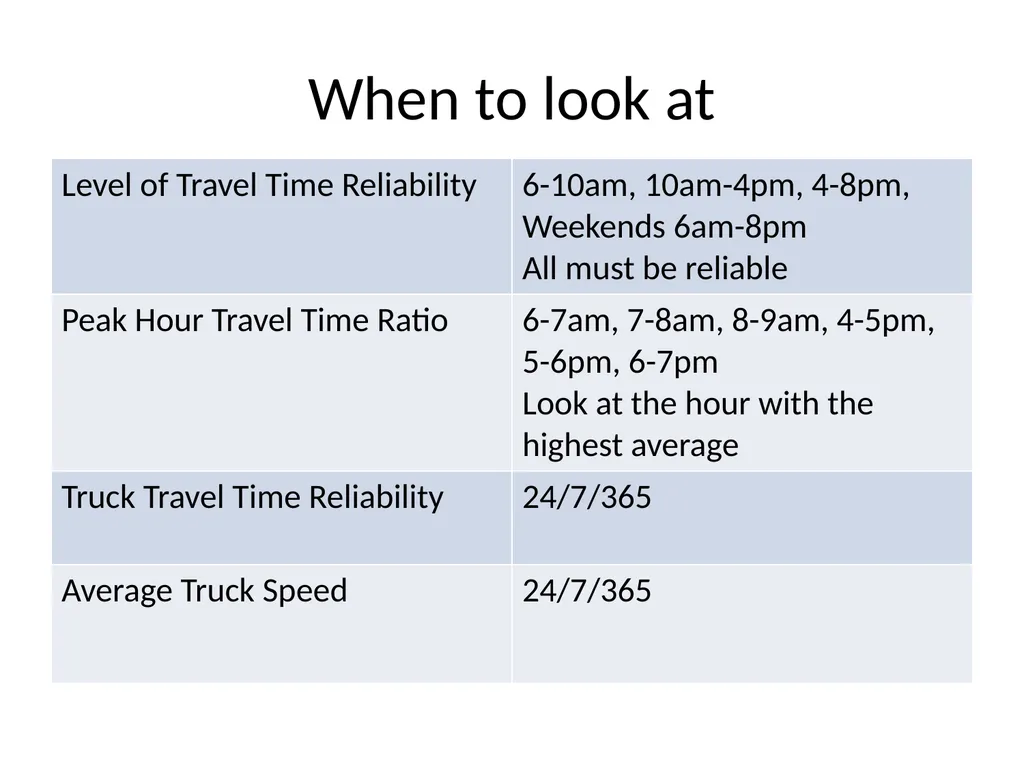
When to look at Weekdays:
6 am to 10 am
10 am to 4 pm
4 pm to 8 pm
Weekends:
6 am to 8 pm
Calculate each time period separately
All four time periods must be reliable for the segment to be considered reliable<br>
16
Level of Travel Time Reliability:
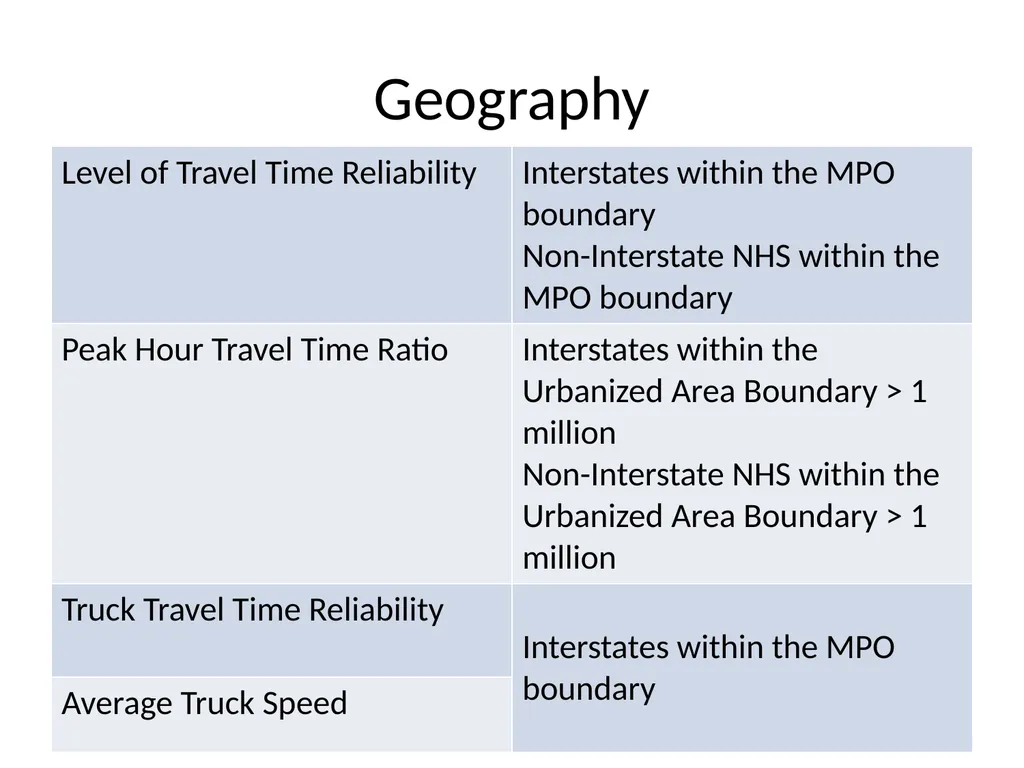
Geography Interstates within the MPO boundary
Non-Interstate NHS within the MPO boundary<br>
17
Peak Hour Travel Time Ratio Define a desired travel time for each segment
Divide:
Desired travel time
Actual travel time
If a segment has a ratio of <1.5 it is meets expectations
Measure: Percentage of mileage that meets expectations<br>
18
Level of Travel Time Reliability:
Handling missing data Ignore epochs with no data<br>
19
Level of Travel Time Reliability:
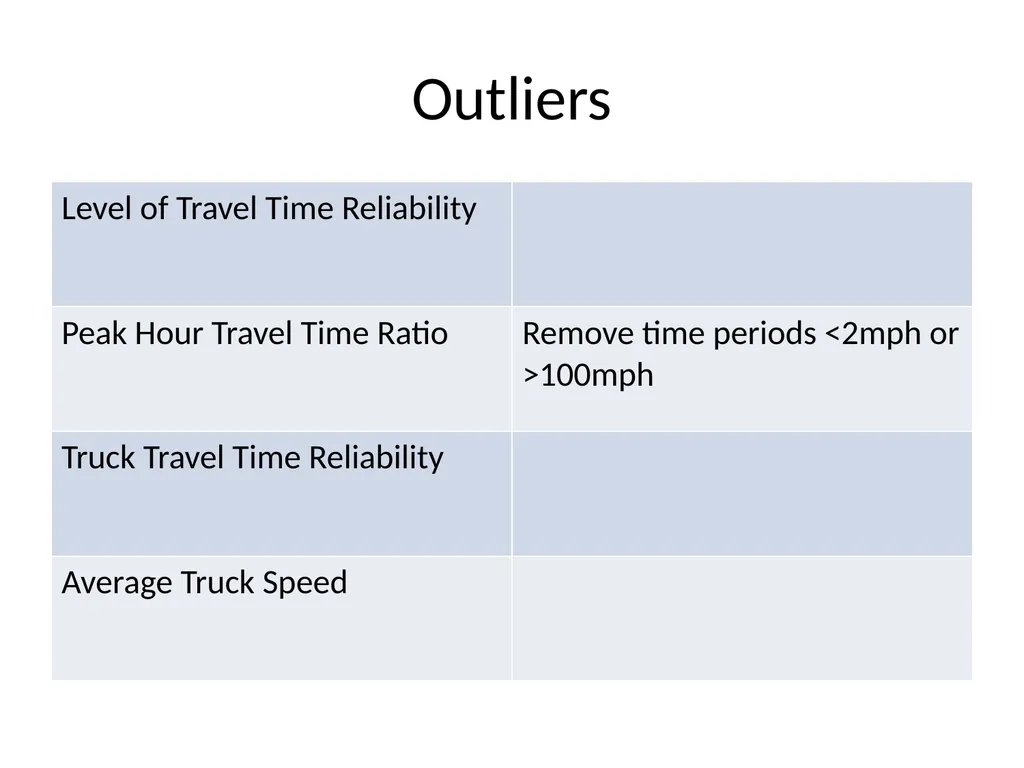
Outliers Remove epochs with travel speeds:
Below 2 mph
Over 100 mph<br>
20
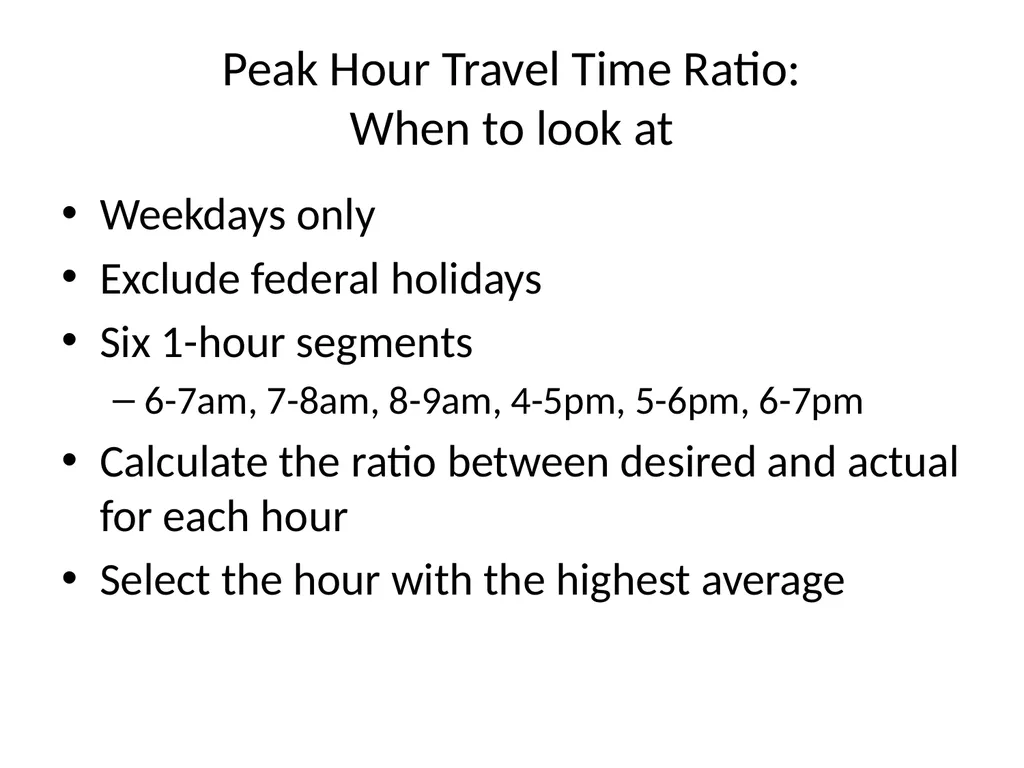
Peak Hour Travel Time Ratio:
When to look at Weekdays only
Exclude federal holidays
Six 1-hour segments
6-7am, 7-8am, 8-9am, 4-5pm, 5-6pm, 6-7pm
Calculate the ratio between desired and actual for each hour
Select the hour with the highest average<br>
21
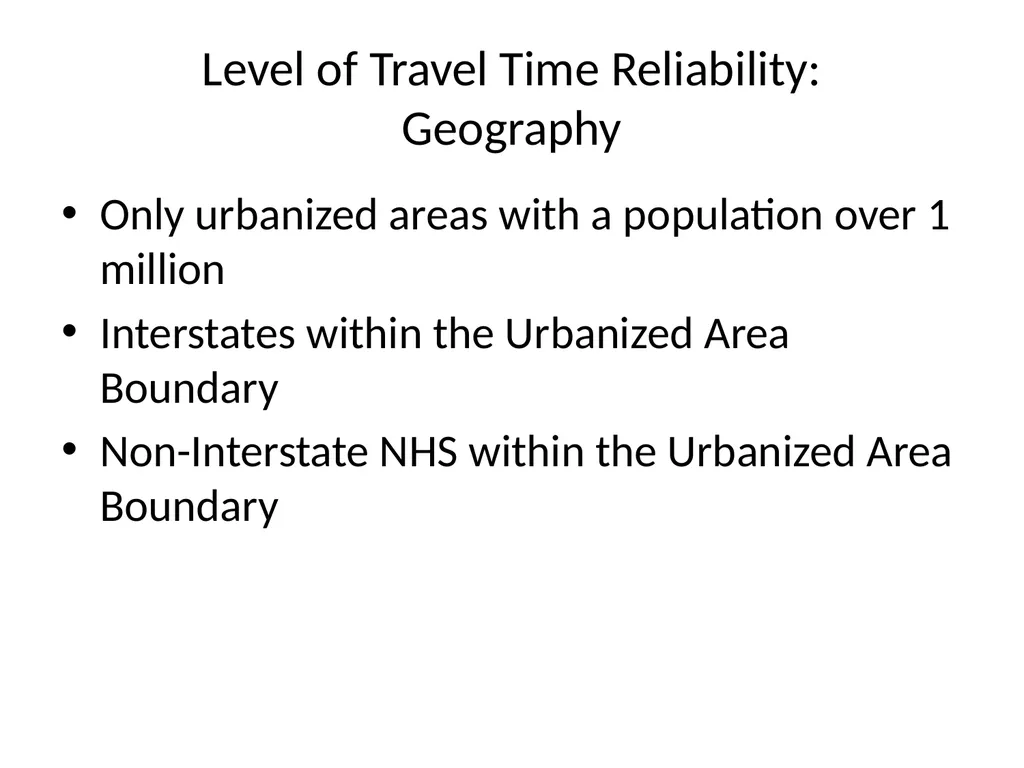
Level of Travel Time Reliability:
Geography Only urbanized areas with a population over 1 million
Interstates within the Urbanized Area Boundary
Non-Interstate NHS within the Urbanized Area Boundary<br>
22
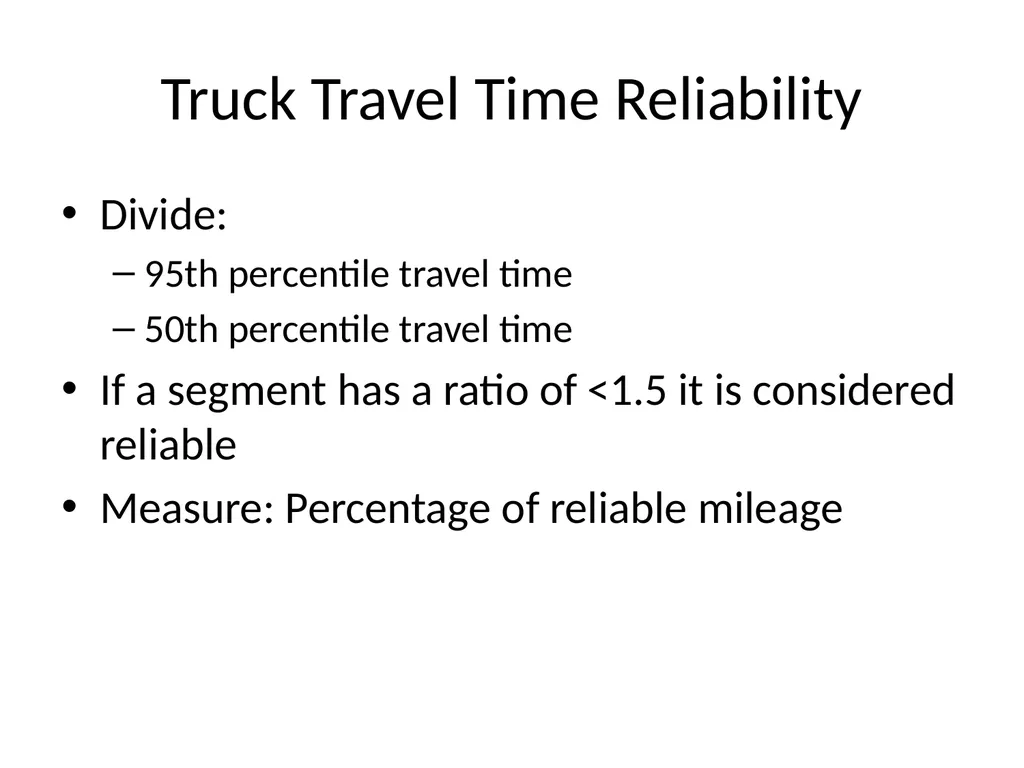
Truck Travel Time Reliability Divide:
95th percentile travel time
50th percentile travel time
If a segment has a ratio of <1.5 it is considered reliable
Measure: Percentage of reliable mileage<br>
23
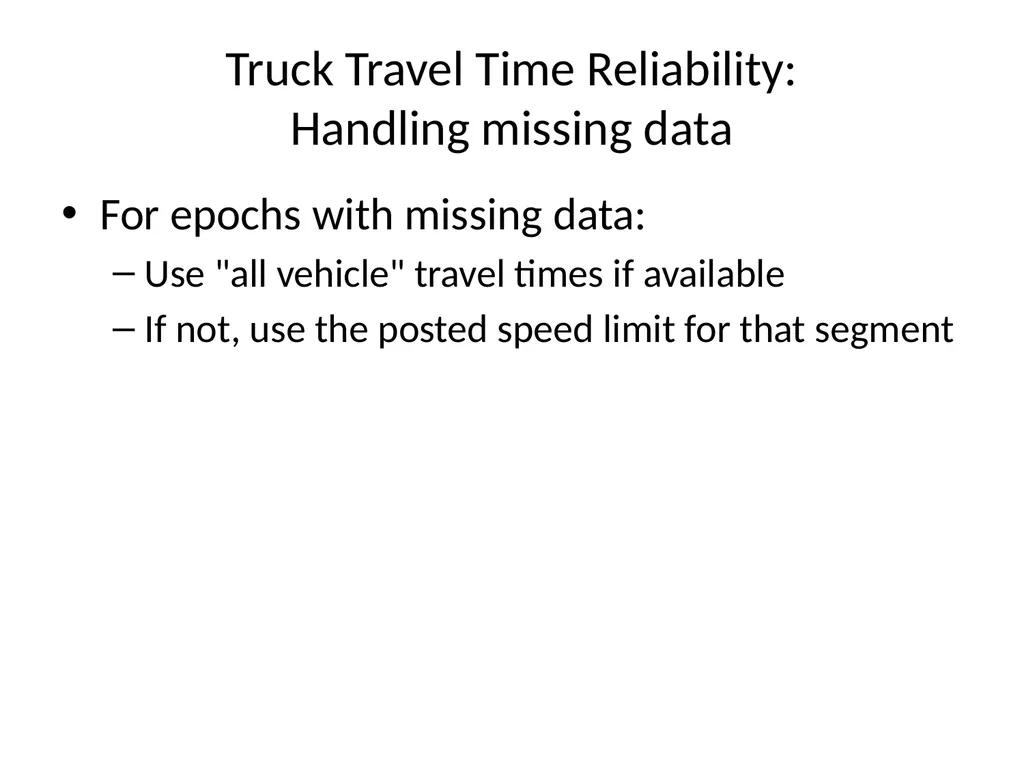
Truck Travel Time Reliability:
Handling missing data For epochs with missing data:
Use "all vehicle" travel times if available
If not, use the posted speed limit for that segment<br>
24
Truck Travel Time Reliability:
When to look at 24/7/365<br>
25
Travel Time Reliability:
When to look at Interstate System within the MPO Boundary<br>
26
Average Truck Speed Calculate the average struck speed over the year
If the average speed is over 50mph the segment is uncongested
Measure: the percentage of the system uncongested<br>
27
Average Truck Speed:
Handling missing data For epochs with missing data:
Use "all vehicle" travel times if available
If not, use the posted speed limit for that segment<br>
28
Average Truck Speed:
When to look at 24/7/365<br>
29
Average Truck Speed:
Geography Interstate System within the MPO Boundary<br>