
Using Power BI to Automate Data Cleaning and

Published  . 0 views
↓ Download
Using Power BI to Automate Data Cleaning and
1 / 1
Using Power BI to Automate Data Cleaning and - slide 1 of 35 Using Power BI to Automate Data Cleaning and - slide 2 of 35 Using Power BI to Automate Data Cleaning and - slide 3 of 35 Using Power BI to Automate Data Cleaning and - slide 4 of 35 Using Power BI to Automate Data Cleaning and - slide 5 of 35 Using Power BI to Automate Data Cleaning and - slide 6 of 35 Using Power BI to Automate Data Cleaning and - slide 7 of 35 Using Power BI to Automate Data Cleaning and - slide 8 of 35 Using Power BI to Automate Data Cleaning and - slide 9 of 35 Using Power BI to Automate Data Cleaning and - slide 10 of 35 Using Power BI to Automate Data Cleaning and - slide 11 of 35 Using Power BI to Automate Data Cleaning and - slide 12 of 35 Using Power BI to Automate Data Cleaning and - slide 13 of 35 Using Power BI to Automate Data Cleaning and - slide 14 of 35 Using Power BI to Automate Data Cleaning and - slide 15 of 35 Using Power BI to Automate Data Cleaning and - slide 16 of 35 Using Power BI to Automate Data Cleaning and - slide 17 of 35 Using Power BI to Automate Data Cleaning and - slide 18 of 35 Using Power BI to Automate Data Cleaning and - slide 19 of 35 Using Power BI to Automate Data Cleaning and - slide 20 of 35 Using Power BI to Automate Data Cleaning and - slide 21 of 35 Using Power BI to Automate Data Cleaning and - slide 22 of 35 Using Power BI to Automate Data Cleaning and - slide 23 of 35 Using Power BI to Automate Data Cleaning and - slide 24 of 35 Using Power BI to Automate Data Cleaning and - slide 25 of 35 Using Power BI to Automate Data Cleaning and - slide 26 of 35 Using Power BI to Automate Data Cleaning and - slide 27 of 35 Using Power BI to Automate Data Cleaning and - slide 28 of 35 Using Power BI to Automate Data Cleaning and - slide 29 of 35 Using Power BI to Automate Data Cleaning and - slide 30 of 35 Using Power BI to Automate Data Cleaning and - slide 31 of 35 Using Power BI to Automate Data Cleaning and - slide 32 of 35 Using Power BI to Automate Data Cleaning and - slide 33 of 35 Using Power BI to Automate Data Cleaning and - slide 34 of 35 Using Power BI to Automate Data Cleaning and - slide 35 of 35


Description: Using Power BI to Automate Data Cleaning and Visualization Chris Urban Assistant Director of Data Analytics Planning Analysis Frederick Burrack Director of Assessment Office of Assessment Visualizing Data through Interactive Reports in

Related Topics

Download Presentation

"Using Power BI to Automate Data Cleaning and" is the property of its rightful owner. Permission is granted to download and print the materials on this website for personal, non-commercial use only, and to display it on your personal computer provided you do not modify the materials and that you retain all copyright notices contained in the materials. By downloading content from our website, you accept the terms of this agreement.

Presentation Transcript

slide1. Using Power BI to Automate Data Cleaning and Visualization<br>
slide2. Chris Urban
Assistant Director of Data Analytics
Planning & Analysis Frederick Burrack
Director of Assessment
Office of Assessment<br>
slide3. Visualizing Data through Interactive Reports in Power BI<br>
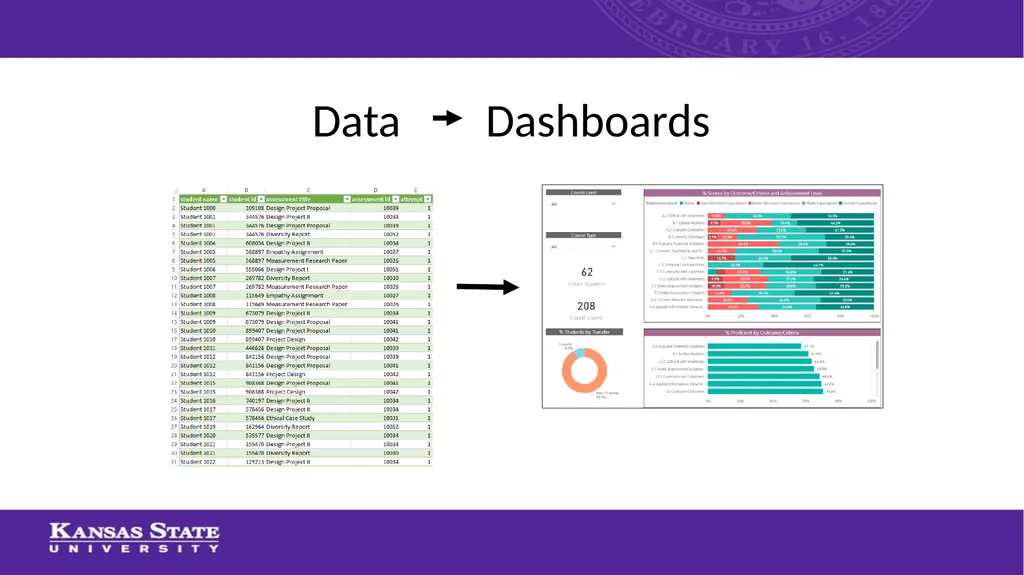
slide4. Data Dashboards<br>
slide7. Relational Data Modeling<br>
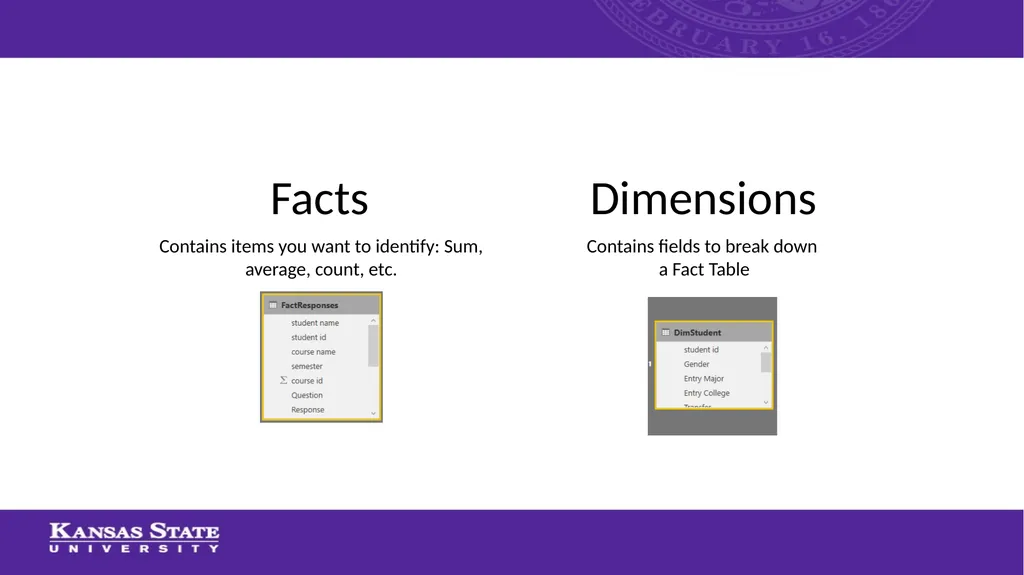
slide8. Facts Contains fields to break down a Fact Table Dimensions Contains items you want to identify: Sum, average, count, etc.<br>
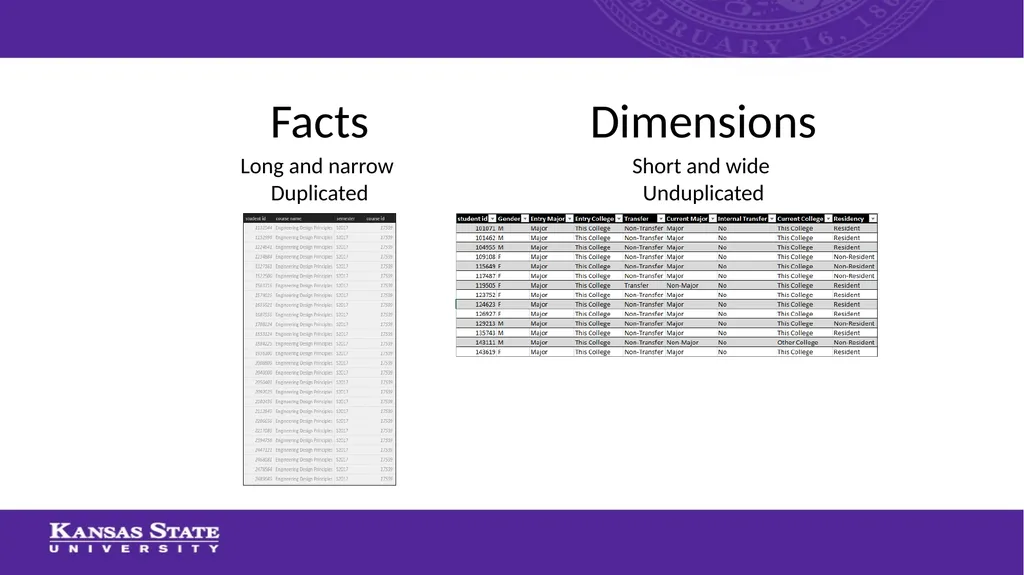
slide9. Long and narrow Duplicated Short and wide Unduplicated Facts Dimensions<br>
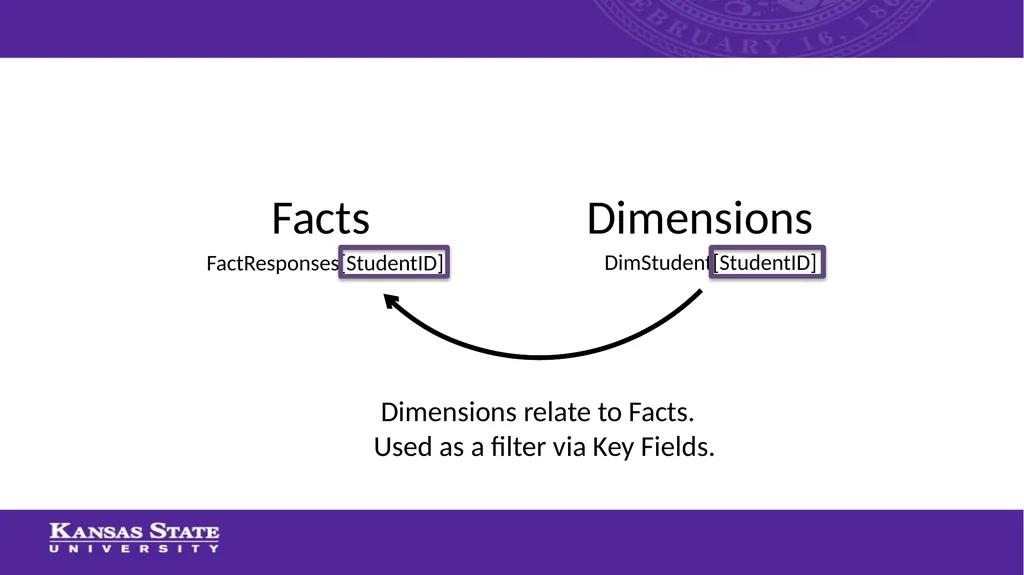
slide10. Facts FactResponses[StudentID] Dimensions DimStudent[StudentID] Dimensions relate to Facts.
Used as a filter via Key Fields.<br>
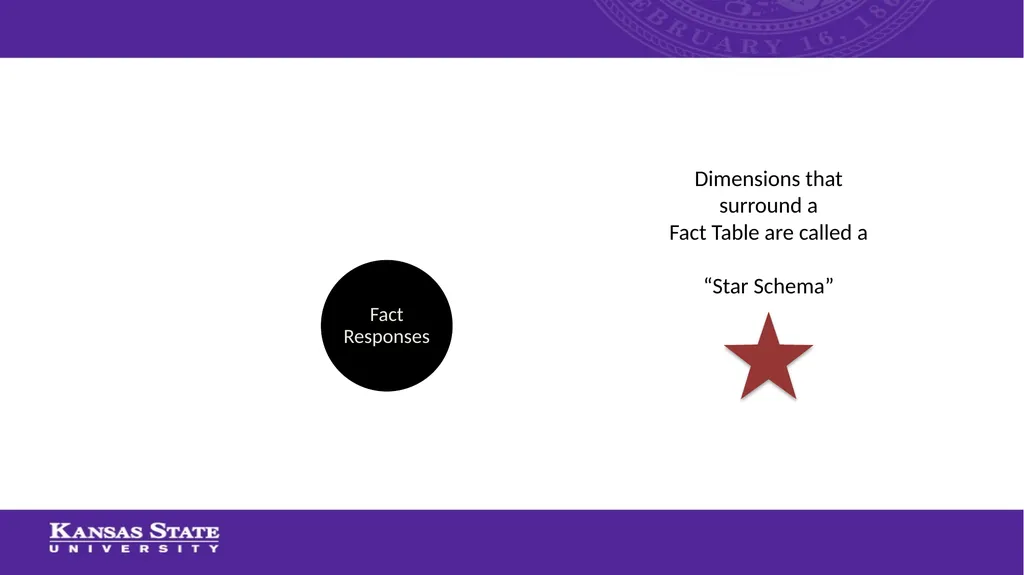
slide11. Dimensions that surround a
Fact Table are called a “Star Schema”<br>
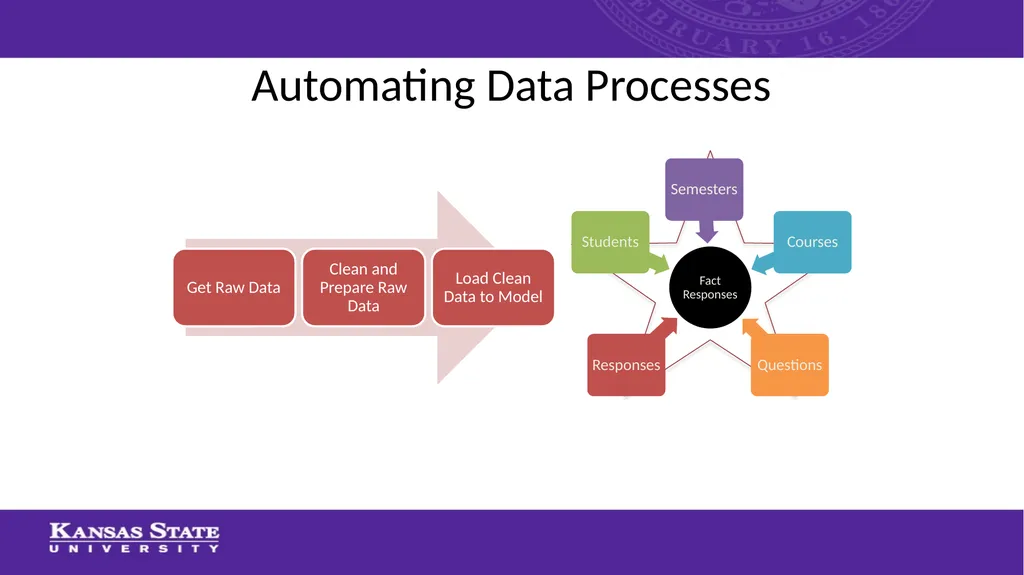
slide12. Automating Data Processes<br>
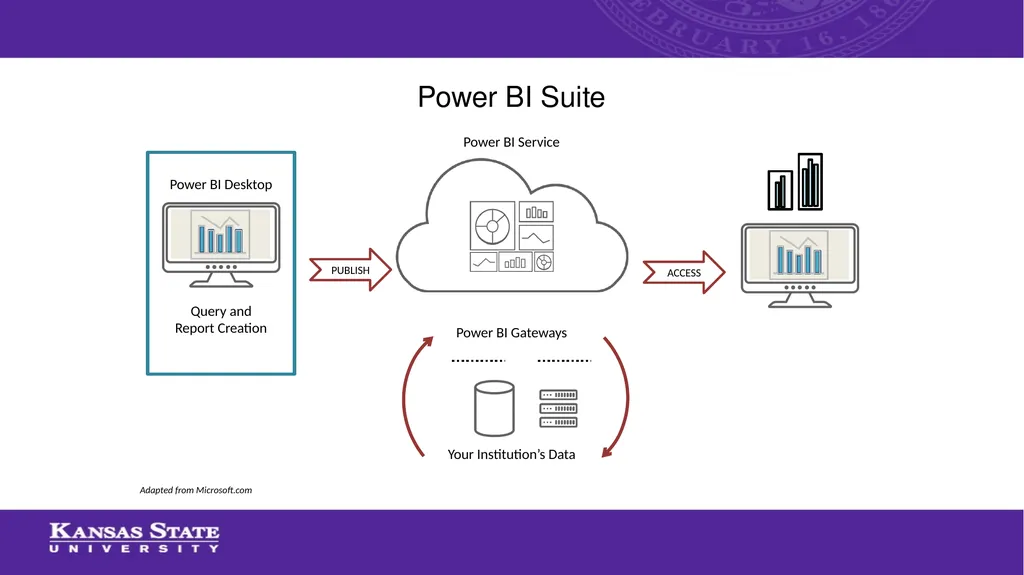
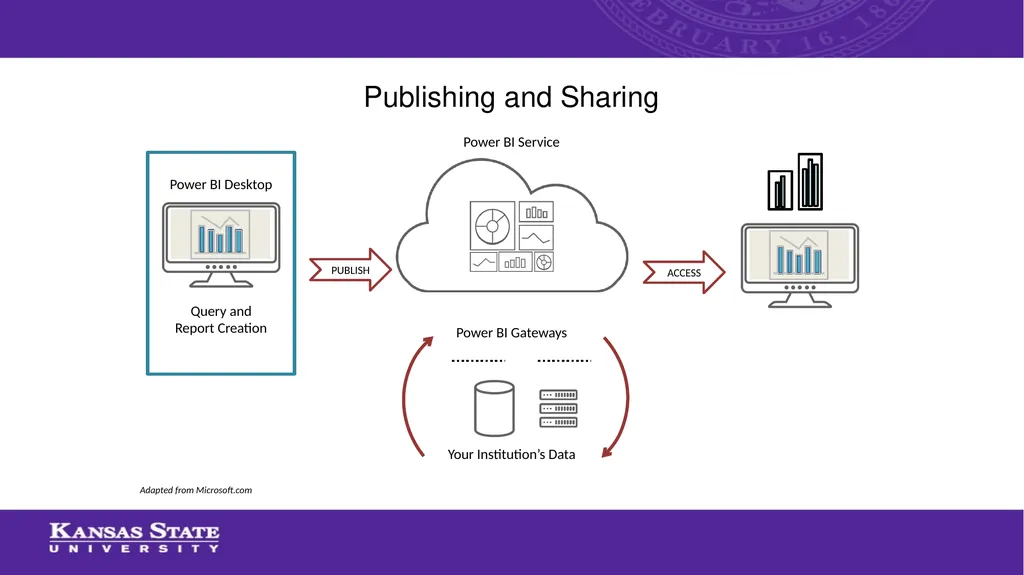
slide13. Power BI Suite Query and Report Creation Power BI Desktop Power BI Service Power BI Gateways Your Institution’s Data ACCESS PUBLISH Adapted from Microsoft.com<br>
slide14. Step-by-Step Demonstration<br>
slide19. An Introduction to DAX Data Analysis Expressions<br>
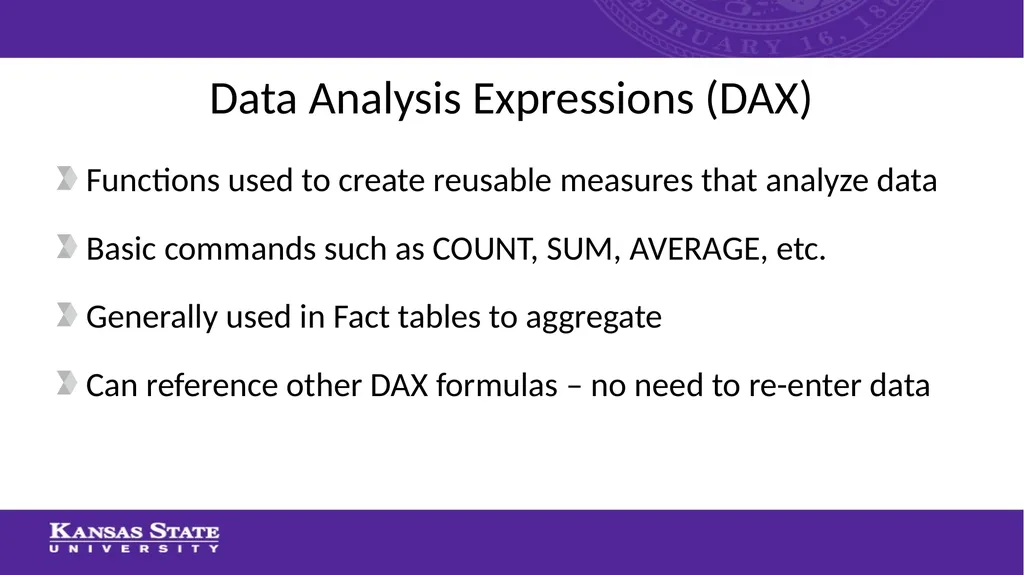
slide20. Data Analysis Expressions (DAX) Functions used to create reusable measures that analyze data
Basic commands such as COUNT, SUM, AVERAGE, etc.
Generally used in Fact tables to aggregate
Can reference other DAX formulas – no need to re-enter data<br>
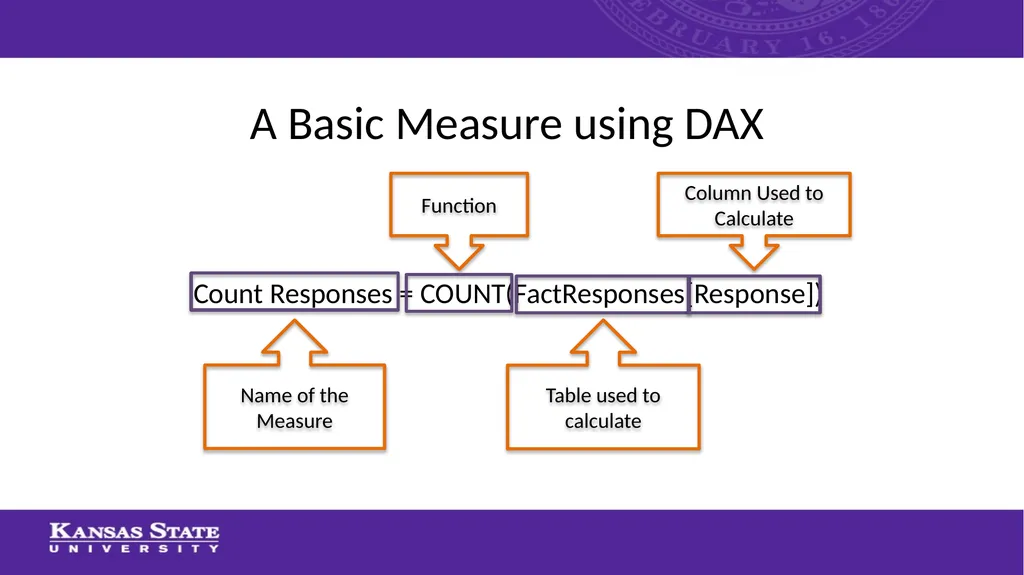
slide21. Count Responses = COUNT(FactResponses[Response]) Name of the Measure Function Table used to calculate Column Used to Calculate A Basic Measure using DAX<br>
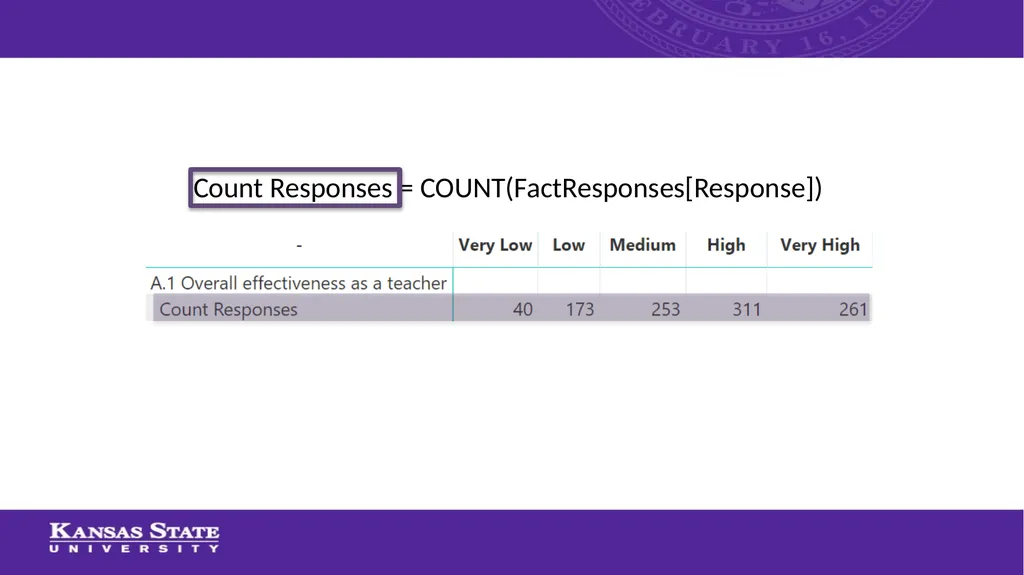
slide22. Count Responses = COUNT(FactResponses[Response])<br>
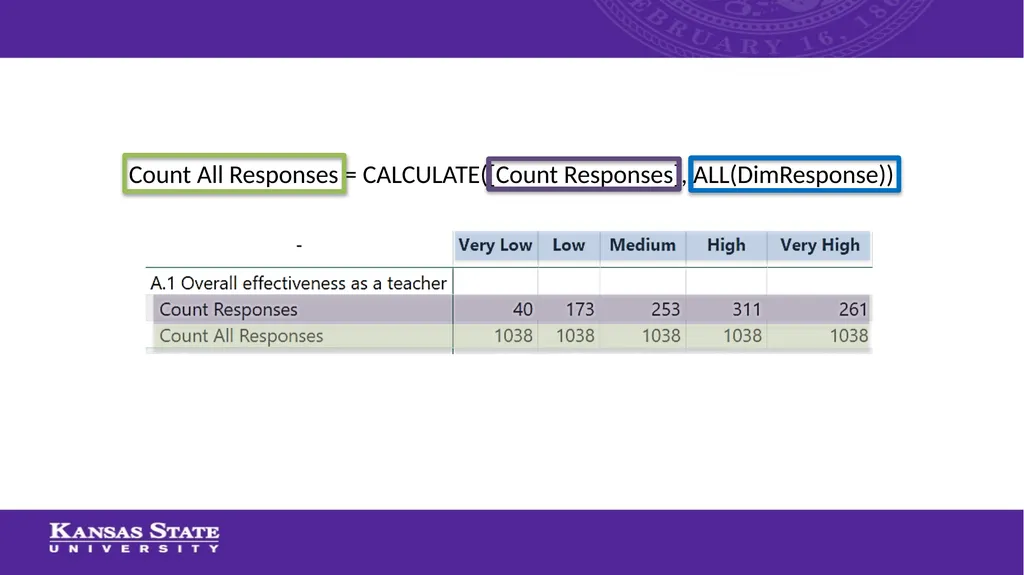
slide23. Count All Responses = CALCULATE([Count Responses], ALL(DimResponse))<br>
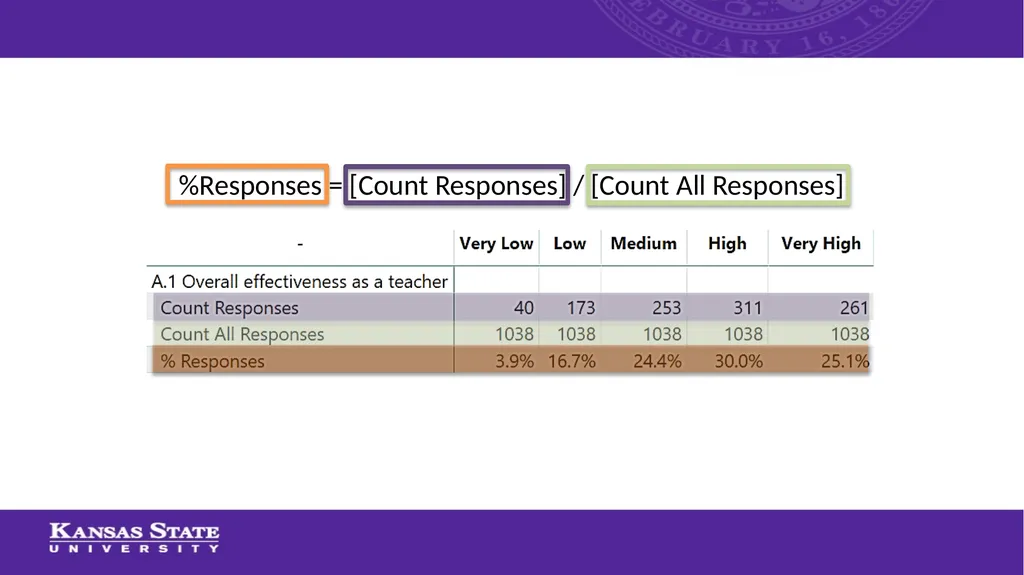
slide24. %Responses = [Count Responses] / [Count All Responses]<br>
slide25. Step-by-Step Demonstration<br>
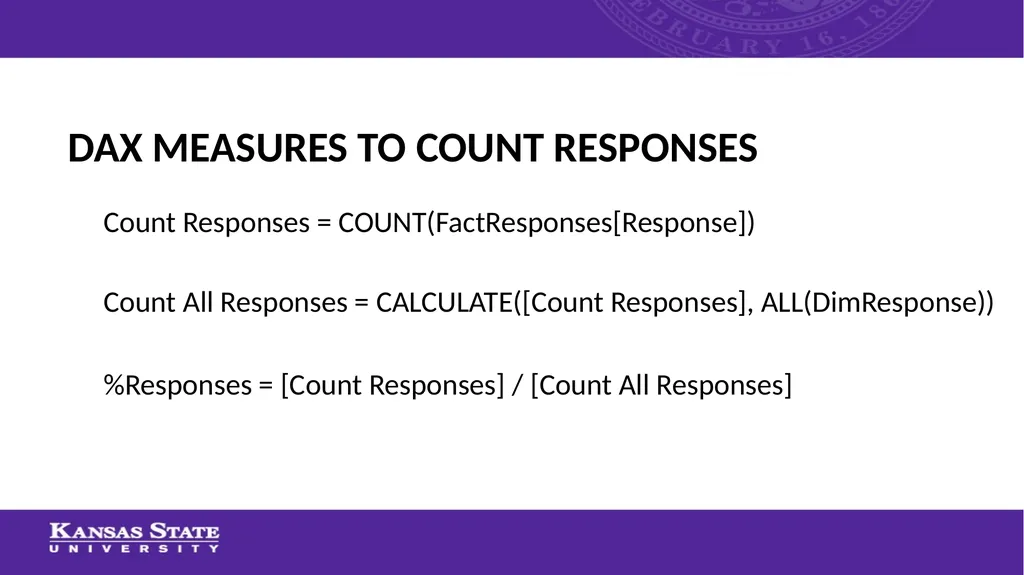
slide26. DAX Measures to count Responses Count Responses = COUNT(FactResponses[Response]) Count All Responses = CALCULATE([Count Responses], ALL(DimResponse)) %Responses = [Count Responses] / [Count All Responses]<br>
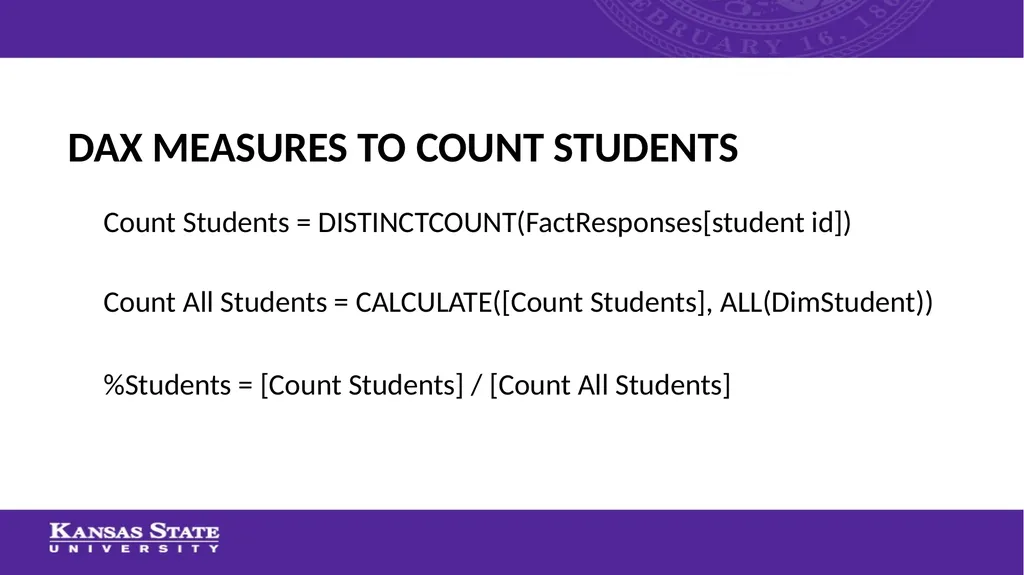
slide27. DAX Measures to count students Count Students = DISTINCTCOUNT(FactResponses[student id]) Count All Students = CALCULATE([Count Students], ALL(DimStudent)) %Students = [Count Students] / [Count All Students]<br>
slide28. Publishing and Sharing Query and Report Creation Power BI Desktop Power BI Service Power BI Gateways Your Institution’s Data ACCESS PUBLISH Adapted from Microsoft.com<br>
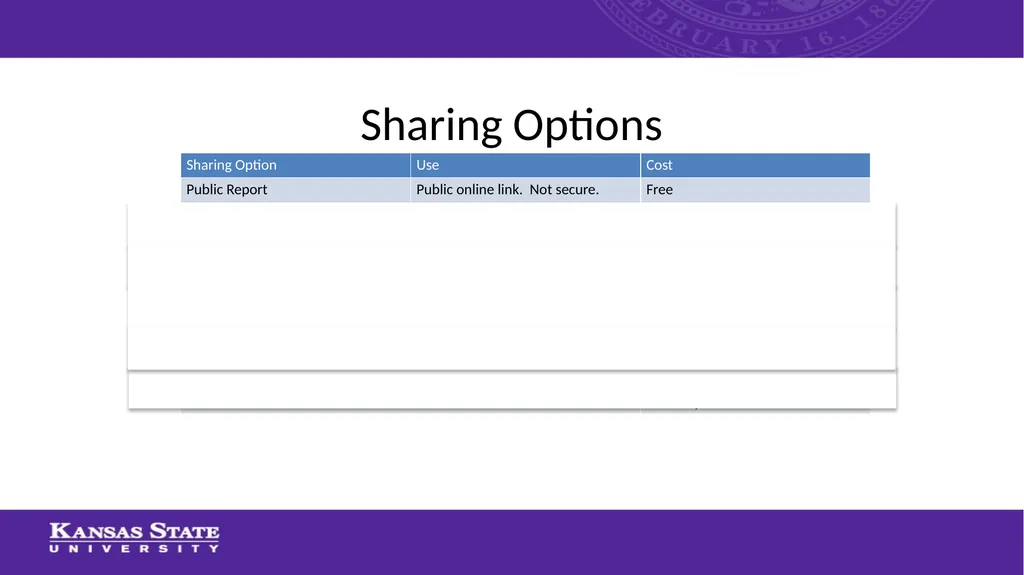
slide30. Sharing Options<br>
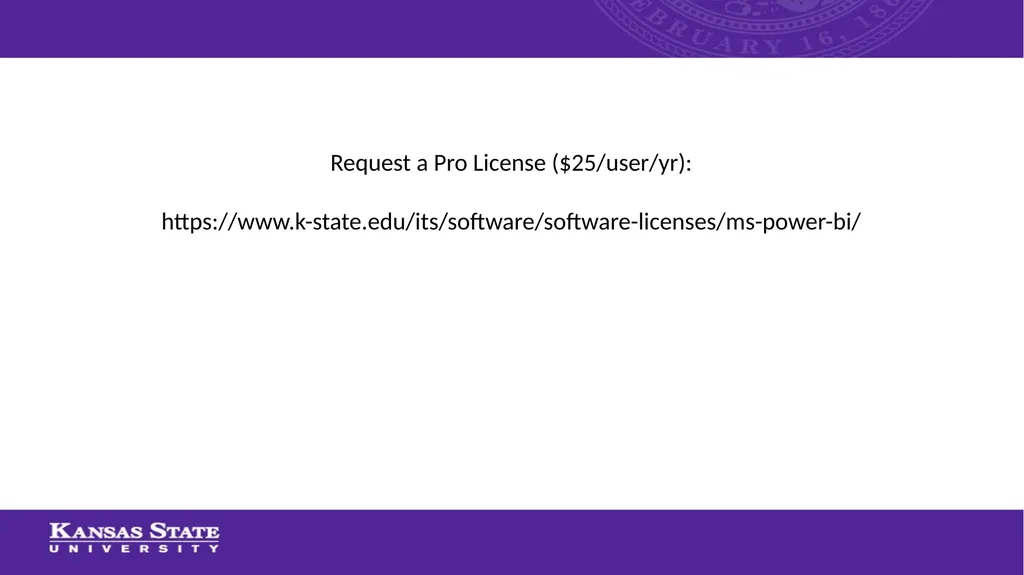
slide31. Request a Pro License ($25/user/yr): https://www.k-state.edu/its/software/software-licenses/ms-power-bi/<br>
slide32. K-State Power BI Users Group email Chuck Gould – chuck@ksu.edu K-State Power BI Slack Channel
ksupowerbi.slack.com<br>
slide33. What about the data warehouse?<br>
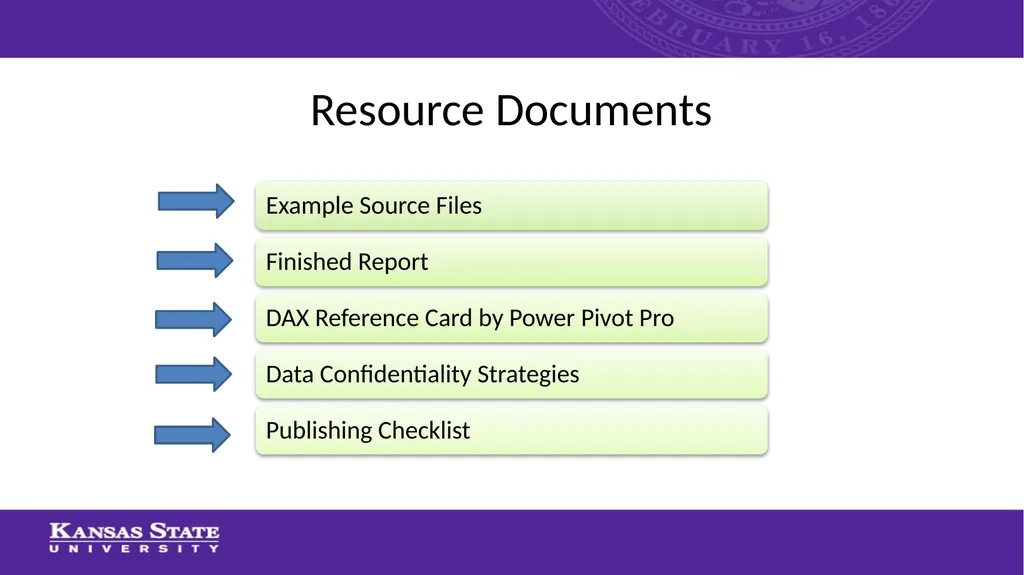
slide34. Resource Documents<br>
slide35. Questions & Discussion Using Power BI to Automate Data Cleaning and Visualization Thanks for coming!<br>