
USTITEM project – final version (Upstream






Description: USTITEM project final version (Upstream Satellites Technology Improvement Towards Enlarging Market, USTITEM) Mauro Aliano Martino Lo Cascio FUET team 1 Contents Market overview and Thales Alenia Spazio USTITEM project and matrix
Related Topics
Download Presentation
"USTITEM project – final version (Upstream" is the property of its rightful owner. Permission is granted to download and print the materials on this website for personal, non-commercial use only, and to display it on your personal computer provided you do not modify the materials and that you retain all copyright notices contained in the materials. By downloading content from our website, you accept the terms of this agreement.
Presentation Transcript
slide1. USTITEM project – final version
(Upstream Satellites Technology Improvement Towards Enlarging Market, USTITEM) Mauro Aliano
Martino Lo Cascio
FUET team 1<br>
slide2. Contents Market overview and Thales Alenia Spazio
USTITEM project and matrix hypotheses
Other assumptions
Prudential approach and measures
State and region aids
Additional results
Sensitive analysis
Impact of state contribution
Overview for next operational steps to develop 2<br>
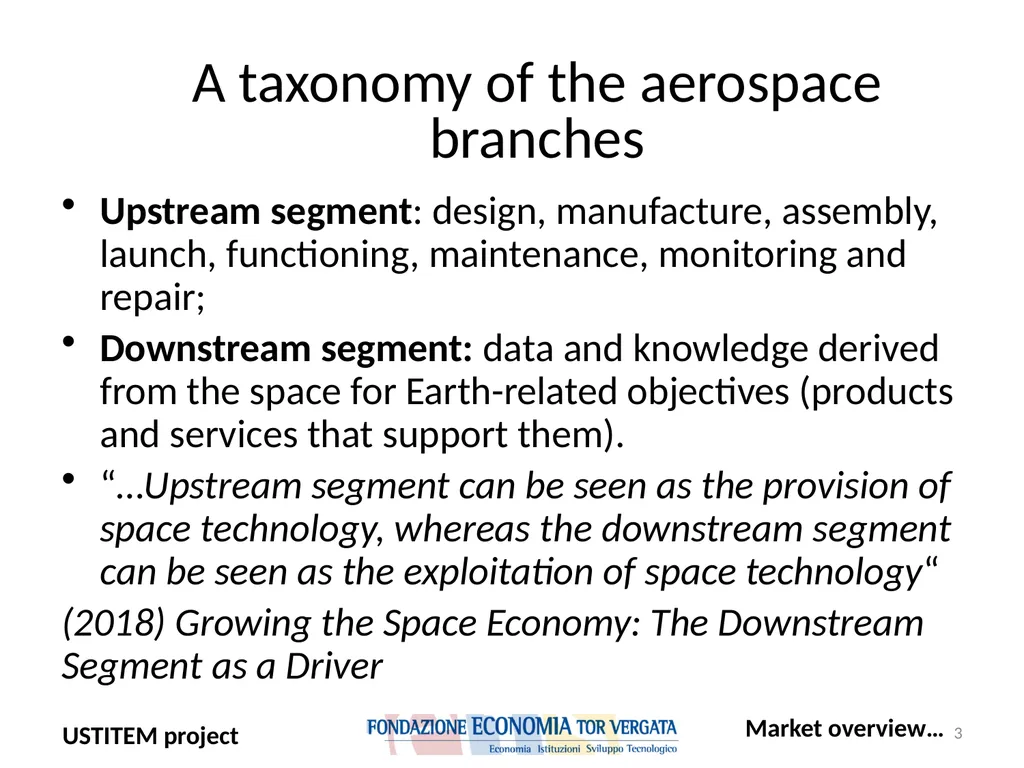
slide3. Upstream segment: design, manufacture, assembly, launch, functioning, maintenance, monitoring and repair;
Downstream segment: data and knowledge derived from the space for Earth-related objectives (products and services that support them).
“…Upstream segment can be seen as the provision of space technology, whereas the downstream segment can be seen as the exploitation of space technology“
(2018) Growing the Space Economy: The Downstream Segment as a Driver 3 A taxonomy of the aerospace branches Market overview…<br>
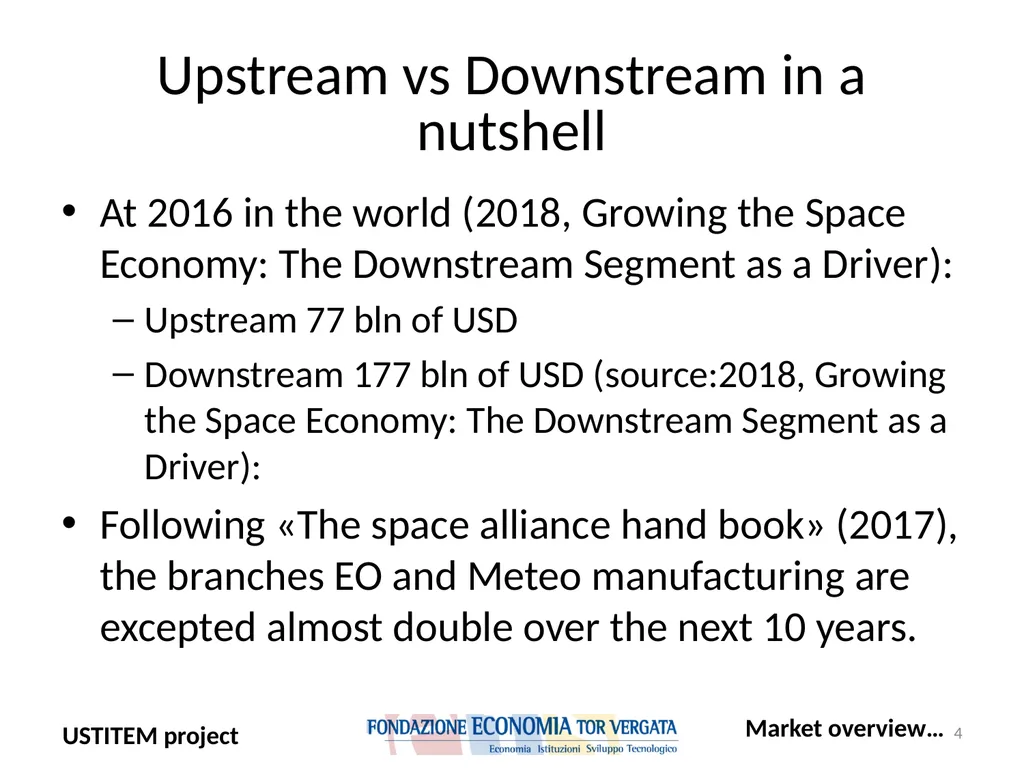
slide4. At 2016 in the world (2018, Growing the Space Economy: The Downstream Segment as a Driver):
Upstream 77 bln of USD
Downstream 177 bln of USD (source:2018, Growing the Space Economy: The Downstream Segment as a Driver):
Following «The space alliance hand book» (2017), the branches EO and Meteo manufacturing are excepted almost double over the next 10 years. 4 Upstream vs Downstream in a nutshell Market overview…<br>
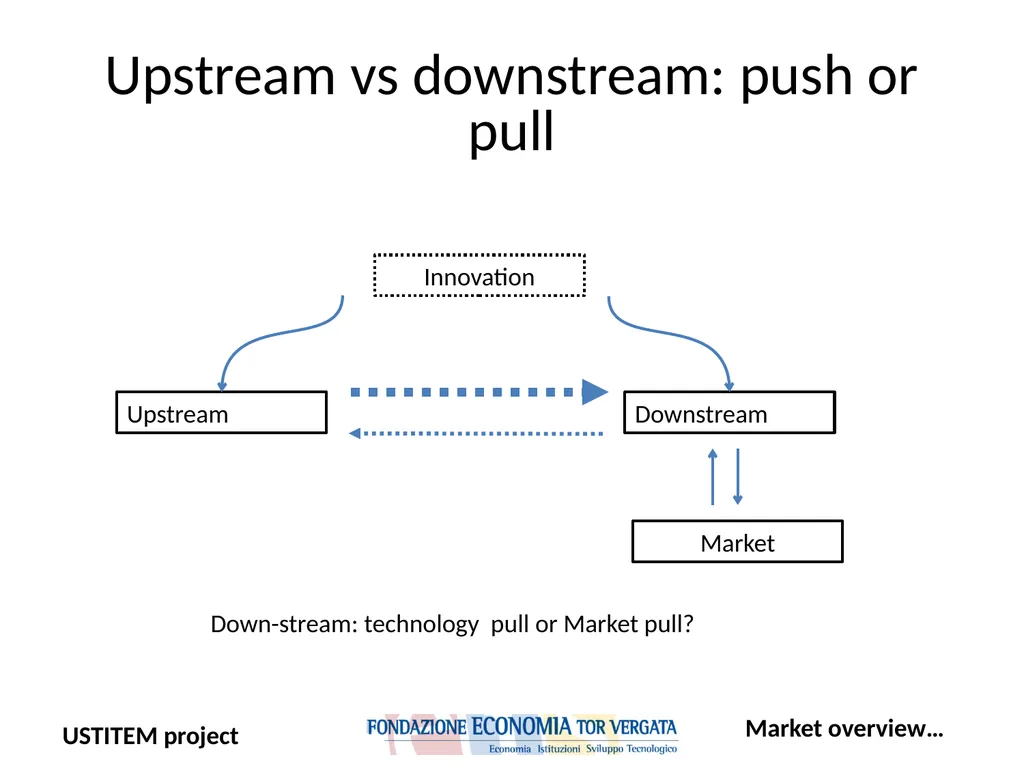
slide5. Upstream vs downstream: push or pull Upstream Downstream Innovation Down-stream: technology pull or Market pull? Market Market overview…<br>
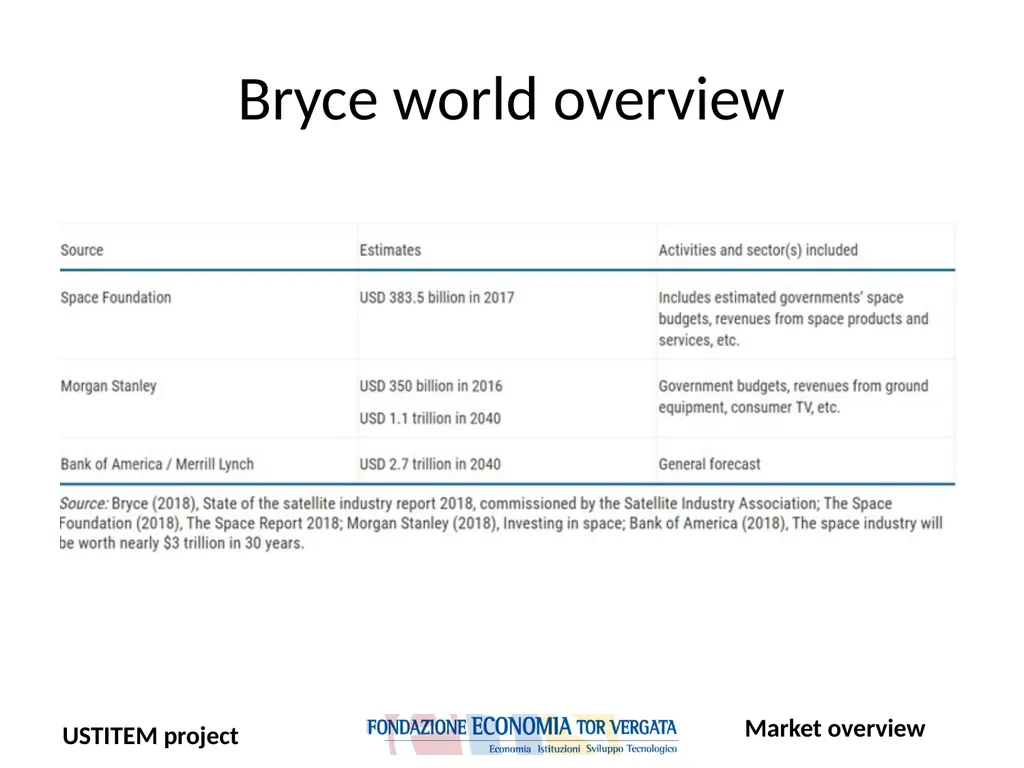
slide6. Bryce world overview Market overview<br>
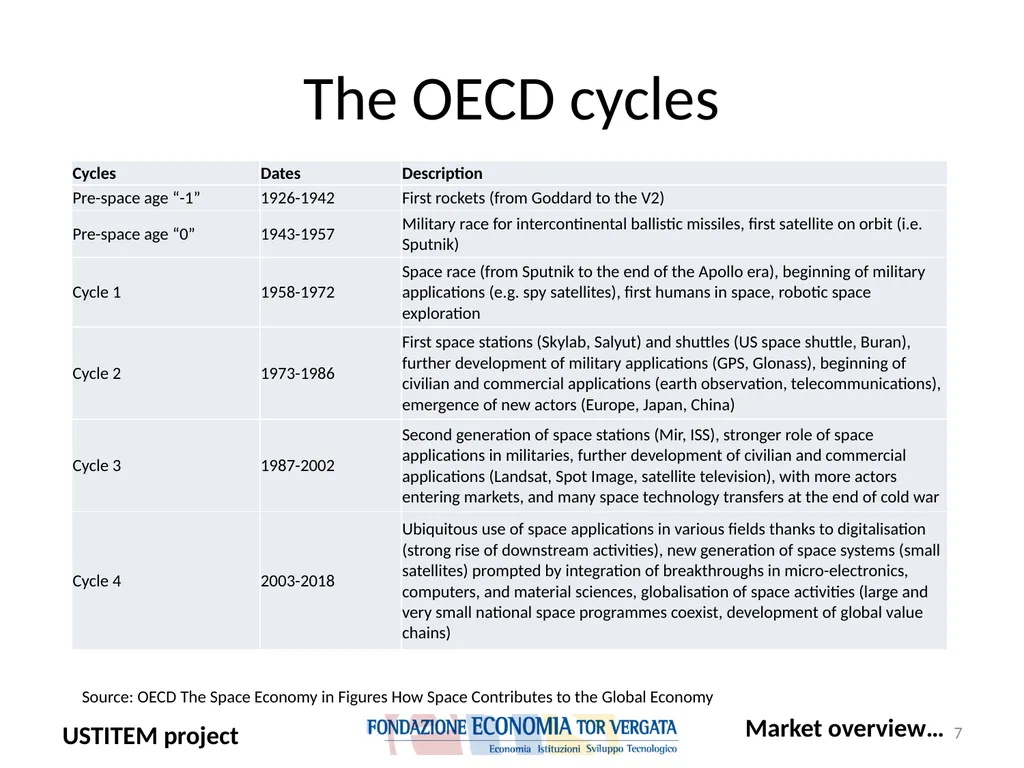
slide7. 7 The OECD cycles Source: OECD The Space Economy in Figures How Space Contributes to the Global Economy Market overview…<br>
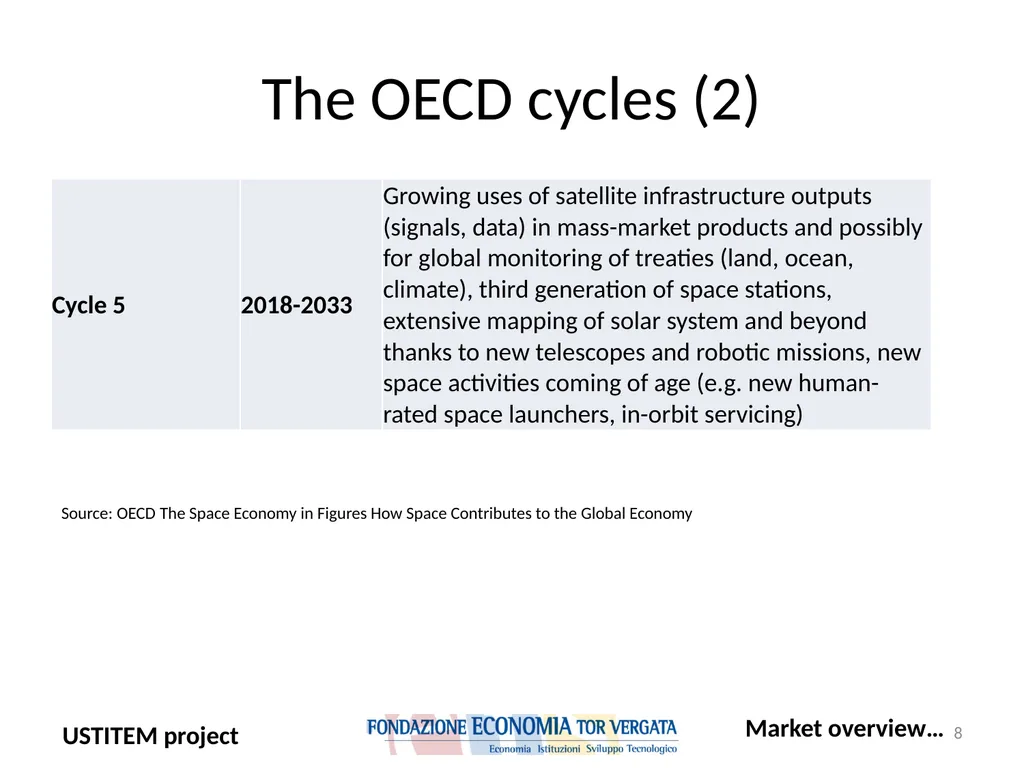
slide8. 8 The OECD cycles (2) Source: OECD The Space Economy in Figures How Space Contributes to the Global Economy Market overview…<br>
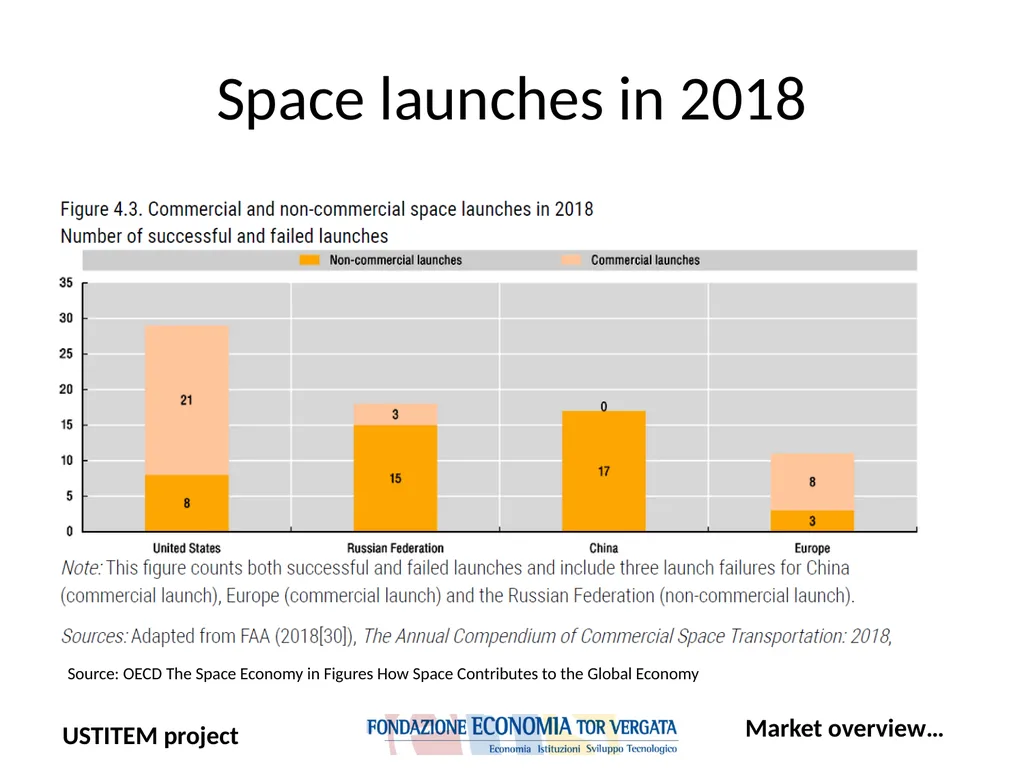
slide9. Space launches in 2018 Source: OECD The Space Economy in Figures How Space Contributes to the Global Economy Market overview…<br>
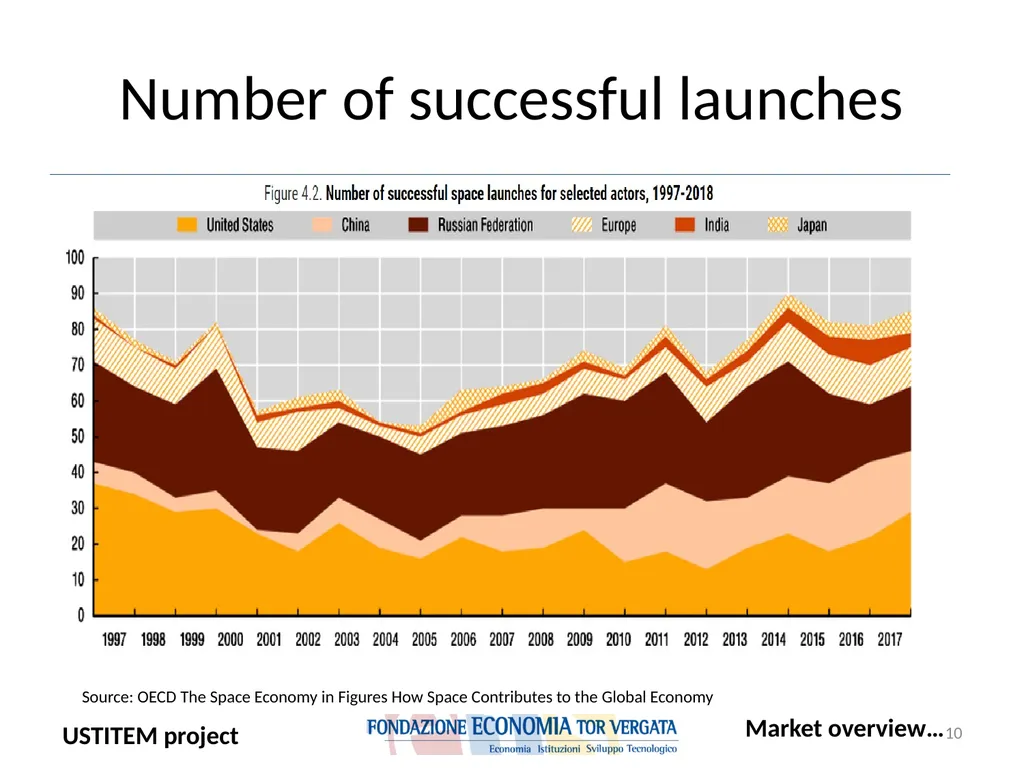
slide10. 10 Number of successful launches Source: OECD The Space Economy in Figures How Space Contributes to the Global Economy Market overview…<br>
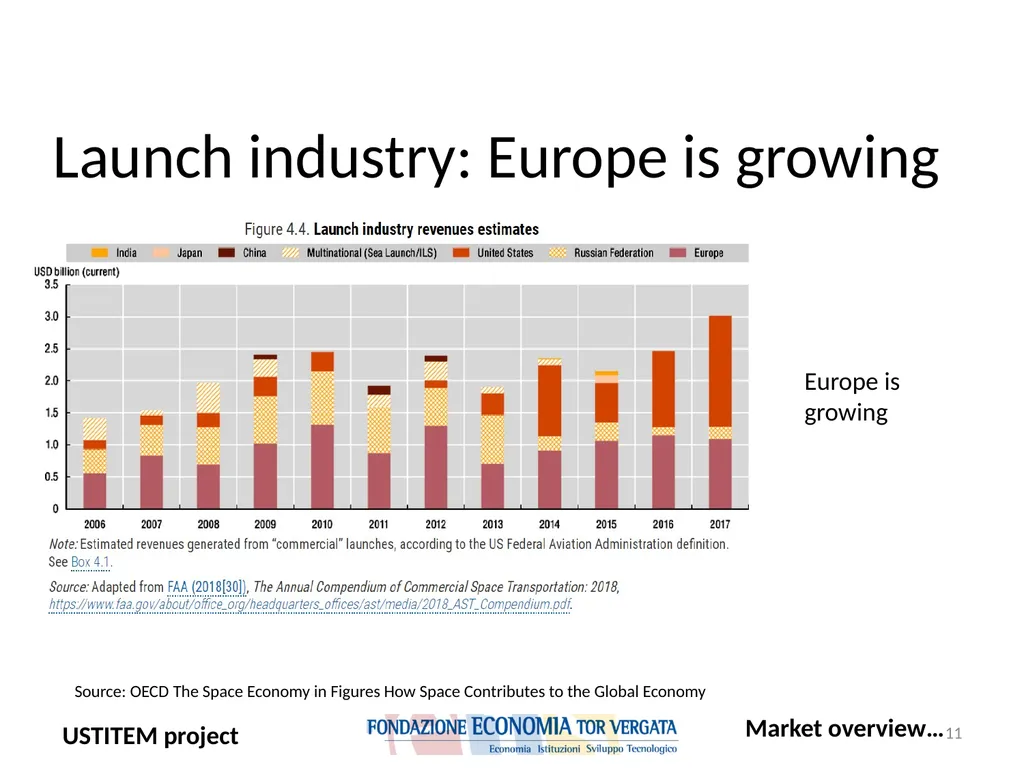
slide11. 11 Launch industry: Europe is growing Source: OECD The Space Economy in Figures How Space Contributes to the Global Economy Market overview… Europe is
growing<br>
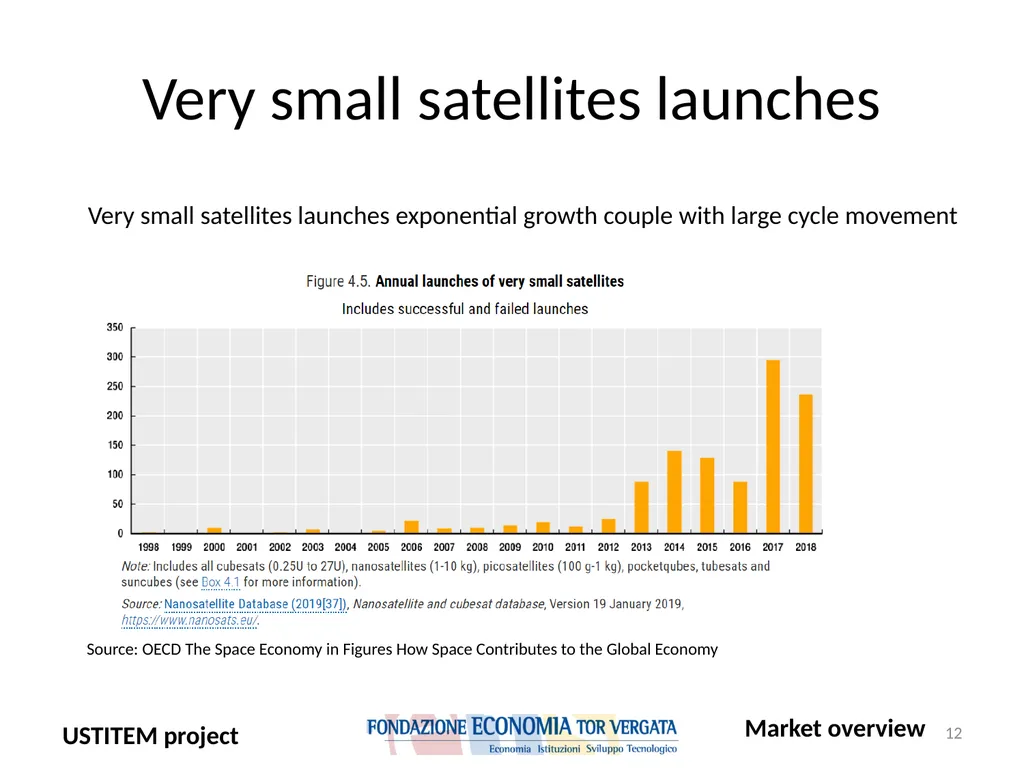
slide12. 12 Very small satellites launches Source: OECD The Space Economy in Figures How Space Contributes to the Global Economy Market overview Very small satellites launches exponential growth couple with large cycle movement<br>
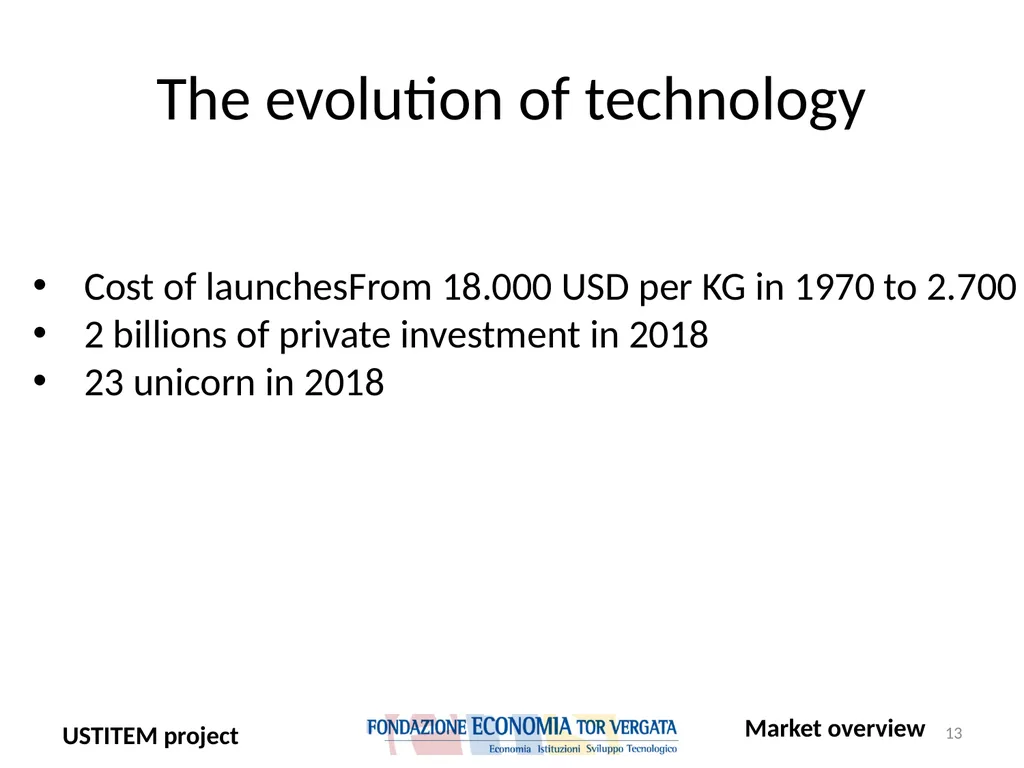
slide13. 13 The evolution of technology Market overview Cost of launchesFrom 18.000 USD per KG in 1970 to 2.700 per KG in 2018
2 billions of private investment in 2018
23 unicorn in 2018<br>
slide14. Cost of launches: from 18.000 USD per KG in 1970 to 2.700 per KG in 2018;
2 billions of private investment in 2018
23 unicorn in 2018. 14 The evolution of technology Market overview<br>
slide15. Order book: 32.3 mln of euro
Order in take: 16 bln of euro
Sales: 15 bln of euro
EBITDA: 1, 68 bln of euro 15 Thales group key figures Market overview<br>
slide16. Total revenues (2018): 707.31 mln of euro
Profit (2018): 32 mln of euro (28 in 2016 and 24 in 2017)
Magnitude order by which the USTITEM project must be evaluated: from 9% to 25% of 2016 – 2018 period profit. 16 Thales Alenia Italia spa Market overview<br>
slide17. Order in take: 9.6 bn of euro
Revenues: 12.4 bn of euro
EBITDA: 510 mln of euro 17 Leonardo key figures<br>
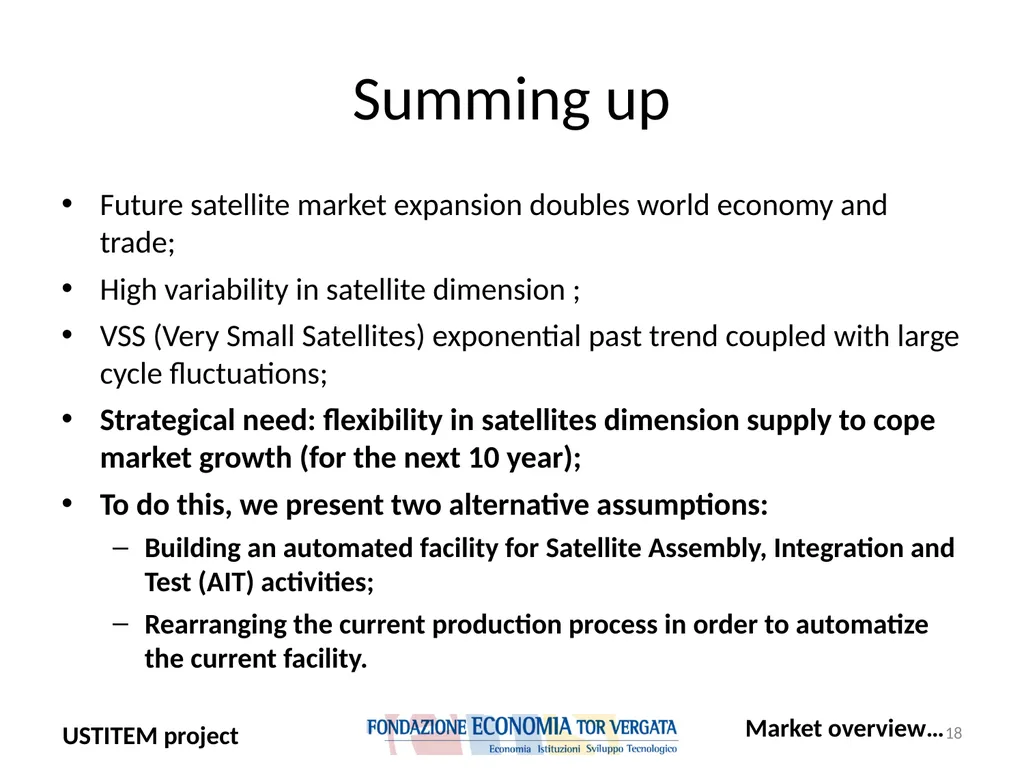
slide18. Future satellite market expansion doubles world economy and trade;
High variability in satellite dimension ;
VSS (Very Small Satellites) exponential past trend coupled with large cycle fluctuations;
Strategical need: flexibility in satellites dimension supply to cope market growth (for the next 10 year);
To do this, we present two alternative assumptions:
Building an automated facility for Satellite Assembly, Integration and Test (AIT) activities;
Rearranging the current production process in order to automatize the current facility. 18 Summing up Market overview…<br>
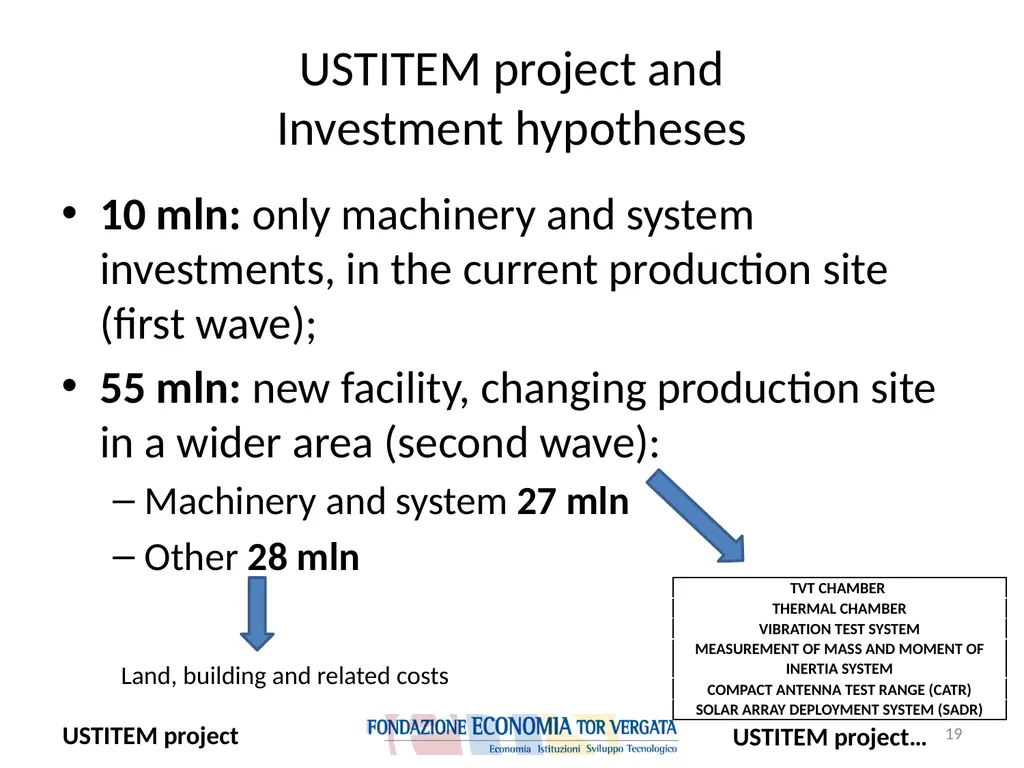
slide19. USTITEM project and Investment hypotheses 10 mln: only machinery and system investments, in the current production site (first wave);
55 mln: new facility, changing production site in a wider area (second wave):
Machinery and system 27 mln
Other 28 mln Land, building and related costs 19 USTITEM project…<br>
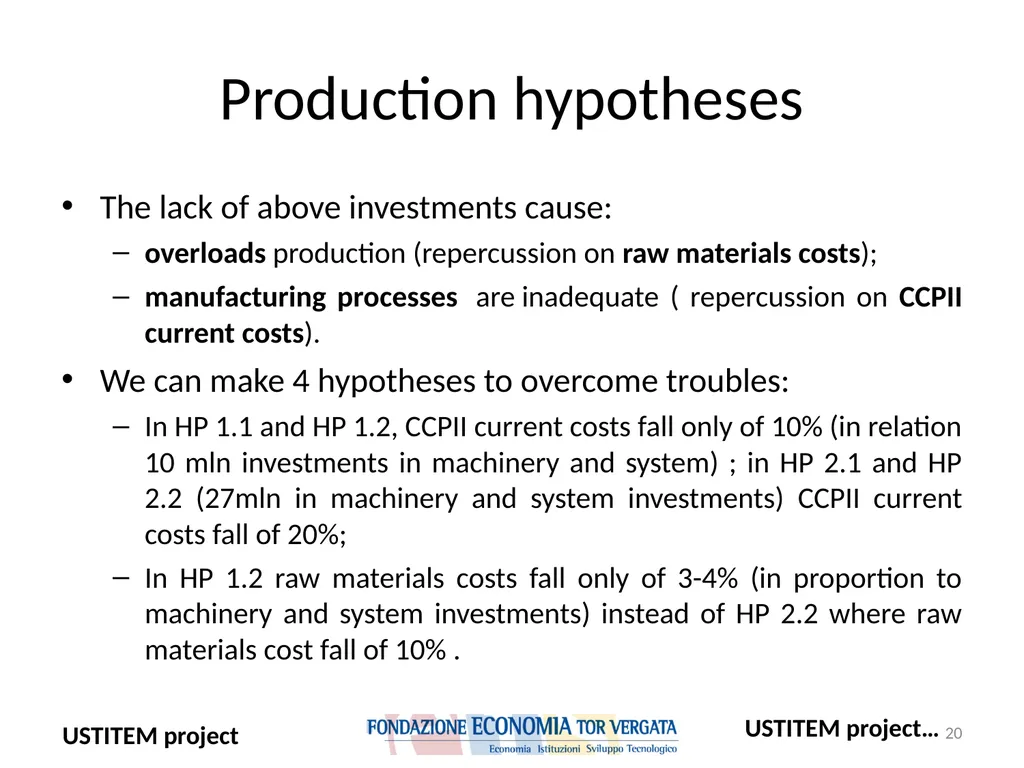
slide20. Production hypotheses The lack of above investments cause:
overloads production (repercussion on raw materials costs);
manufacturing processes are inadequate ( repercussion on CCPII current costs).
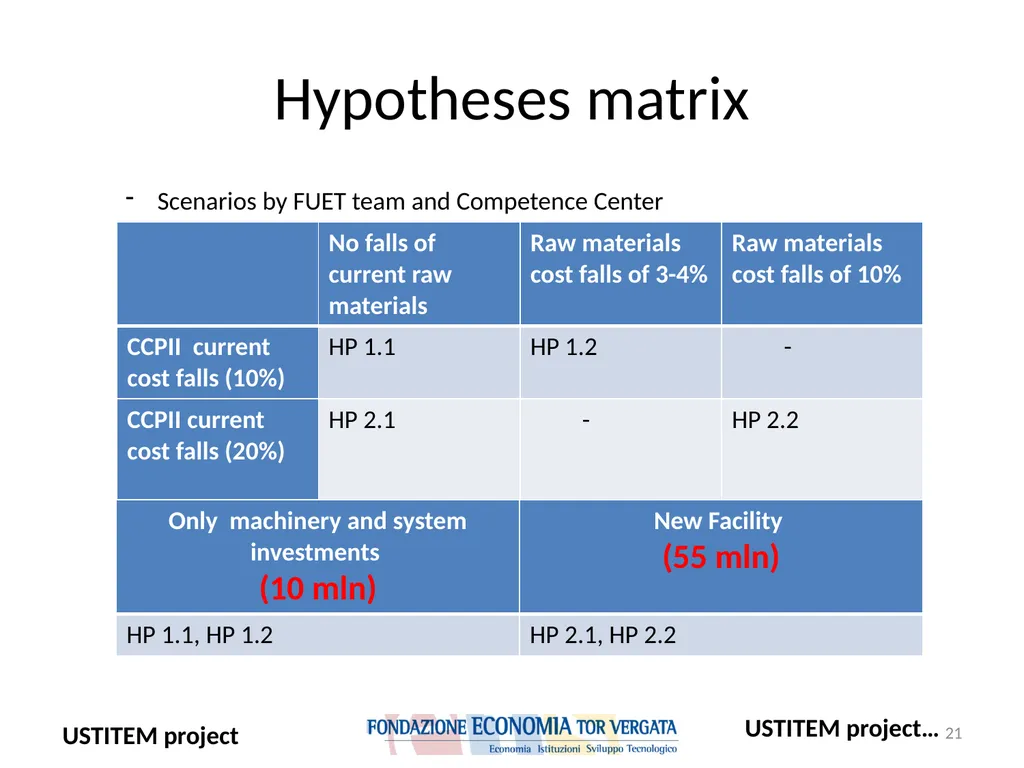
We can make 4 hypotheses to overcome troubles:
In HP 1.1 and HP 1.2, CCPII current costs fall only of 10% (in relation 10 mln investments in machinery and system) ; in HP 2.1 and HP 2.2 (27mln in machinery and system investments) CCPII current costs fall of 20%;
In HP 1.2 raw materials costs fall only of 3-4% (in proportion to machinery and system investments) instead of HP 2.2 where raw materials cost fall of 10% . 20 USTITEM project…<br>
slide21. Hypotheses matrix Scenarios by FUET team and Competence Center 21 USTITEM project…<br>
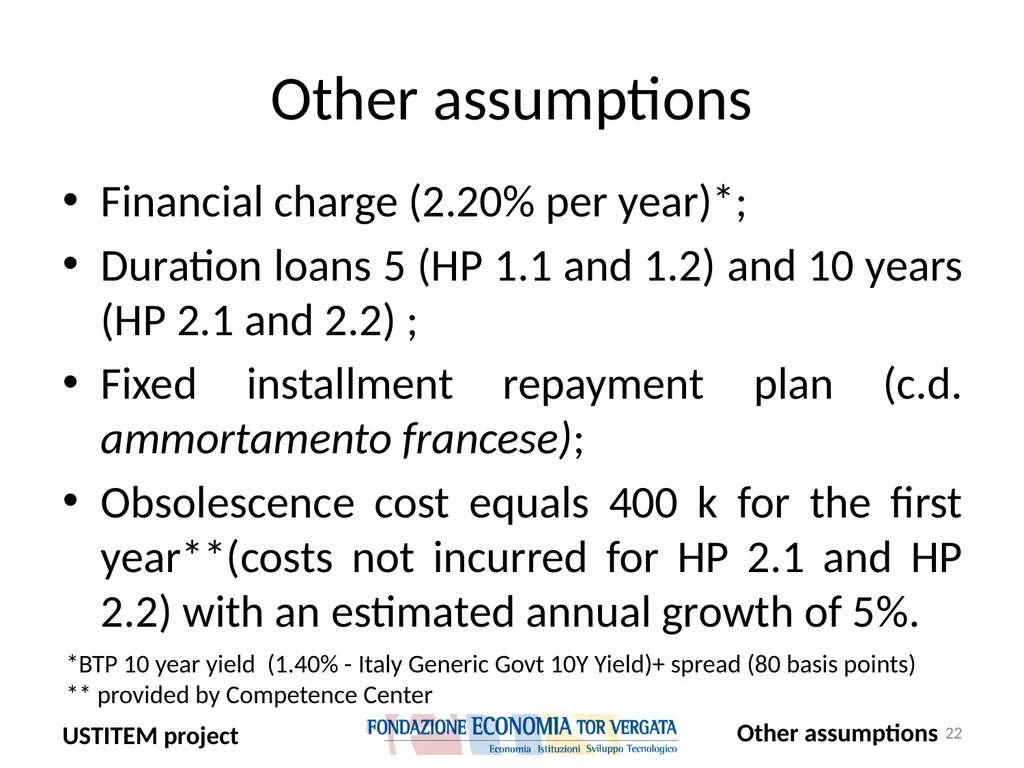
slide22. Other assumptions Financial charge (2.20% per year)*;
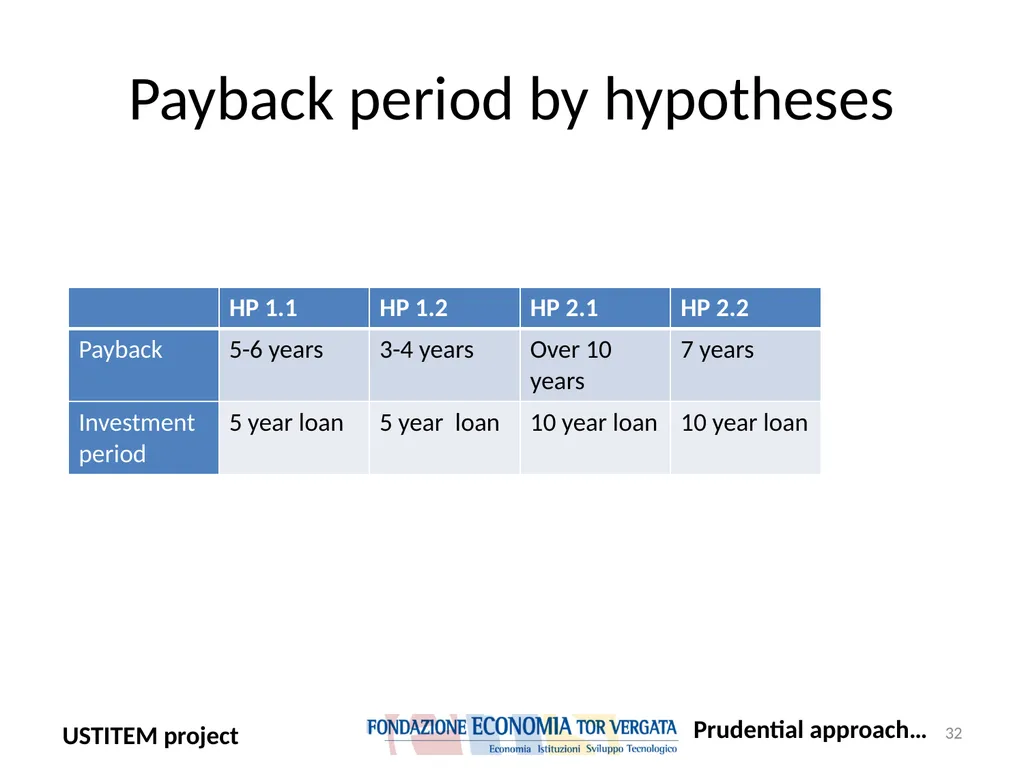
Duration loans 5 (HP 1.1 and 1.2) and 10 years (HP 2.1 and 2.2) ;
Fixed installment repayment plan (c.d. ammortamento francese);
Obsolescence cost equals 400 k for the first year**(costs not incurred for HP 2.1 and HP 2.2) with an estimated annual growth of 5%. *BTP 10 year yield (1.40% - Italy Generic Govt 10Y Yield)+ spread (80 basis points)
** provided by Competence Center 22 Other assumptions<br>
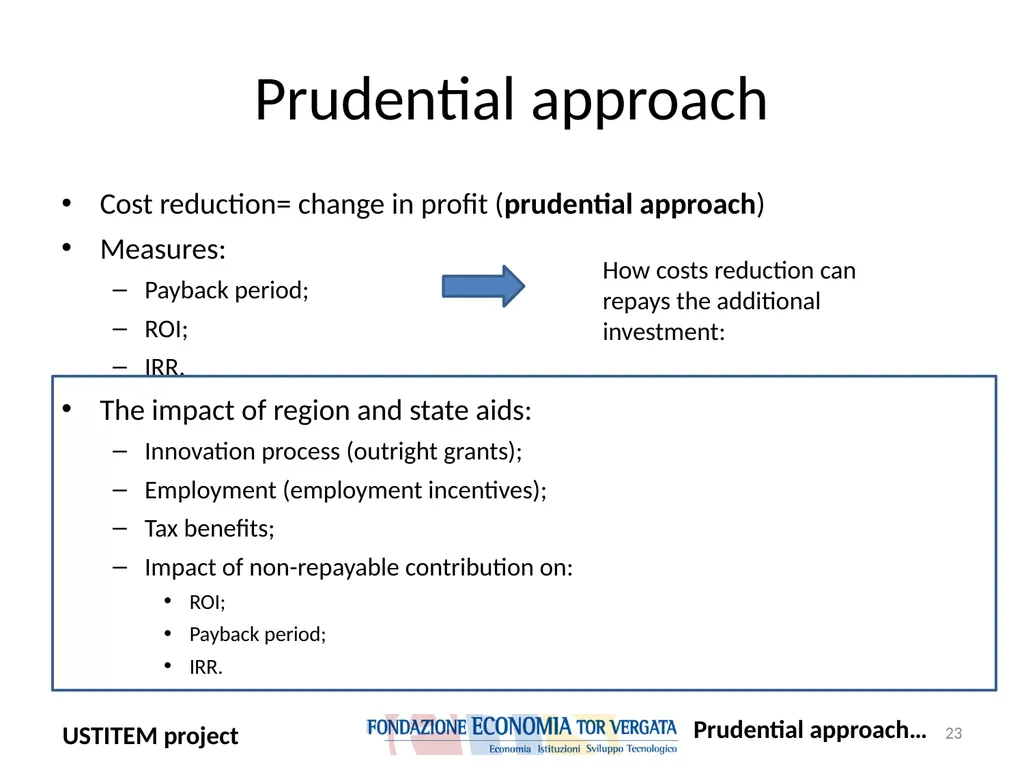
slide23. Prudential approach Cost reduction= change in profit (prudential approach)
Measures:
Payback period;
ROI;
IRR.
The impact of region and state aids:
Innovation process (outright grants);
Employment (employment incentives);
Tax benefits;
Impact of non-repayable contribution on:
ROI;
Payback period;
IRR. 23 Prudential approach… How costs reduction can repays the additional investment:<br>
slide24. Savings and payback period HP 1.2 ROI (annualized) = 5-6% Cumulative savings (mln di euro) Cumulative savings (mln di euro) 24 Prudential approach…<br>
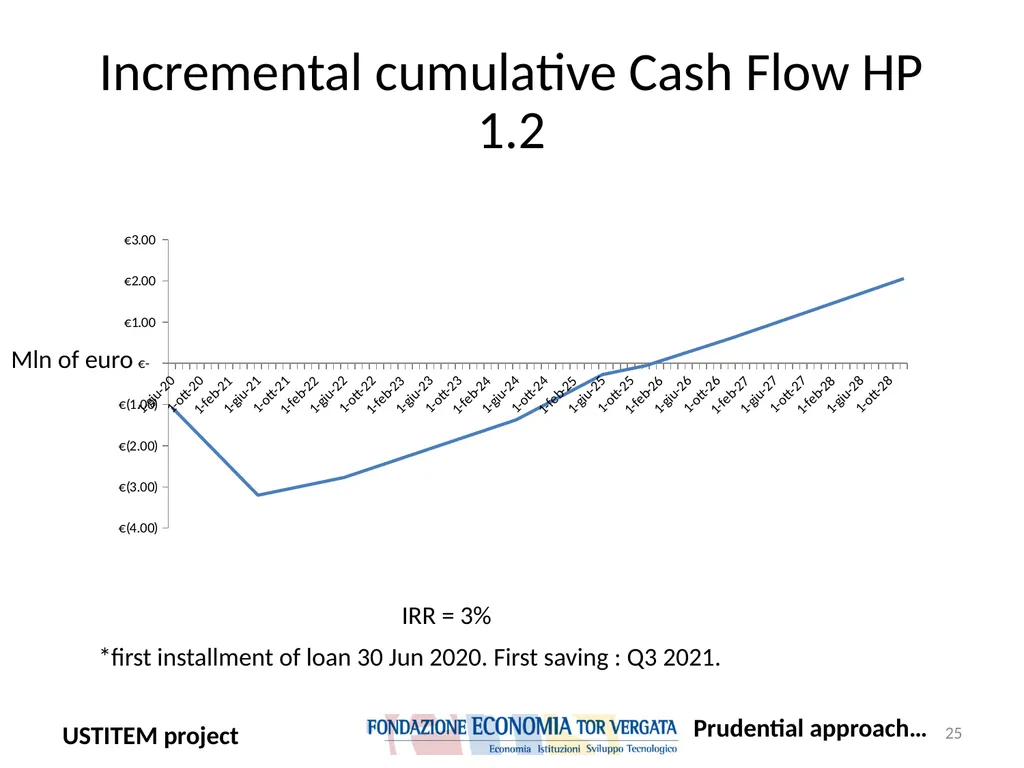
slide25. Incremental cumulative Cash Flow HP 1.2 25 IRR = 3% *first installment of loan 30 Jun 2020. First saving : Q3 2021. Prudential approach… Mln of euro<br>
slide26. Savings and payback period HP 2.2 Cumulative savings Cumulative savings ROI (annualized) = 7%*
*% of residual value of new facility after 10 years : 80% 26 Prudential approach…<br>
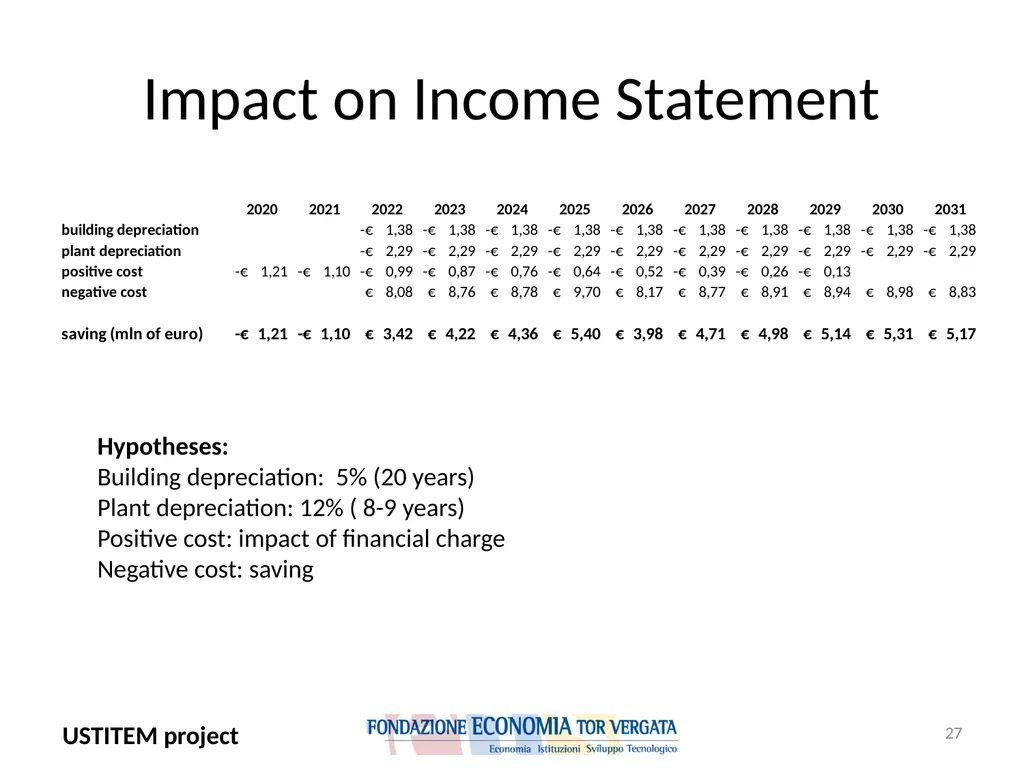
slide27. 27 Impact on Income Statement Hypotheses:
Building depreciation: 5% (20 years)
Plant depreciation: 12% ( 8-9 years)
Positive cost: impact of financial charge
Negative cost: saving<br>
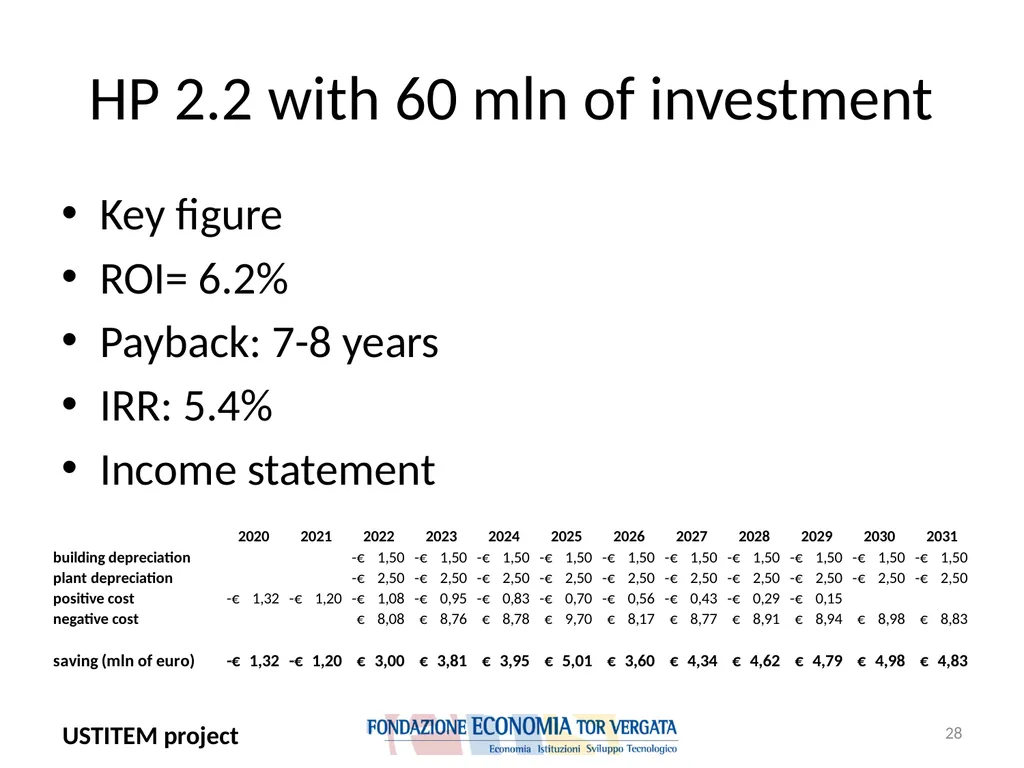
slide28. Key figure
ROI= 6.2%
Payback: 7-8 years
IRR: 5.4%
Income statement 28 HP 2.2 with 60 mln of investment<br>
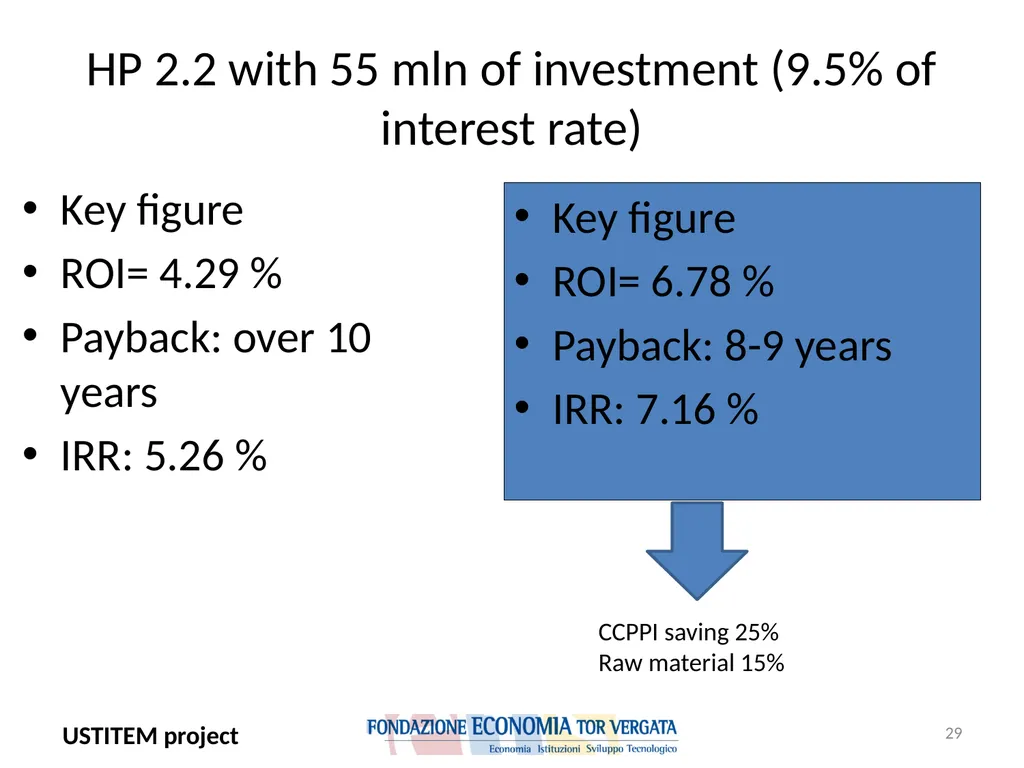
slide29. Key figure
ROI= 4.29 %
Payback: over 10 years
IRR: 5.26 % 29 HP 2.2 with 55 mln of investment (9.5% of interest rate) Key figure
ROI= 6.78 %
Payback: 8-9 years
IRR: 7.16 % CCPPI saving 25%
Raw material 15%<br>
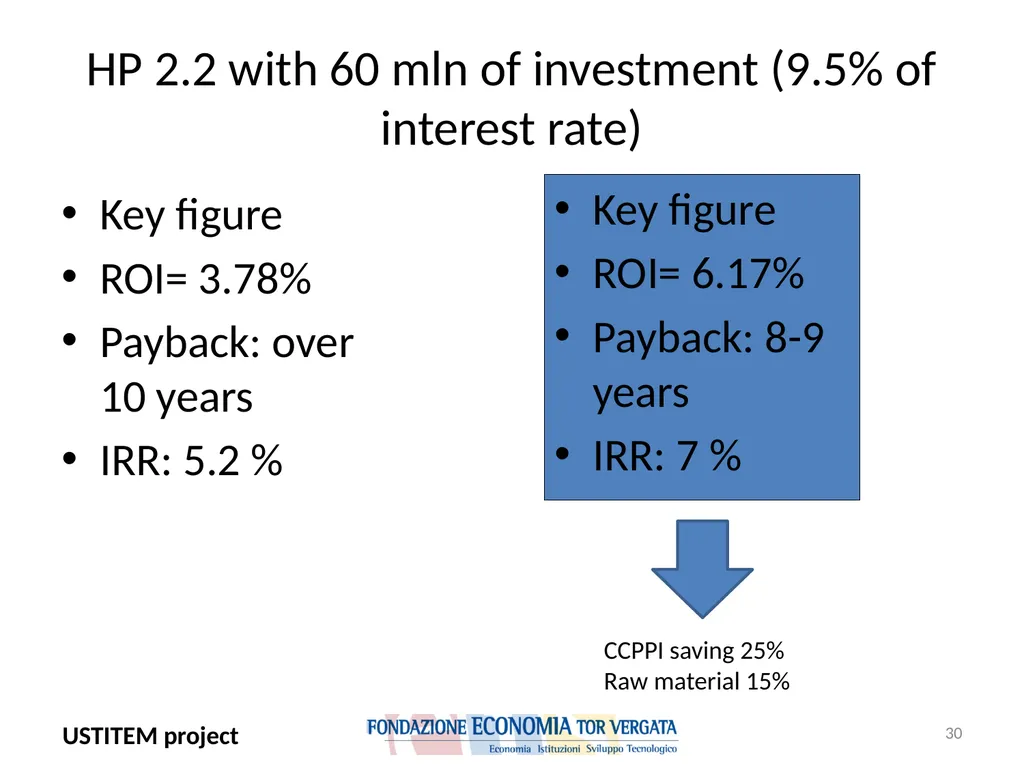
slide30. Key figure
ROI= 3.78%
Payback: over 10 years
IRR: 5.2 % 30 HP 2.2 with 60 mln of investment (9.5% of interest rate) Key figure
ROI= 6.17%
Payback: 8-9 years
IRR: 7 % CCPPI saving 25%
Raw material 15%<br>
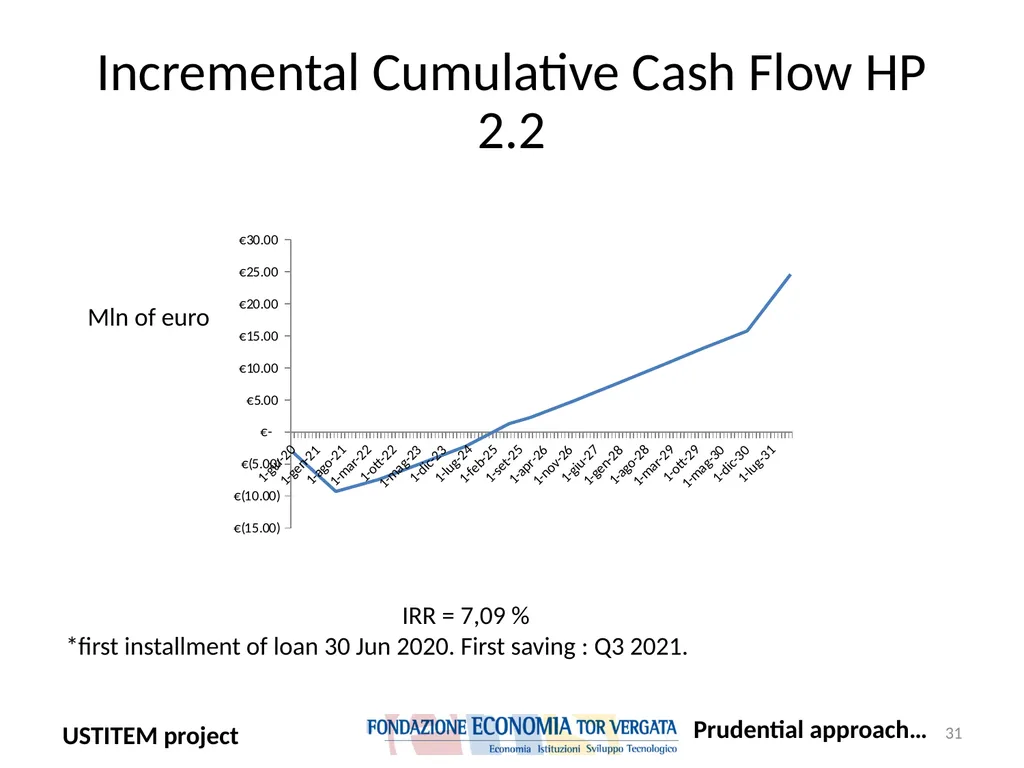
slide31. Incremental Cumulative Cash Flow HP 2.2 31 IRR = 7,09 % *first installment of loan 30 Jun 2020. First saving : Q3 2021. Prudential approach… Mln of euro<br>
slide32. Payback period by hypotheses 32 Prudential approach…<br>
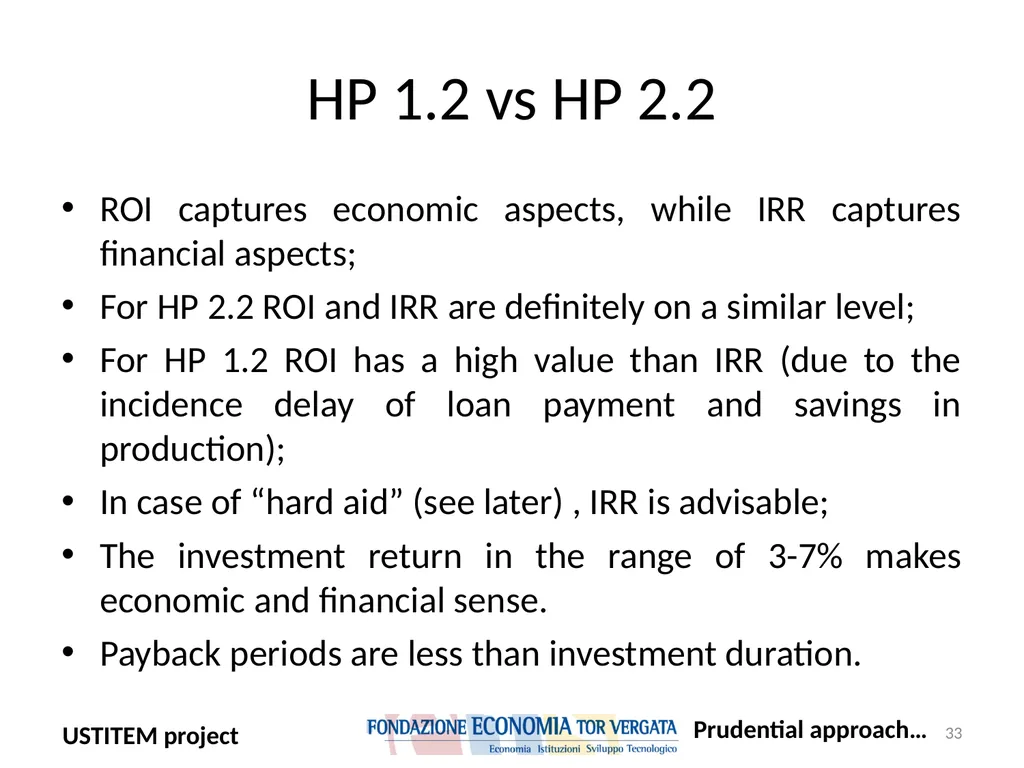
slide33. HP 1.2 vs HP 2.2 ROI captures economic aspects, while IRR captures financial aspects;
For HP 2.2 ROI and IRR are definitely on a similar level;
For HP 1.2 ROI has a high value than IRR (due to the incidence delay of loan payment and savings in production);
In case of “hard aid” (see later) , IRR is advisable;
The investment return in the range of 3-7% makes economic and financial sense.
Payback periods are less than investment duration. 33 Prudential approach…<br>
slide34. State and regional aid Employment regional support for increase in employment:
Programma Operativo Regionale (POR) FSE 2014-2020 - Bonus assunzionale per le imprese - De Minimis (8 k per worker recruited, subject to availability of funds). 34 State and regional aid<br>
slide35. Soft state aid Industry 4.0:
Iper ammortamento: machinery investment up to 20 mln (tax benefit);
….; 35 State and regional aid<br>
slide36. Hard state and regional financial aid Legge 181 del 1989;
Contratto di sviluppo:
On demand;
for investments starting from 20 mln;
capital contributions (grant component);
interest subsidy;
Etc.
Accordo di Sviluppo:
On demand;
fast lane;
With co-partecipation of region;
for investments starting from 50 mln;
capital contributions (grant component);
Etc. 36 with co-partecipation of Lazio region State and regional aid<br>
slide37. Accordi di Innovazione:
Research and Development projects
Agreement between region and MISE
Negotiated procedure
From 5 to 40 mln of euro.
Competence center, Industry 4.0:
Innovation hub;
CIM 4.0 (with Alenia Thales), manufacturing industrial pole. 37 R and D activities<br>
slide38. Hard aid – key figures Overview for next operational steps to develop. Key figures to achieve financial support:
Increase in employment;
Increase in productivity;
Follow on of R&D capability;
Co-partecipation with Lazio region. 38 State and regional aid<br>
slide39. Additional results Conventional sensitive analyses and medium-long patterns;
Impact of non-repayble contribution; 39 Additional results<br>
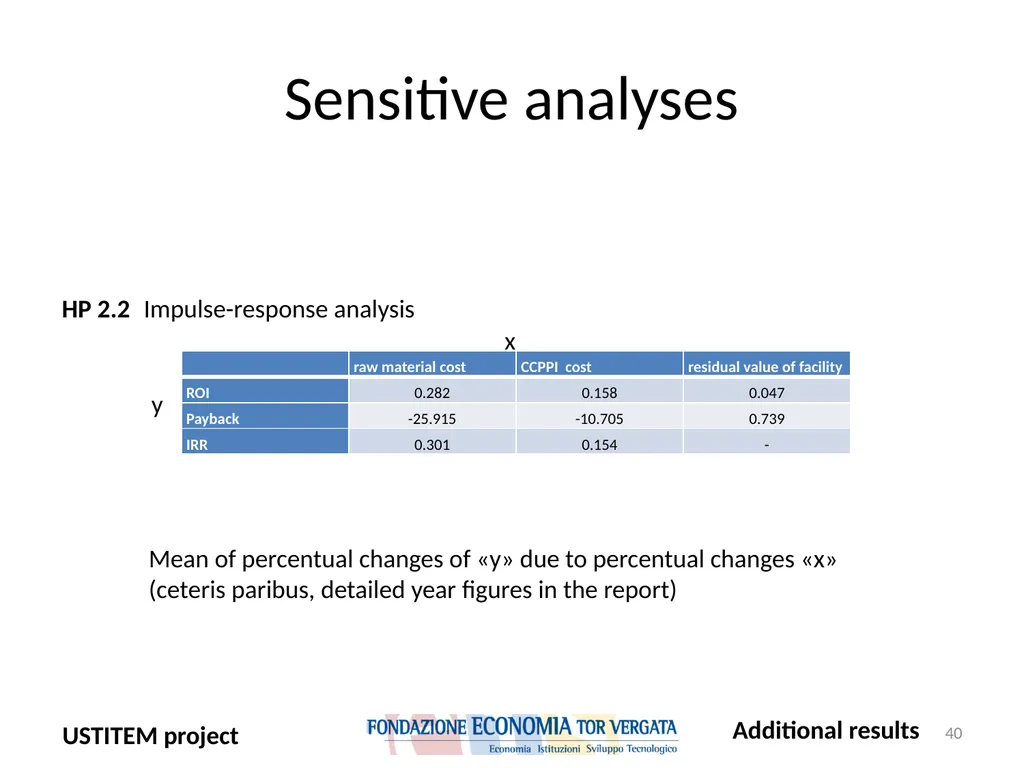
slide40. 40 Sensitive analyses HP 2.2 Impulse-response analysis y x Mean of percentual changes of «y» due to percentual changes «x»
(ceteris paribus, detailed year figures in the report) Additional results<br>
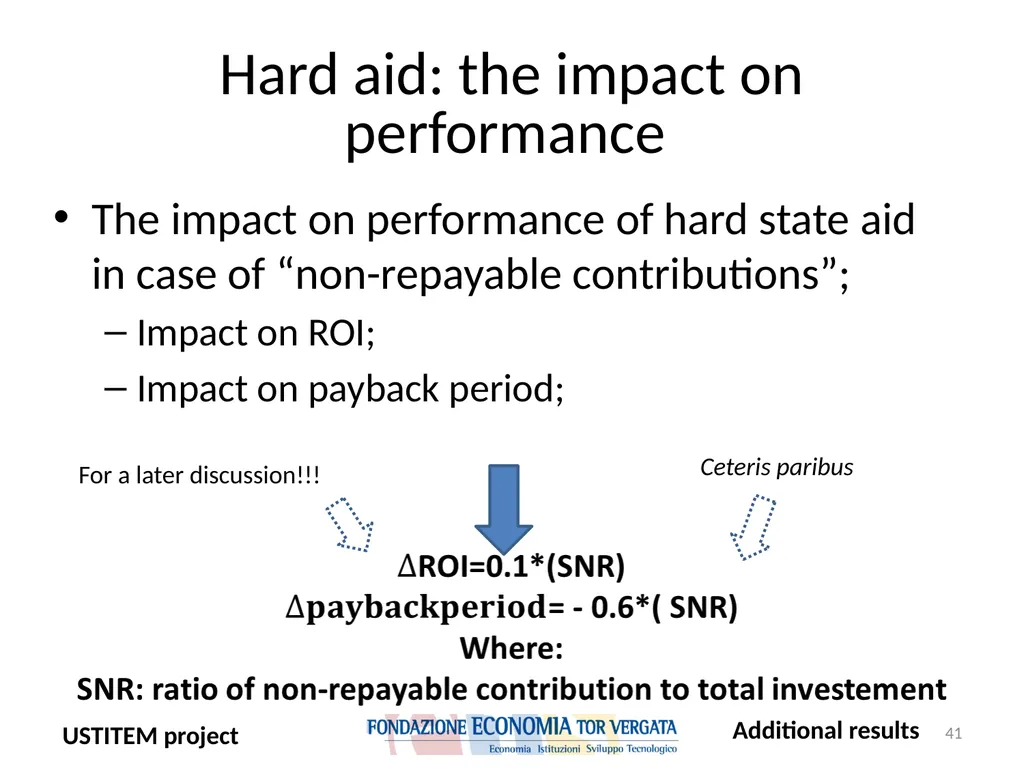
slide41. Hard aid: the impact on performance The impact on performance of hard state aid in case of “non-repayable contributions”;
Impact on ROI;
Impact on payback period; For a later discussion!!! Ceteris paribus 41 Additional results<br>
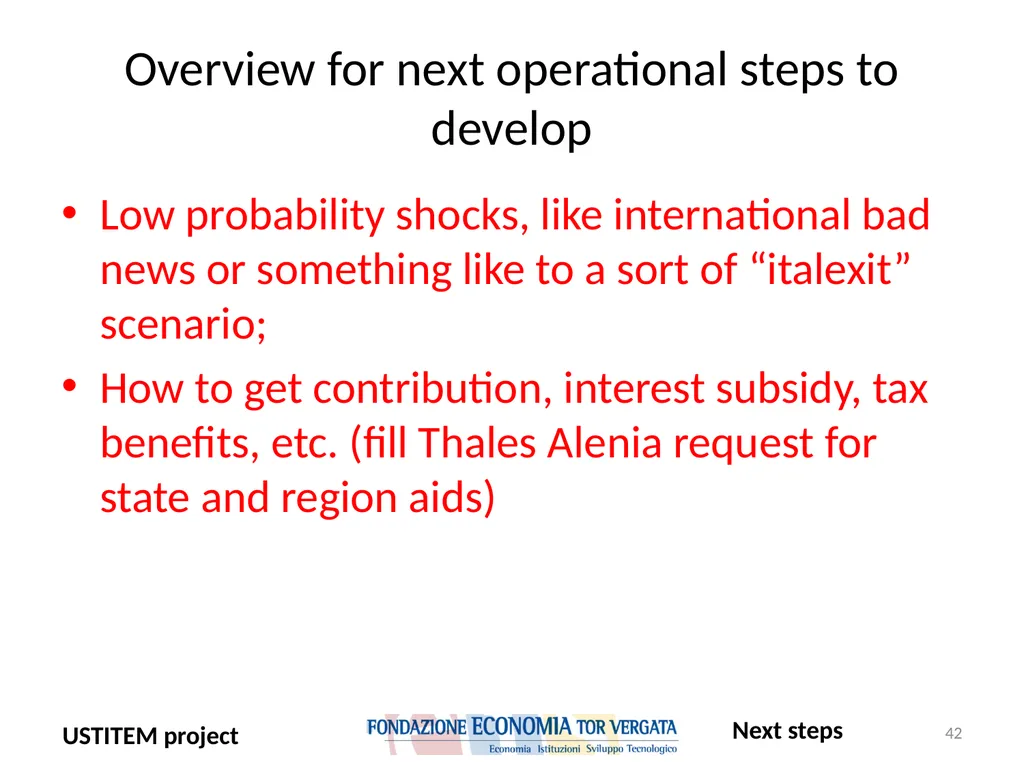
slide42. Low probability shocks, like international bad news or something like to a sort of “italexit” scenario;
How to get contribution, interest subsidy, tax benefits, etc. (fill Thales Alenia request for state and region aids) 42 Overview for next operational steps to develop Next steps<br>
Martino Lo Cascio
FUET team 1<br>
slide2. Contents Market overview and Thales Alenia Spazio
USTITEM project and matrix hypotheses
Other assumptions
Prudential approach and measures
State and region aids
Additional results
Sensitive analysis
Impact of state contribution
Overview for next operational steps to develop 2<br>
slide3. Upstream segment: design, manufacture, assembly, launch, functioning, maintenance, monitoring and repair;
Downstream segment: data and knowledge derived from the space for Earth-related objectives (products and services that support them).
“…Upstream segment can be seen as the provision of space technology, whereas the downstream segment can be seen as the exploitation of space technology“
(2018) Growing the Space Economy: The Downstream Segment as a Driver 3 A taxonomy of the aerospace branches Market overview…<br>
slide4. At 2016 in the world (2018, Growing the Space Economy: The Downstream Segment as a Driver):
Upstream 77 bln of USD
Downstream 177 bln of USD (source:2018, Growing the Space Economy: The Downstream Segment as a Driver):
Following «The space alliance hand book» (2017), the branches EO and Meteo manufacturing are excepted almost double over the next 10 years. 4 Upstream vs Downstream in a nutshell Market overview…<br>
slide5. Upstream vs downstream: push or pull Upstream Downstream Innovation Down-stream: technology pull or Market pull? Market Market overview…<br>
slide6. Bryce world overview Market overview<br>
slide7. 7 The OECD cycles Source: OECD The Space Economy in Figures How Space Contributes to the Global Economy Market overview…<br>
slide8. 8 The OECD cycles (2) Source: OECD The Space Economy in Figures How Space Contributes to the Global Economy Market overview…<br>
slide9. Space launches in 2018 Source: OECD The Space Economy in Figures How Space Contributes to the Global Economy Market overview…<br>
slide10. 10 Number of successful launches Source: OECD The Space Economy in Figures How Space Contributes to the Global Economy Market overview…<br>
slide11. 11 Launch industry: Europe is growing Source: OECD The Space Economy in Figures How Space Contributes to the Global Economy Market overview… Europe is
growing<br>
slide12. 12 Very small satellites launches Source: OECD The Space Economy in Figures How Space Contributes to the Global Economy Market overview Very small satellites launches exponential growth couple with large cycle movement<br>
slide13. 13 The evolution of technology Market overview Cost of launchesFrom 18.000 USD per KG in 1970 to 2.700 per KG in 2018
2 billions of private investment in 2018
23 unicorn in 2018<br>
slide14. Cost of launches: from 18.000 USD per KG in 1970 to 2.700 per KG in 2018;
2 billions of private investment in 2018
23 unicorn in 2018. 14 The evolution of technology Market overview<br>
slide15. Order book: 32.3 mln of euro
Order in take: 16 bln of euro
Sales: 15 bln of euro
EBITDA: 1, 68 bln of euro 15 Thales group key figures Market overview<br>
slide16. Total revenues (2018): 707.31 mln of euro
Profit (2018): 32 mln of euro (28 in 2016 and 24 in 2017)
Magnitude order by which the USTITEM project must be evaluated: from 9% to 25% of 2016 – 2018 period profit. 16 Thales Alenia Italia spa Market overview<br>
slide17. Order in take: 9.6 bn of euro
Revenues: 12.4 bn of euro
EBITDA: 510 mln of euro 17 Leonardo key figures<br>
slide18. Future satellite market expansion doubles world economy and trade;
High variability in satellite dimension ;
VSS (Very Small Satellites) exponential past trend coupled with large cycle fluctuations;
Strategical need: flexibility in satellites dimension supply to cope market growth (for the next 10 year);
To do this, we present two alternative assumptions:
Building an automated facility for Satellite Assembly, Integration and Test (AIT) activities;
Rearranging the current production process in order to automatize the current facility. 18 Summing up Market overview…<br>
slide19. USTITEM project and Investment hypotheses 10 mln: only machinery and system investments, in the current production site (first wave);
55 mln: new facility, changing production site in a wider area (second wave):
Machinery and system 27 mln
Other 28 mln Land, building and related costs 19 USTITEM project…<br>
slide20. Production hypotheses The lack of above investments cause:
overloads production (repercussion on raw materials costs);
manufacturing processes are inadequate ( repercussion on CCPII current costs).
We can make 4 hypotheses to overcome troubles:
In HP 1.1 and HP 1.2, CCPII current costs fall only of 10% (in relation 10 mln investments in machinery and system) ; in HP 2.1 and HP 2.2 (27mln in machinery and system investments) CCPII current costs fall of 20%;
In HP 1.2 raw materials costs fall only of 3-4% (in proportion to machinery and system investments) instead of HP 2.2 where raw materials cost fall of 10% . 20 USTITEM project…<br>
slide21. Hypotheses matrix Scenarios by FUET team and Competence Center 21 USTITEM project…<br>
slide22. Other assumptions Financial charge (2.20% per year)*;
Duration loans 5 (HP 1.1 and 1.2) and 10 years (HP 2.1 and 2.2) ;
Fixed installment repayment plan (c.d. ammortamento francese);
Obsolescence cost equals 400 k for the first year**(costs not incurred for HP 2.1 and HP 2.2) with an estimated annual growth of 5%. *BTP 10 year yield (1.40% - Italy Generic Govt 10Y Yield)+ spread (80 basis points)
** provided by Competence Center 22 Other assumptions<br>
slide23. Prudential approach Cost reduction= change in profit (prudential approach)
Measures:
Payback period;
ROI;
IRR.
The impact of region and state aids:
Innovation process (outright grants);
Employment (employment incentives);
Tax benefits;
Impact of non-repayable contribution on:
ROI;
Payback period;
IRR. 23 Prudential approach… How costs reduction can repays the additional investment:<br>
slide24. Savings and payback period HP 1.2 ROI (annualized) = 5-6% Cumulative savings (mln di euro) Cumulative savings (mln di euro) 24 Prudential approach…<br>
slide25. Incremental cumulative Cash Flow HP 1.2 25 IRR = 3% *first installment of loan 30 Jun 2020. First saving : Q3 2021. Prudential approach… Mln of euro<br>
slide26. Savings and payback period HP 2.2 Cumulative savings Cumulative savings ROI (annualized) = 7%*
*% of residual value of new facility after 10 years : 80% 26 Prudential approach…<br>
slide27. 27 Impact on Income Statement Hypotheses:
Building depreciation: 5% (20 years)
Plant depreciation: 12% ( 8-9 years)
Positive cost: impact of financial charge
Negative cost: saving<br>
slide28. Key figure
ROI= 6.2%
Payback: 7-8 years
IRR: 5.4%
Income statement 28 HP 2.2 with 60 mln of investment<br>
slide29. Key figure
ROI= 4.29 %
Payback: over 10 years
IRR: 5.26 % 29 HP 2.2 with 55 mln of investment (9.5% of interest rate) Key figure
ROI= 6.78 %
Payback: 8-9 years
IRR: 7.16 % CCPPI saving 25%
Raw material 15%<br>
slide30. Key figure
ROI= 3.78%
Payback: over 10 years
IRR: 5.2 % 30 HP 2.2 with 60 mln of investment (9.5% of interest rate) Key figure
ROI= 6.17%
Payback: 8-9 years
IRR: 7 % CCPPI saving 25%
Raw material 15%<br>
slide31. Incremental Cumulative Cash Flow HP 2.2 31 IRR = 7,09 % *first installment of loan 30 Jun 2020. First saving : Q3 2021. Prudential approach… Mln of euro<br>
slide32. Payback period by hypotheses 32 Prudential approach…<br>
slide33. HP 1.2 vs HP 2.2 ROI captures economic aspects, while IRR captures financial aspects;
For HP 2.2 ROI and IRR are definitely on a similar level;
For HP 1.2 ROI has a high value than IRR (due to the incidence delay of loan payment and savings in production);
In case of “hard aid” (see later) , IRR is advisable;
The investment return in the range of 3-7% makes economic and financial sense.
Payback periods are less than investment duration. 33 Prudential approach…<br>
slide34. State and regional aid Employment regional support for increase in employment:
Programma Operativo Regionale (POR) FSE 2014-2020 - Bonus assunzionale per le imprese - De Minimis (8 k per worker recruited, subject to availability of funds). 34 State and regional aid<br>
slide35. Soft state aid Industry 4.0:
Iper ammortamento: machinery investment up to 20 mln (tax benefit);
….; 35 State and regional aid<br>
slide36. Hard state and regional financial aid Legge 181 del 1989;
Contratto di sviluppo:
On demand;
for investments starting from 20 mln;
capital contributions (grant component);
interest subsidy;
Etc.
Accordo di Sviluppo:
On demand;
fast lane;
With co-partecipation of region;
for investments starting from 50 mln;
capital contributions (grant component);
Etc. 36 with co-partecipation of Lazio region State and regional aid<br>
slide37. Accordi di Innovazione:
Research and Development projects
Agreement between region and MISE
Negotiated procedure
From 5 to 40 mln of euro.
Competence center, Industry 4.0:
Innovation hub;
CIM 4.0 (with Alenia Thales), manufacturing industrial pole. 37 R and D activities<br>
slide38. Hard aid – key figures Overview for next operational steps to develop. Key figures to achieve financial support:
Increase in employment;
Increase in productivity;
Follow on of R&D capability;
Co-partecipation with Lazio region. 38 State and regional aid<br>
slide39. Additional results Conventional sensitive analyses and medium-long patterns;
Impact of non-repayble contribution; 39 Additional results<br>
slide40. 40 Sensitive analyses HP 2.2 Impulse-response analysis y x Mean of percentual changes of «y» due to percentual changes «x»
(ceteris paribus, detailed year figures in the report) Additional results<br>
slide41. Hard aid: the impact on performance The impact on performance of hard state aid in case of “non-repayable contributions”;
Impact on ROI;
Impact on payback period; For a later discussion!!! Ceteris paribus 41 Additional results<br>
slide42. Low probability shocks, like international bad news or something like to a sort of “italexit” scenario;
How to get contribution, interest subsidy, tax benefits, etc. (fill Thales Alenia request for state and region aids) 42 Overview for next operational steps to develop Next steps<br>