What is the Appropriate Index Formula to Estimate Producer Price Change? December 11, 2020 Robert Martin Jonathan Weinhagen Summary PPI currently uses a modified Laspeyres formula for all indexes Industry Commodity Final Demand -
"What is the Appropriate Index Formula to Estimate" is the property of its rightful owner. Permission is granted to
download and print the materials on this website for personal, non-commercial use only, and to display it
on your personal computer provided you do not modify the materials and that you retain all copyright
notices contained in the materials. By downloading content from our website, you accept the terms of this
agreement.
Presentation Transcript
01
What is the Appropriate Index Formula to Estimate Producer Price Change? December 11, 2020
Robert Martin
Jonathan Weinhagen<br>
02
Summary PPI currently uses a modified Laspeyres formula for all indexes
Industry
Commodity
Final Demand - Intermediate Demand (FD-ID)
Net inputs to industry
Specifically, the Young formula is used at the elementary level
We are proposing using the geometric Young for elementary indexes<br>
03
Background In the 1990s, the Consumer Price index switched from a modified Laspeyres to a weighted geometric mean for most elementary-level price indexes
PPI chose not to make this change because the Laspeyres index is a lower bound for a certain theoretical output price index
Mathematically, a geometric mean index will be less than or equal to a Laspeyres index
However, other axiomatic and economic arguments are more favorable to the geometric mean<br>
04
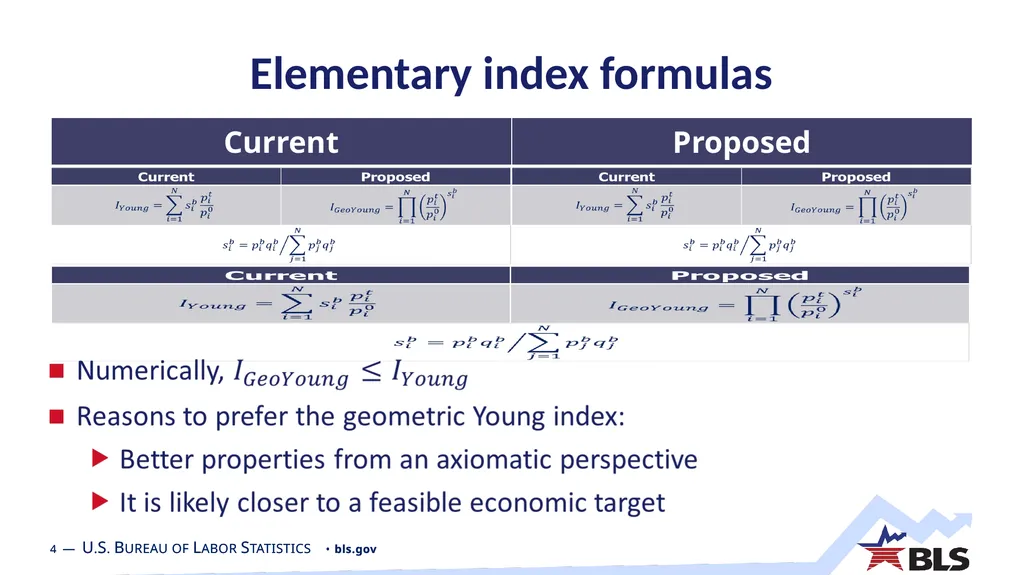
Elementary index formulas<br>
05
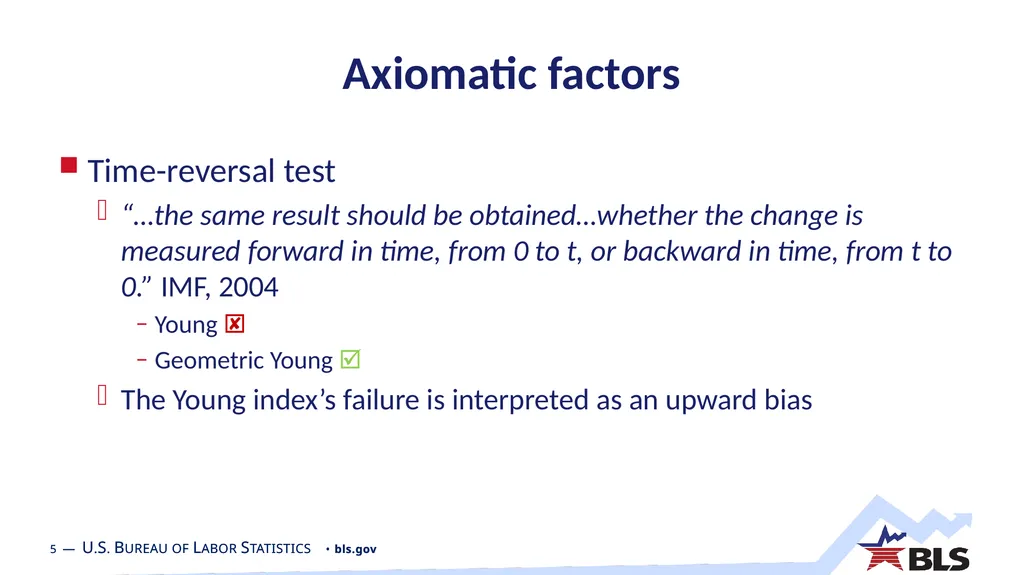
Axiomatic factors Time-reversal test
“…the same result should be obtained…whether the change is measured forward in time, from 0 to t, or backward in time, from t to 0.” IMF, 2004
Young
Geometric Young
The Young index’s failure is interpreted as an upward bias<br>
06
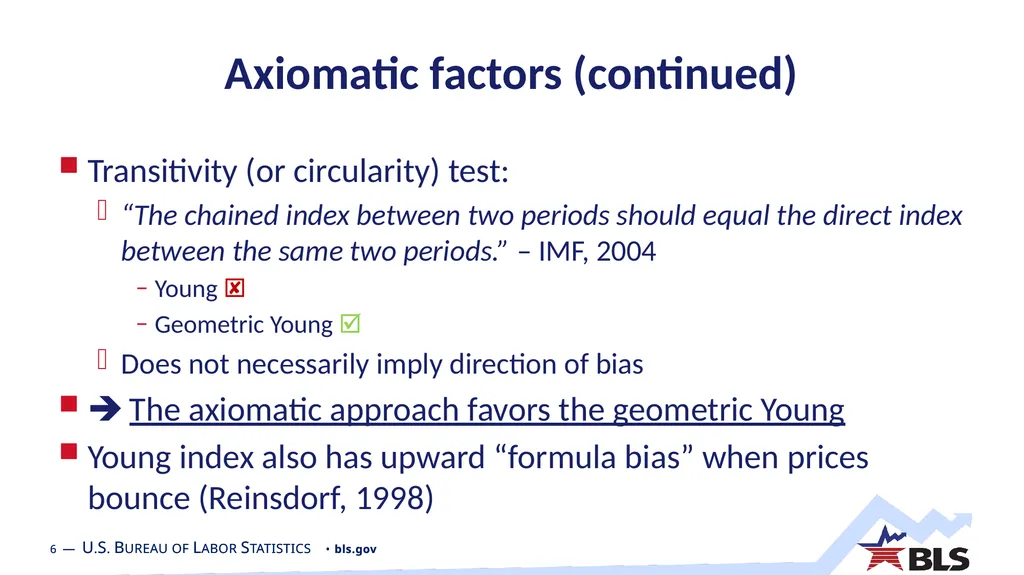
Axiomatic factors (continued) Transitivity (or circularity) test:
“The chained index between two periods should equal the direct index between the same two periods.” – IMF, 2004
Young
Geometric Young
Does not necessarily imply direction of bias
The axiomatic approach favors the geometric Young
Young index also has upward “formula bias” when prices bounce (Reinsdorf, 1998)<br>
07
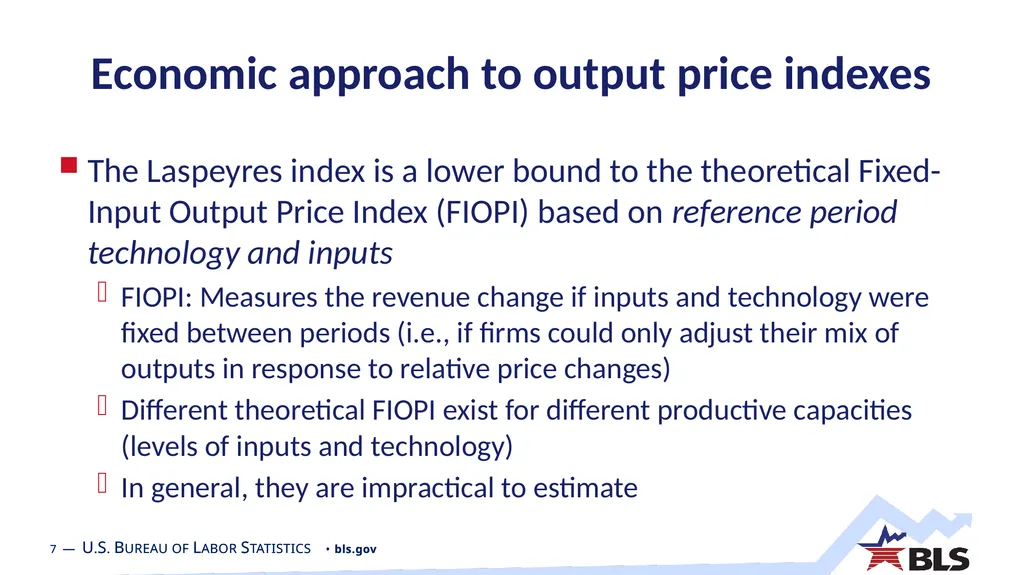
Economic approach to output price indexes The Laspeyres index is a lower bound to the theoretical Fixed-Input Output Price Index (FIOPI) based on reference period technology and inputs
FIOPI: Measures the revenue change if inputs and technology were fixed between periods (i.e., if firms could only adjust their mix of outputs in response to relative price changes)
Different theoretical FIOPI exist for different productive capacities (levels of inputs and technology)
In general, they are impractical to estimate<br>
08
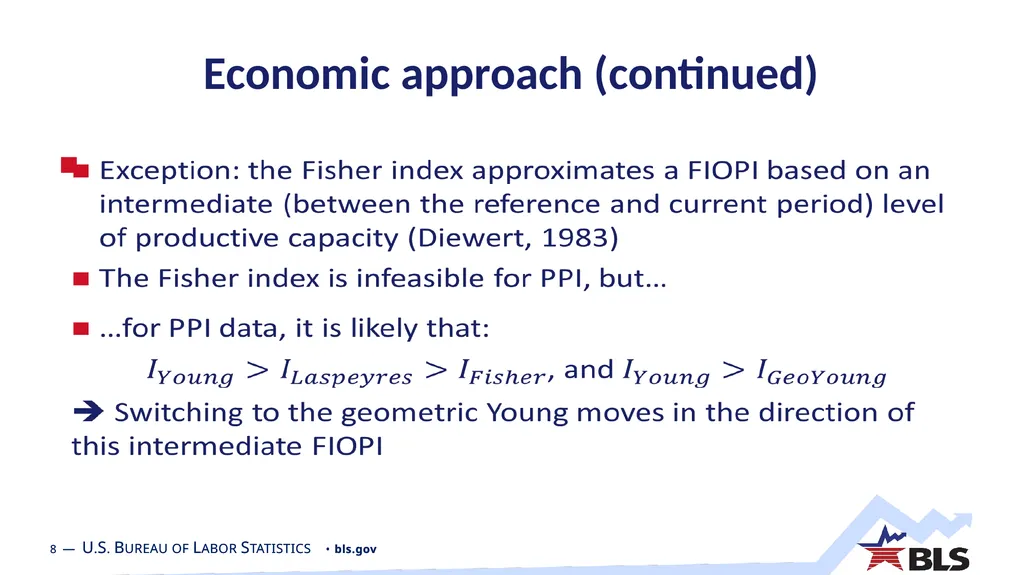
Economic approach (continued)<br>
09
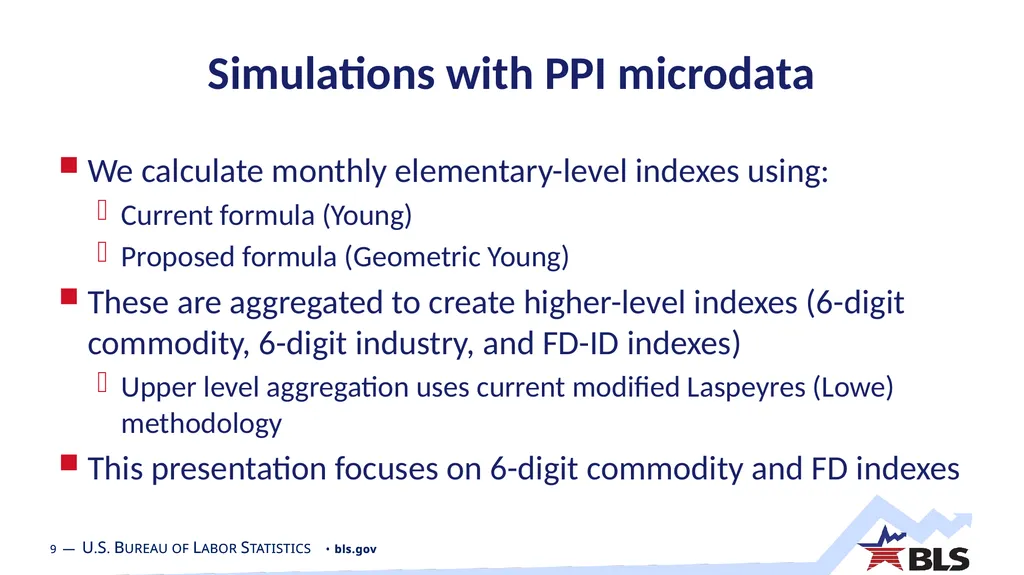
Simulations with PPI microdata We calculate monthly elementary-level indexes using:
Current formula (Young)
Proposed formula (Geometric Young)
These are aggregated to create higher-level indexes (6-digit commodity, 6-digit industry, and FD-ID indexes)
Upper level aggregation uses current modified Laspeyres (Lowe) methodology
This presentation focuses on 6-digit commodity and FD indexes<br>
10
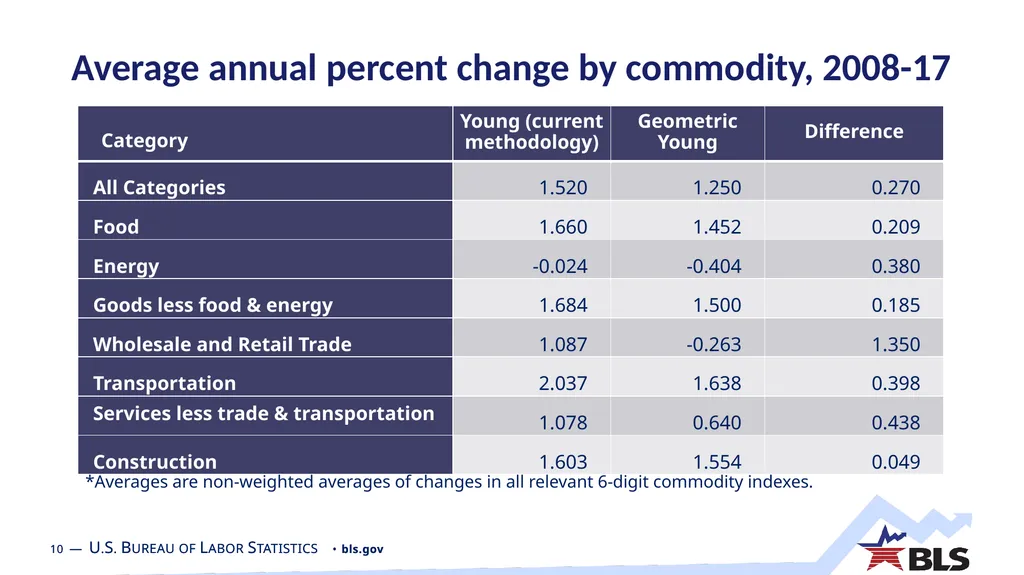
Average annual percent change by commodity, 2008-17 *Averages are non-weighted averages of changes in all relevant 6-digit commodity indexes.<br>
11
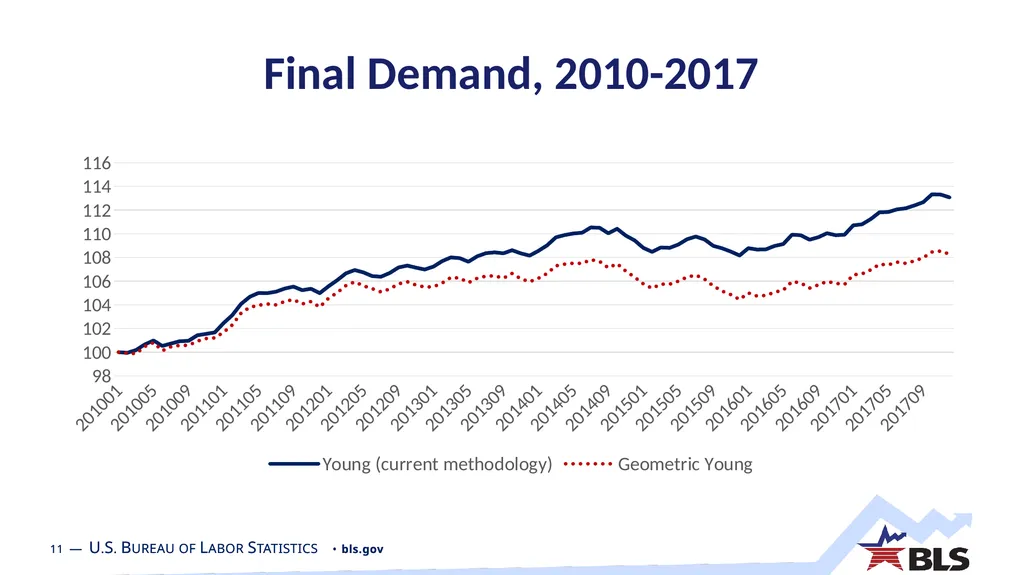
Final Demand, 2010-2017<br>
12
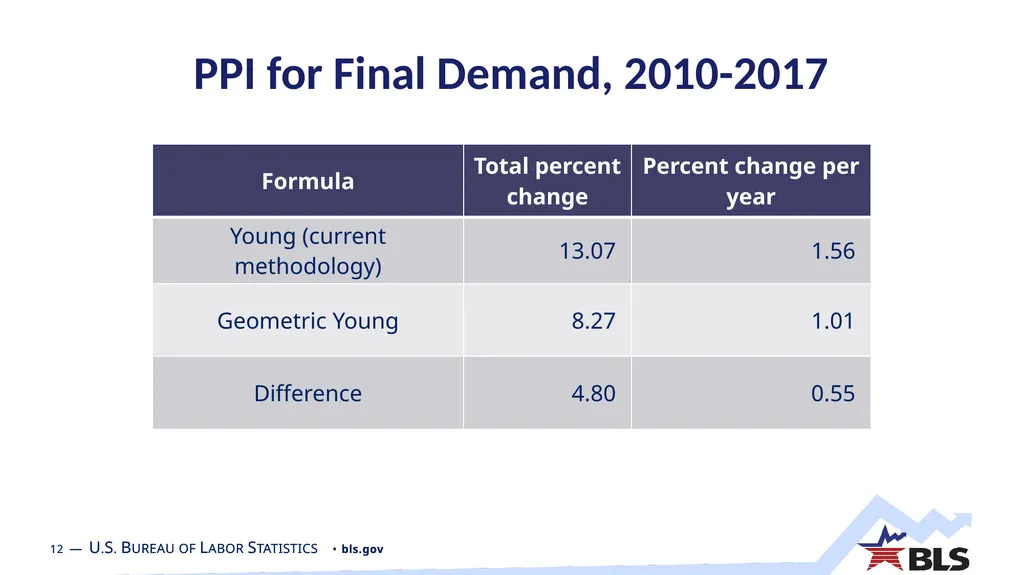
PPI for Final Demand, 2010-2017<br>
13
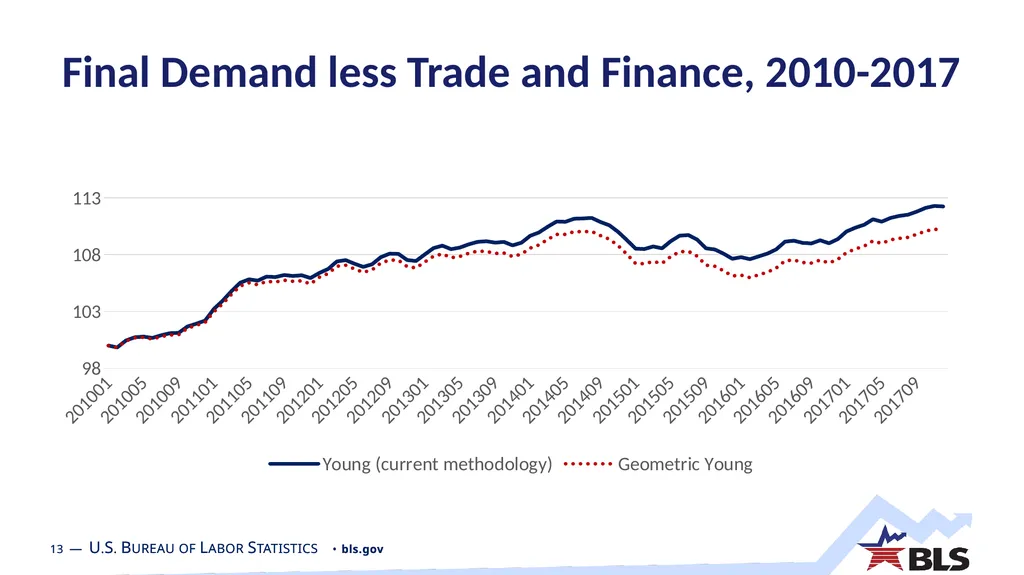
Final Demand less Trade and Finance, 2010-2017<br>
14
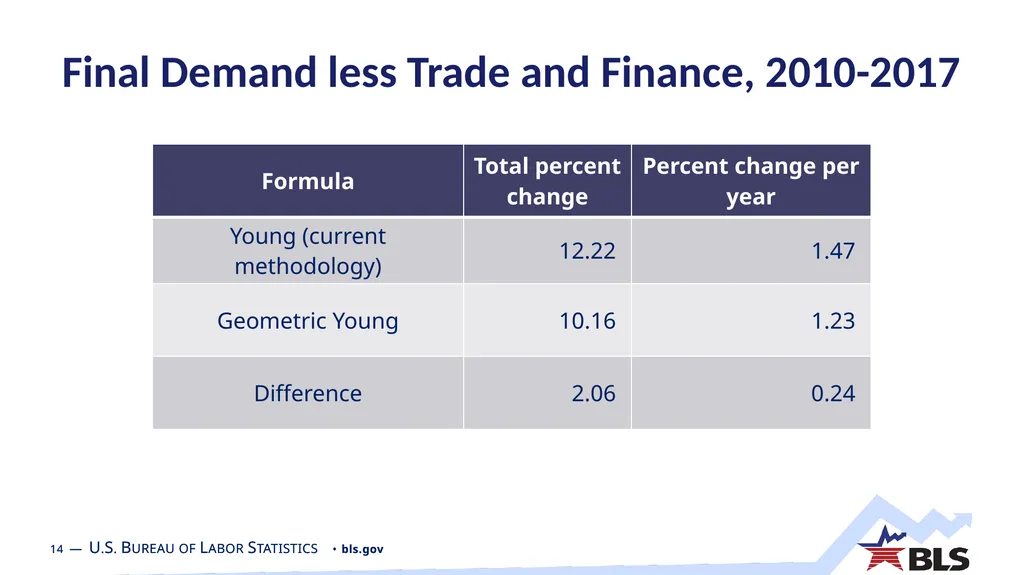
Final Demand less Trade and Finance, 2010-2017<br>
15
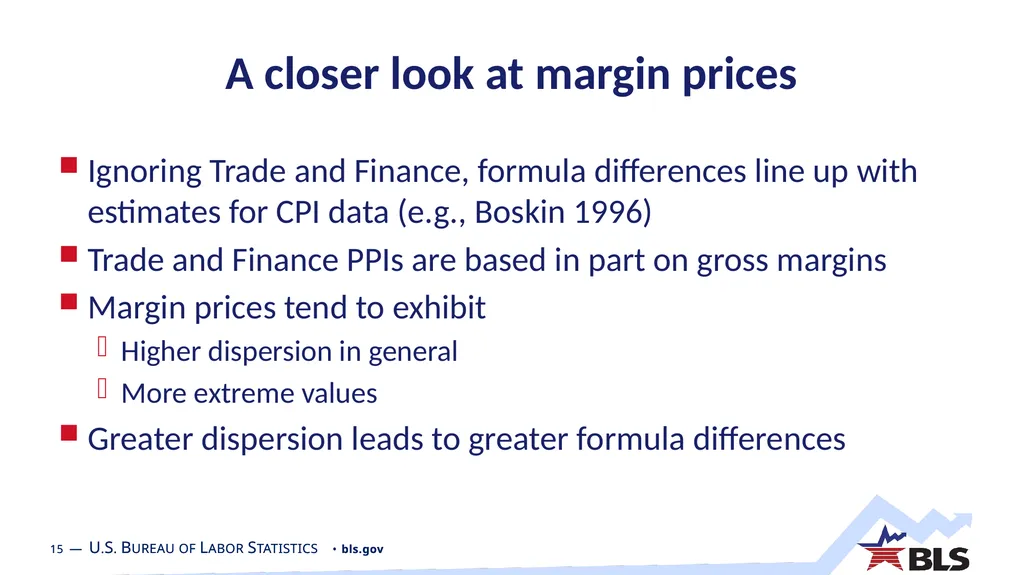
A closer look at margin prices Ignoring Trade and Finance, formula differences line up with estimates for CPI data (e.g., Boskin 1996)
Trade and Finance PPIs are based in part on gross margins
Margin prices tend to exhibit
Higher dispersion in general
More extreme values
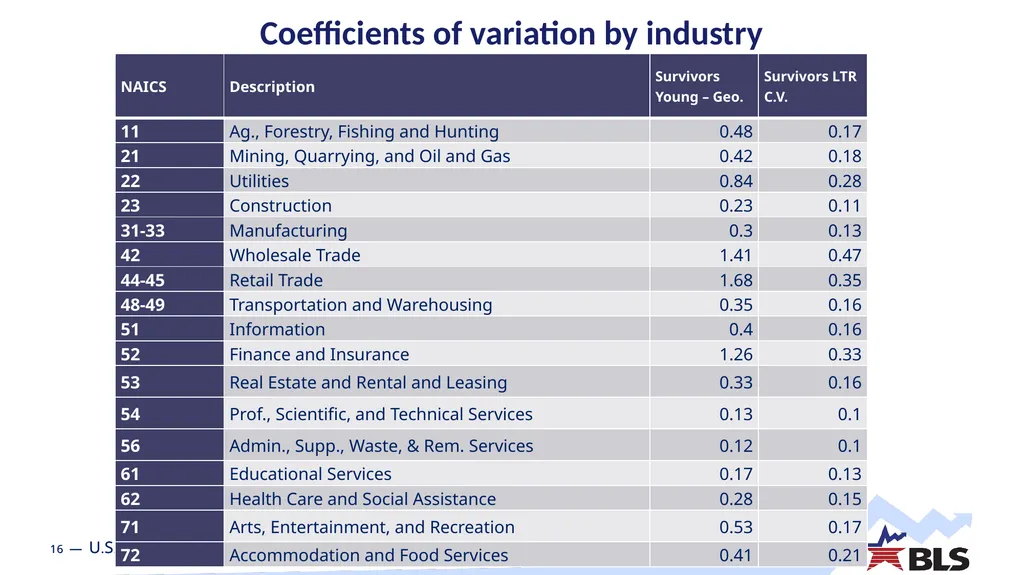
Greater dispersion leads to greater formula differences<br>
16
Coefficients of variation by industry<br>
17
Extreme values and geometric means Dispersion is a concern if it is driven by extreme values
Compared to an arithmetic mean, a geometric mean is:
Less sensitive to large extreme values (price relatives)
More sensitive to small (i.e., close to zero) extreme values
Despite superior axiomatic and economic properties, the geometric Young may perform poorly when there are price relatives close to zero
Meaning it may not reflect the central tendency of the elementary cell<br>
18
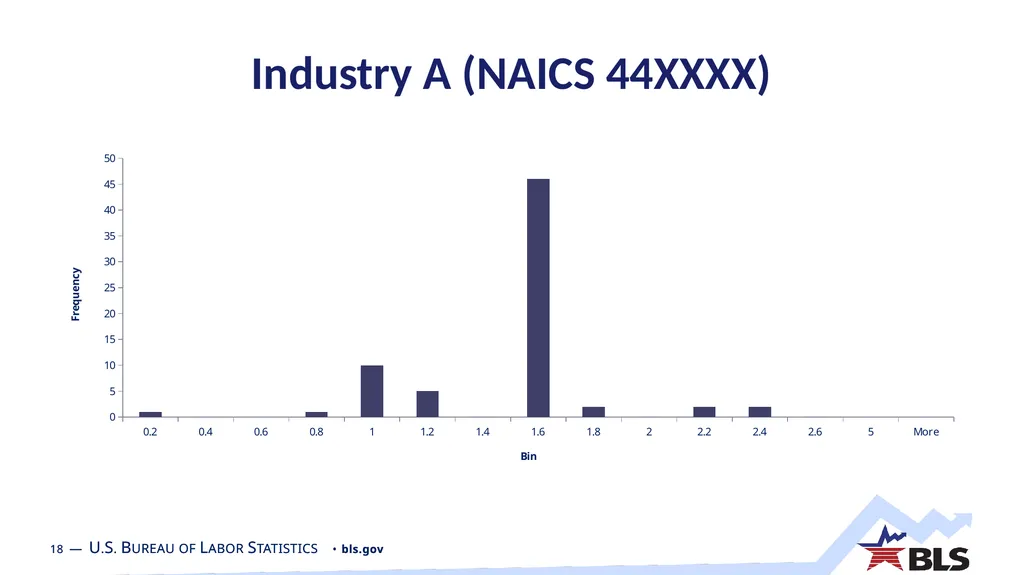
Industry A (NAICS 44XXXX)<br>
19
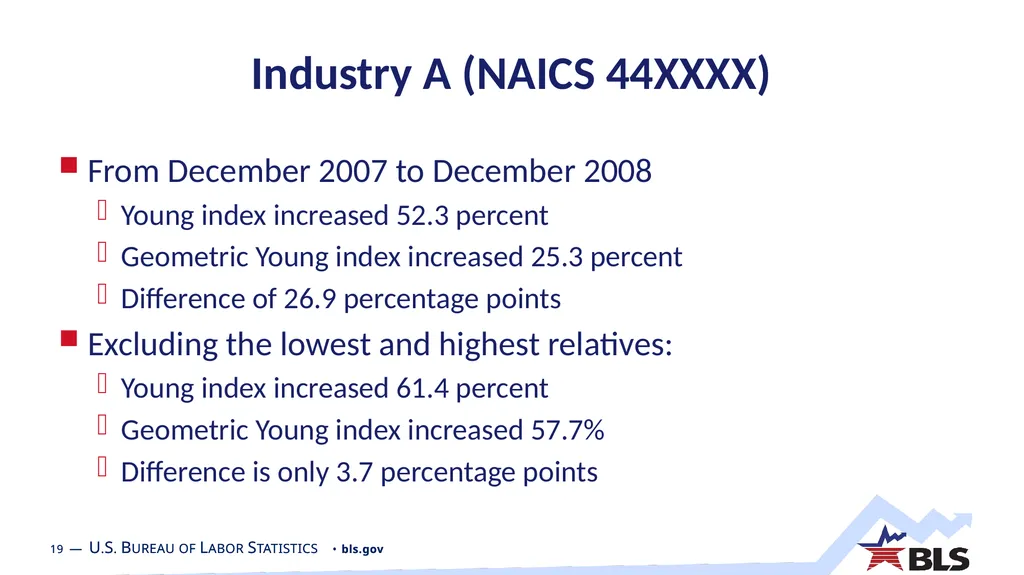
Industry A (NAICS 44XXXX) From December 2007 to December 2008
Young index increased 52.3 percent
Geometric Young index increased 25.3 percent
Difference of 26.9 percentage points
Excluding the lowest and highest relatives:
Young index increased 61.4 percent
Geometric Young index increased 57.7%
Difference is only 3.7 percentage points<br>
20
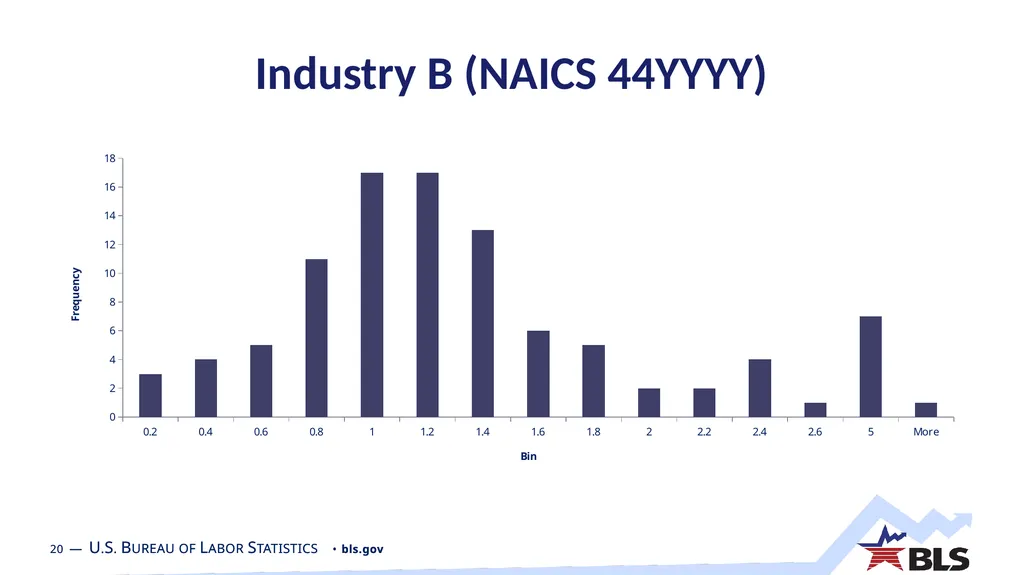
Industry B (NAICS 44YYYY)<br>
21
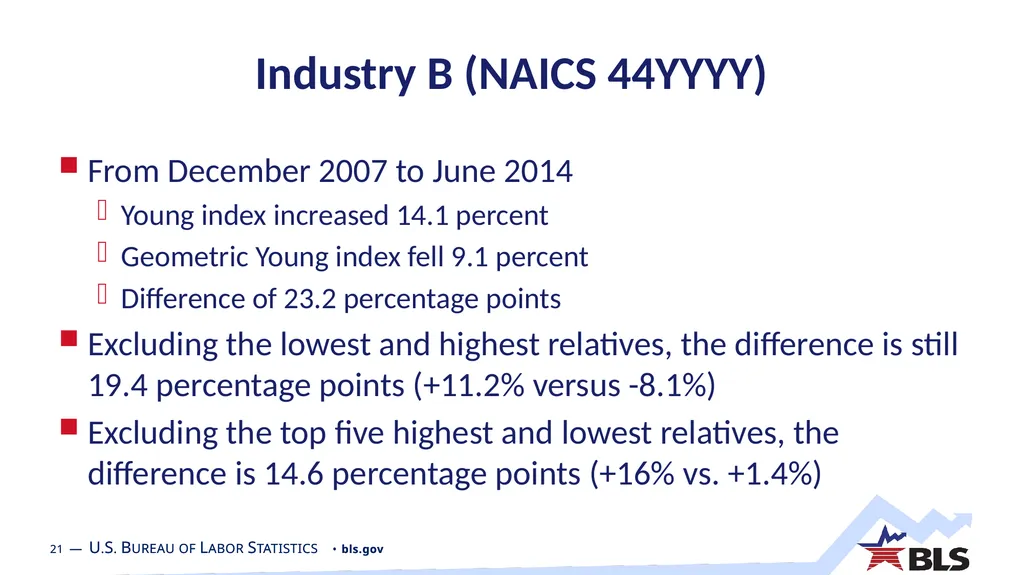
Industry B (NAICS 44YYYY) From December 2007 to June 2014
Young index increased 14.1 percent
Geometric Young index fell 9.1 percent
Difference of 23.2 percentage points
Excluding the lowest and highest relatives, the difference is still 19.4 percentage points (+11.2% versus -8.1%)
Excluding the top five highest and lowest relatives, the difference is 14.6 percentage points (+16% vs. +1.4%)<br>
22
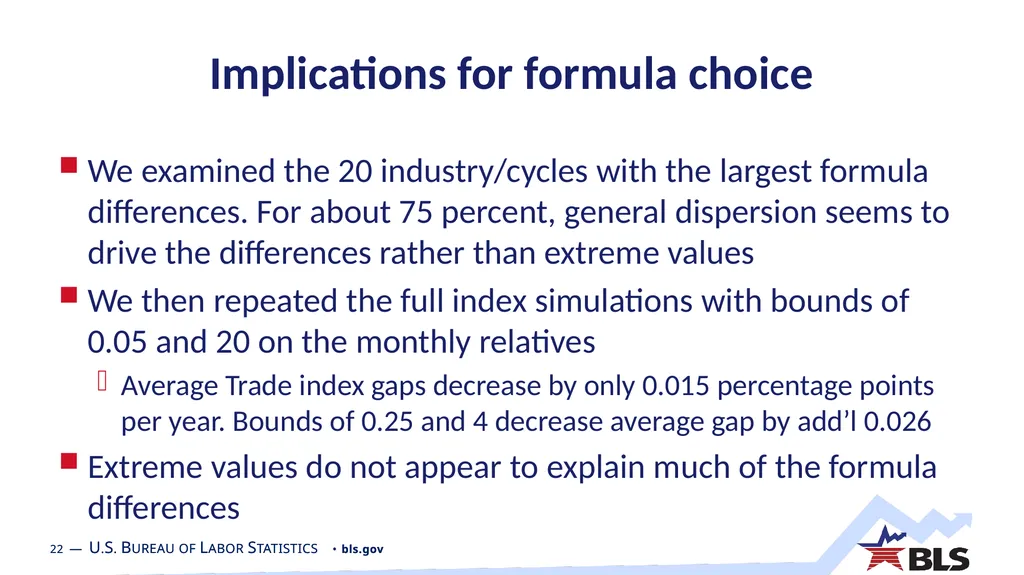
Implications for formula choice We examined the 20 industry/cycles with the largest formula differences. For about 75 percent, general dispersion seems to drive the differences rather than extreme values
We then repeated the full index simulations with bounds of 0.05 and 20 on the monthly relatives
Average Trade index gaps decrease by only 0.015 percentage points per year. Bounds of 0.25 and 4 decrease average gap by add’l 0.026
Extreme values do not appear to explain much of the formula differences<br>
23
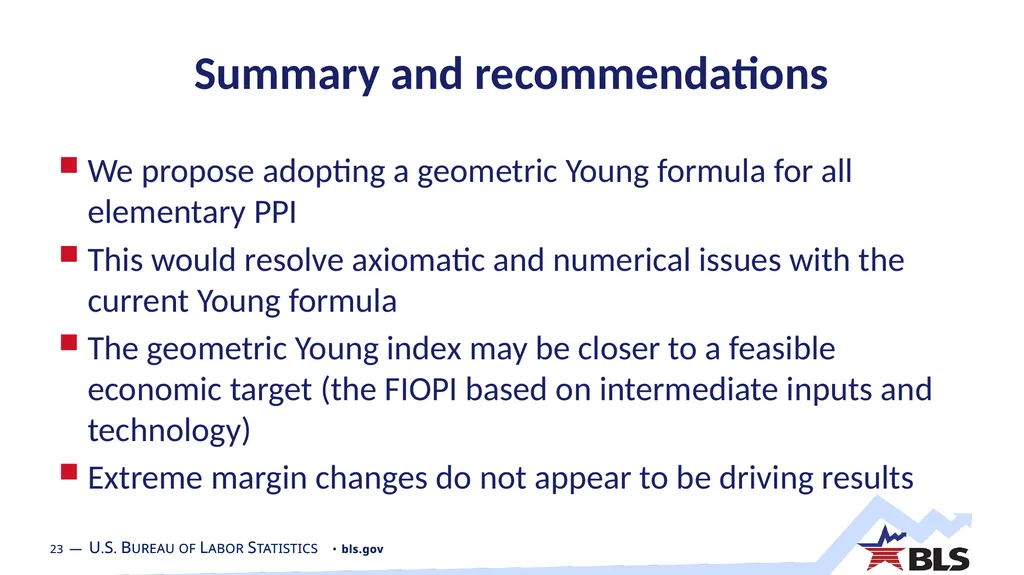
Summary and recommendations We propose adopting a geometric Young formula for all elementary PPI
This would resolve axiomatic and numerical issues with the current Young formula
The geometric Young index may be closer to a feasible economic target (the FIOPI based on intermediate inputs and technology)
Extreme margin changes do not appear to be driving results<br>
24
Jonathan Weinhagen
Senior Economist
Producer Price Index Program
www.bls.gov/ppi
202-691-7709
weinhagen.jonathan@bls.gov<br>
25
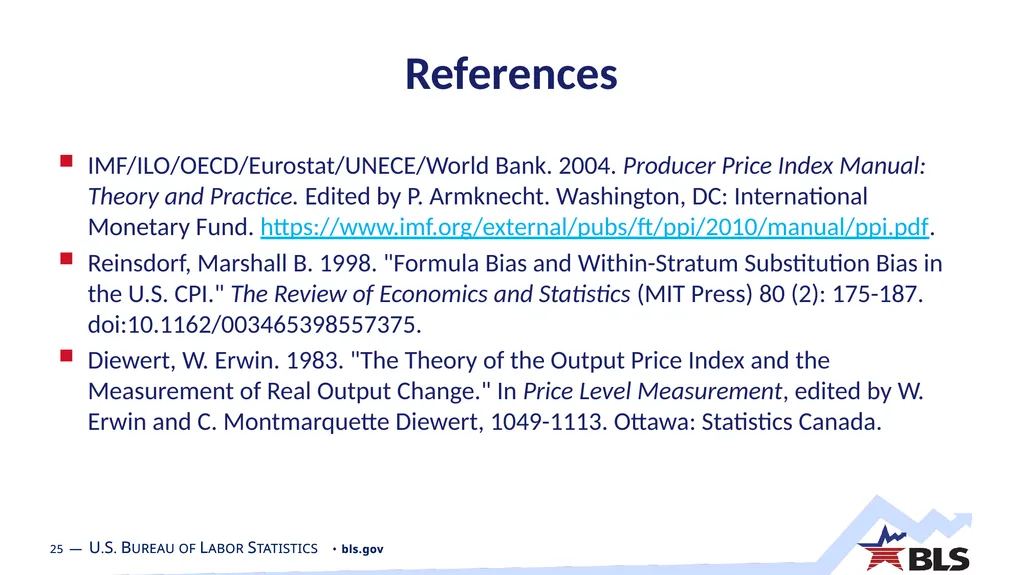
References IMF/ILO/OECD/Eurostat/UNECE/World Bank. 2004. Producer Price Index Manual: Theory and Practice. Edited by P. Armknecht. Washington, DC: International Monetary Fund. https://www.imf.org/external/pubs/ft/ppi/2010/manual/ppi.pdf.
Reinsdorf, Marshall B. 1998. "Formula Bias and Within-Stratum Substitution Bias in the U.S. CPI." The Review of Economics and Statistics (MIT Press) 80 (2): 175-187. doi:10.1162/003465398557375.
Diewert, W. Erwin. 1983. "The Theory of the Output Price Index and the Measurement of Real Output Change." In Price Level Measurement, edited by W. Erwin and C. Montmarquette Diewert, 1049-1113. Ottawa: Statistics Canada.<br>