Why do non-Mendelian patterns occur? (When to decide whether it is Mendelian or non-Mendelian) Determine the most probable genetic crosses based on the following data: Two lines of true-breeding plants, one with yellow petals and one
"Why do non-Mendelian patterns occur? (When to" is the property of its rightful owner. Permission is granted to
download and print the materials on this website for personal, non-commercial use only, and to display it
on your personal computer provided you do not modify the materials and that you retain all copyright
notices contained in the materials. By downloading content from our website, you accept the terms of this
agreement.
Presentation Transcript
01
Why do non-Mendelian patterns occur? (When to decide whether it is “Mendelian” or “non-Mendelian”)<br>
02
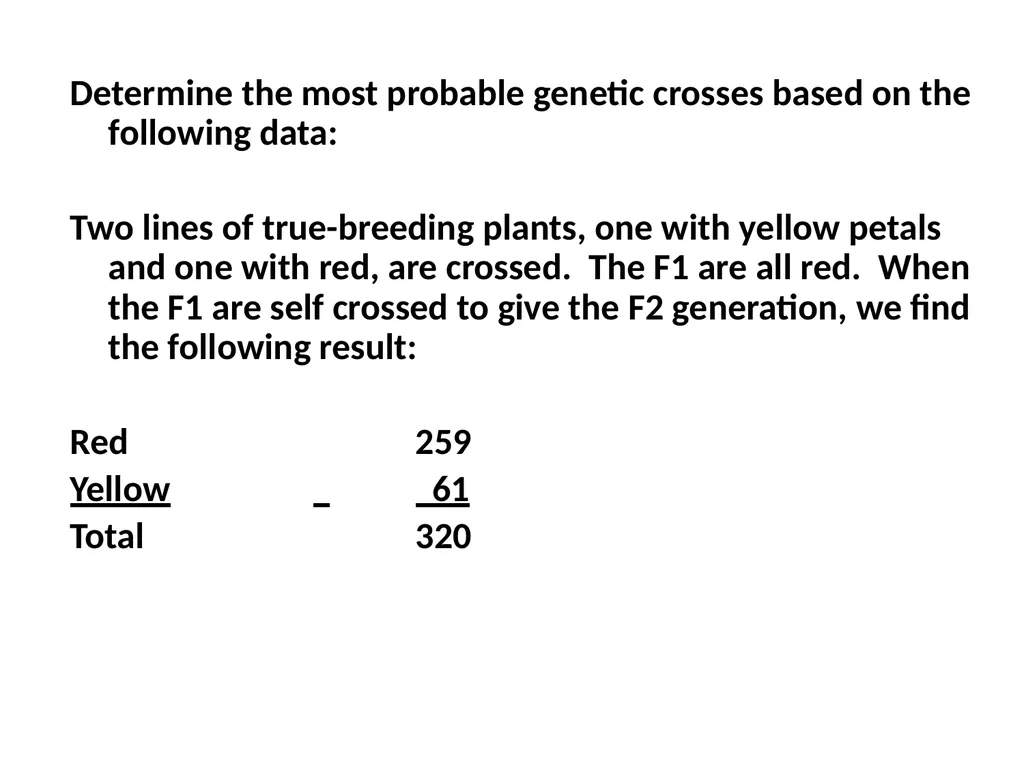
Determine the most probable genetic crosses based on the following data:
Two lines of true-breeding plants, one with yellow petals and one with red, are crossed. The F1 are all red. When the F1 are self crossed to give the F2 generation, we find the following result:
Red 259
Yellow 61
Total 320<br>
03
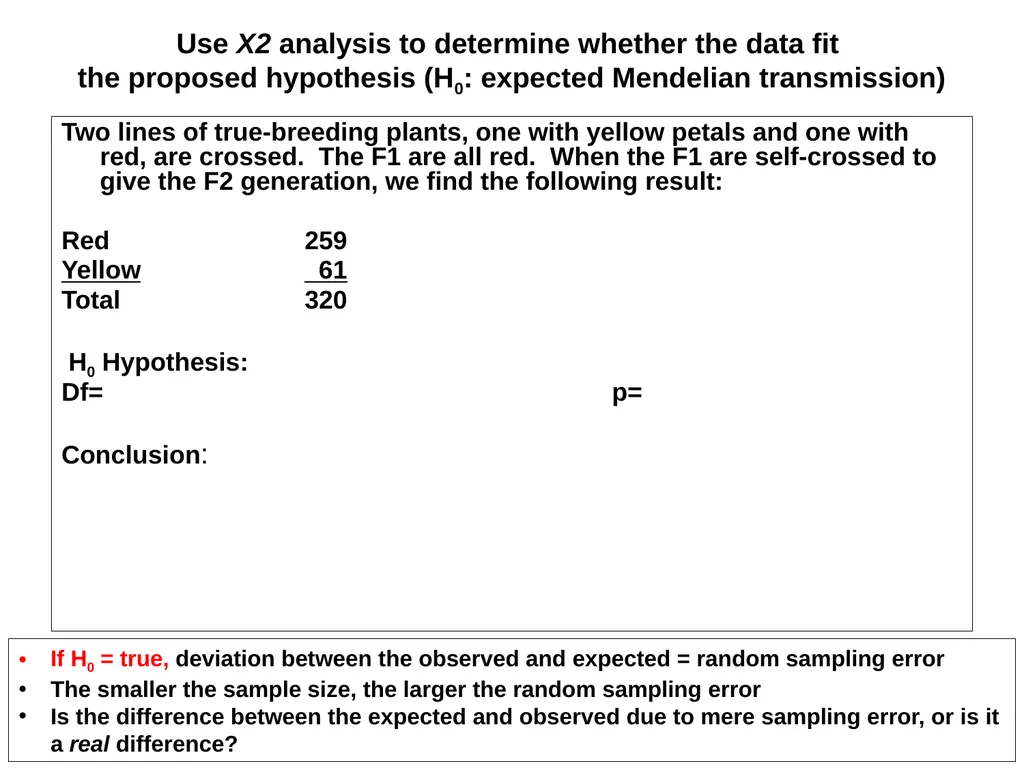
Use X2 analysis to determine whether the data fit the proposed hypothesis (H0: expected Mendelian transmission) Two lines of true-breeding plants, one with yellow petals and one with red, are crossed. The F1 are all red. When the F1 are self-crossed to give the F2 generation, we find the following result:
Red 259
Yellow 61
Total 320
H0 Hypothesis:
Df= p=
Conclusion: If H0 = true, deviation between the observed and expected = random sampling error
The smaller the sample size, the larger the random sampling error
Is the difference between the expected and observed due to mere sampling error, or is it a real difference?<br>
04
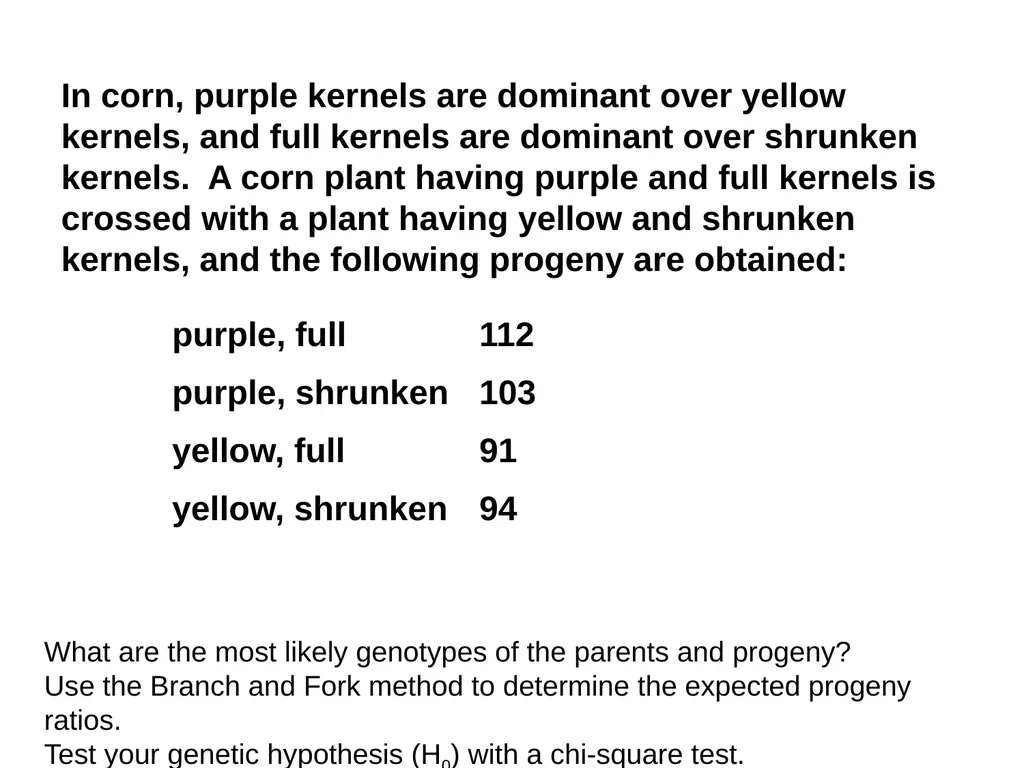
In corn, purple kernels are dominant over yellow kernels, and full kernels are dominant over shrunken kernels. A corn plant having purple and full kernels is crossed with a plant having yellow and shrunken kernels, and the following progeny are obtained: purple, full 112
purple, shrunken 103
yellow, full 91
yellow, shrunken 94 What are the most likely genotypes of the parents and progeny?
Use the Branch and Fork method to determine the expected progeny ratios.
Test your genetic hypothesis (H0) with a chi-square test.<br>
05
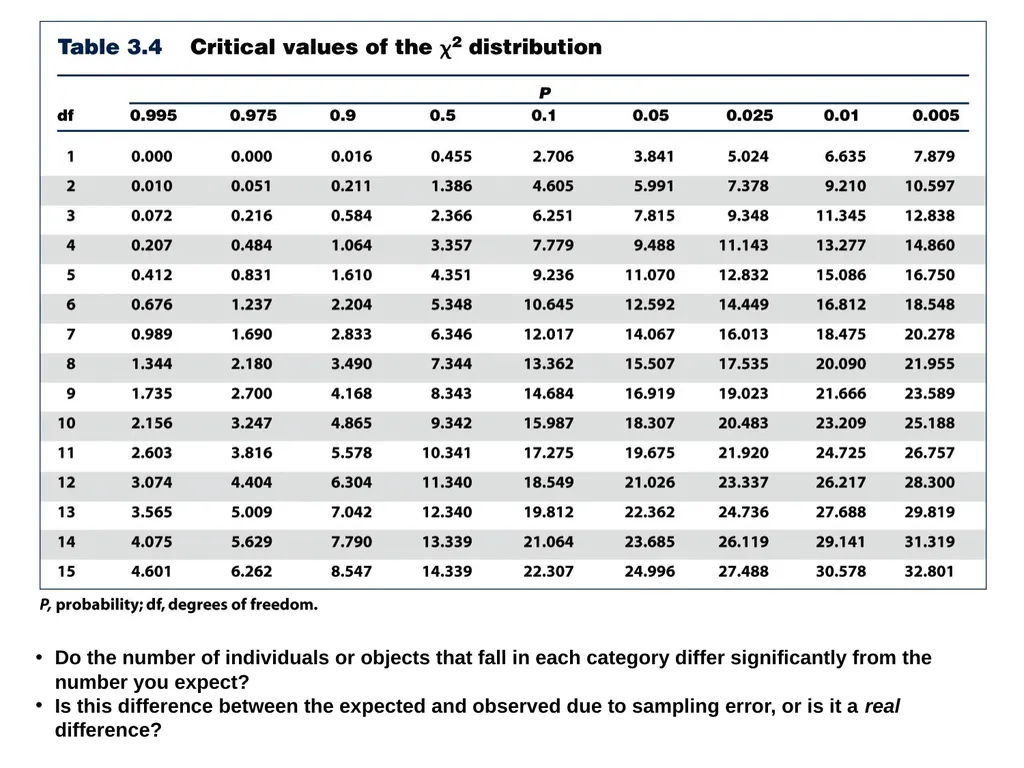
Do the number of individuals or objects that fall in each category differ significantly from the number you expect?
Is this difference between the expected and observed due to sampling error, or is it a real difference?<br>
06
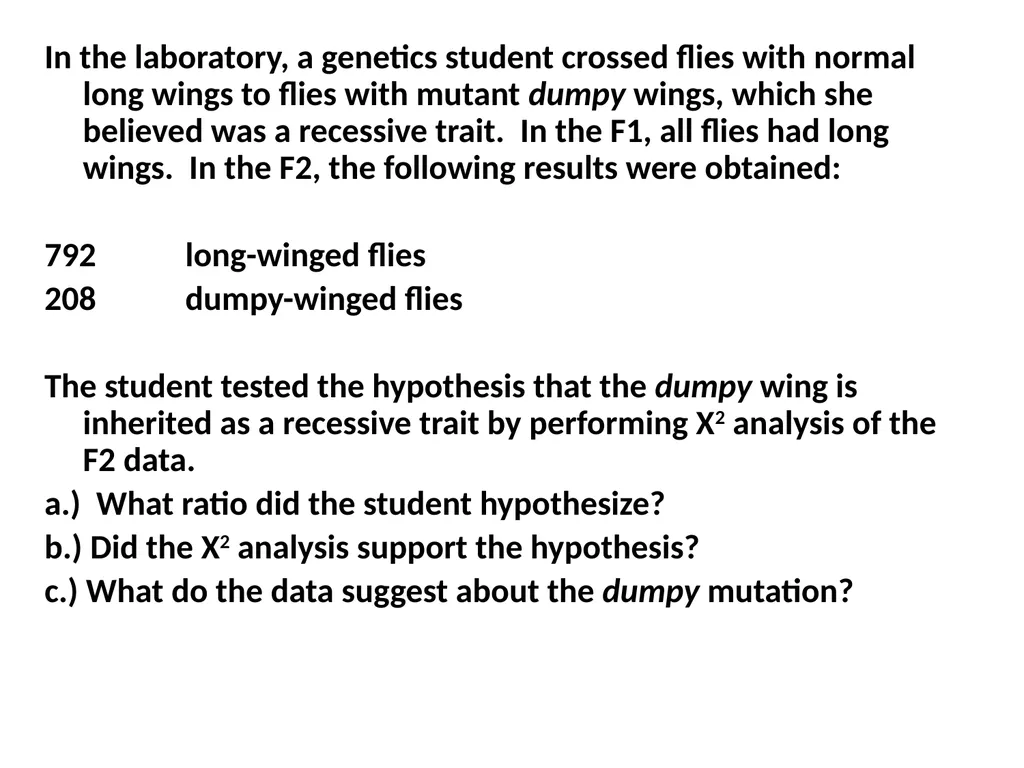
In the laboratory, a genetics student crossed flies with normal long wings to flies with mutant dumpy wings, which she believed was a recessive trait. In the F1, all flies had long wings. In the F2, the following results were obtained:
792 long-winged flies
208 dumpy-winged flies
The student tested the hypothesis that the dumpy wing is inherited as a recessive trait by performing X2 analysis of the F2 data.
a.) What ratio did the student hypothesize?
b.) Did the X2 analysis support the hypothesis?
c.) What do the data suggest about the dumpy mutation?<br>
07
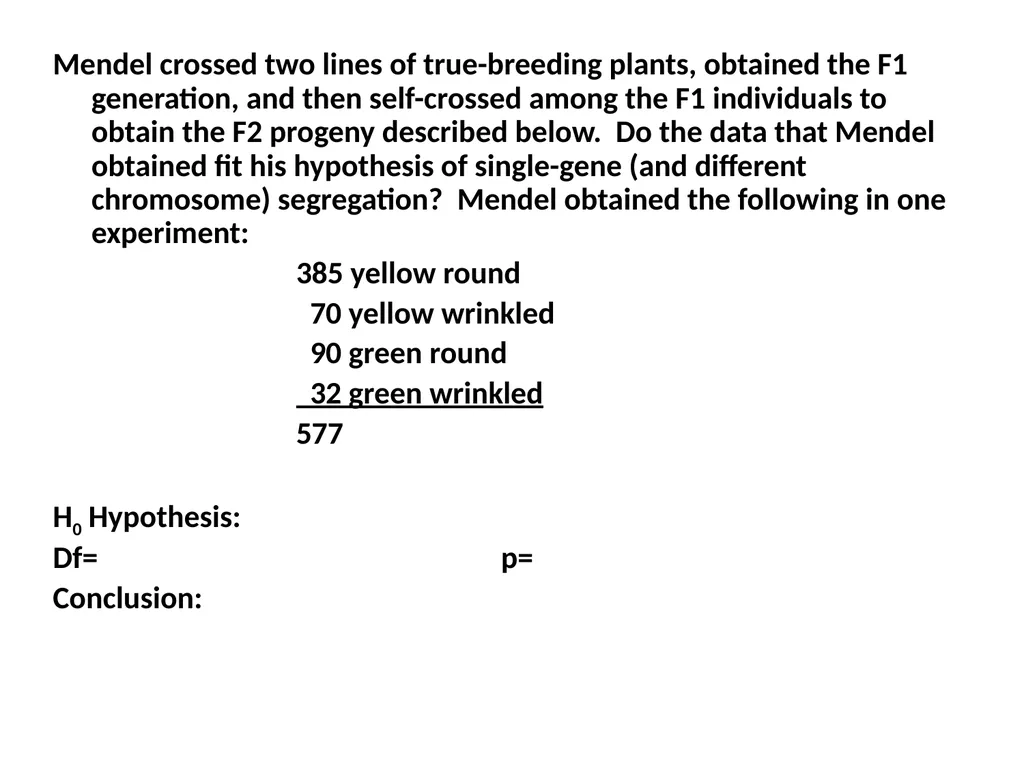
Mendel crossed two lines of true-breeding plants, obtained the F1 generation, and then self-crossed among the F1 individuals to obtain the F2 progeny described below. Do the data that Mendel obtained fit his hypothesis of single-gene (and different chromosome) segregation? Mendel obtained the following in one experiment:
385 yellow round
70 yellow wrinkled
90 green round
32 green wrinkled
577
H0 Hypothesis:
Df= p=
Conclusion:<br>
08
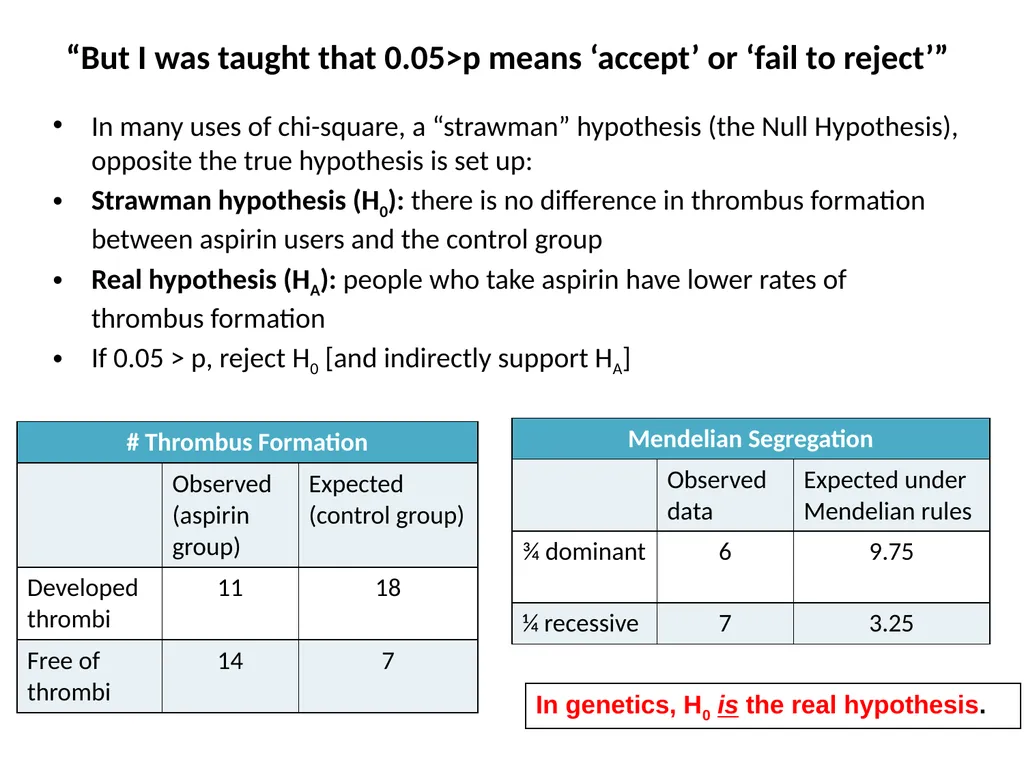
“But I was taught that 0.05>p means ‘accept’ or ‘fail to reject’” In many uses of chi-square, a “strawman” hypothesis (the Null Hypothesis), opposite the true hypothesis is set up:
Strawman hypothesis (H0): there is no difference in thrombus formation between aspirin users and the control group
Real hypothesis (HA): people who take aspirin have lower rates of thrombus formation
If 0.05 > p, reject H0 [and indirectly support HA] In genetics, H0 is the real hypothesis.<br>
09
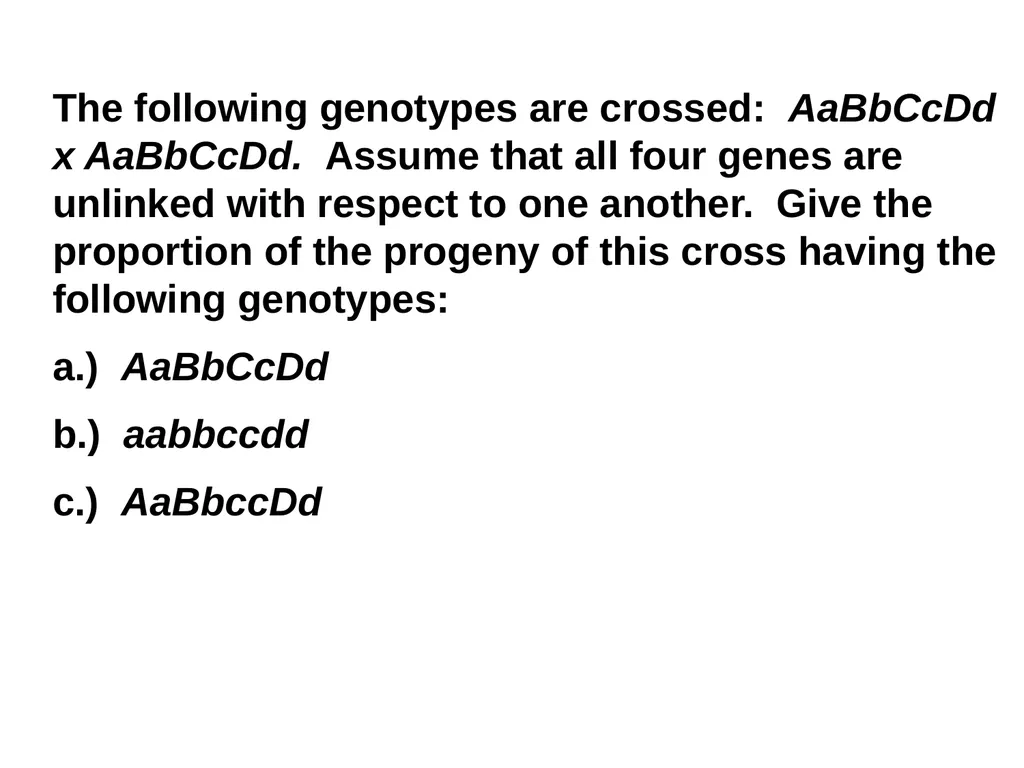
The following genotypes are crossed: AaBbCcDd x AaBbCcDd. Assume that all four genes are unlinked with respect to one another. Give the proportion of the progeny of this cross having the following genotypes:
a.) AaBbCcDd
b.) aabbccdd
c.) AaBbccDd<br>
10
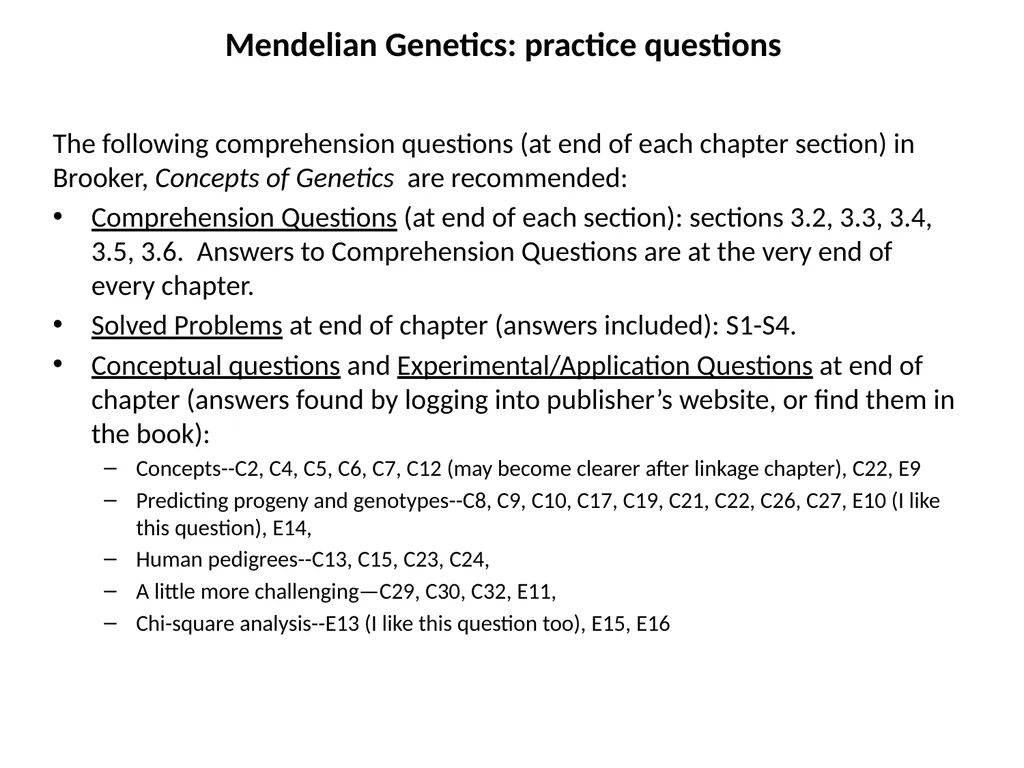
Mendelian Genetics: practice questions The following comprehension questions (at end of each chapter section) in Brooker, Concepts of Genetics are recommended:
Comprehension Questions (at end of each section): sections 3.2, 3.3, 3.4, 3.5, 3.6. Answers to Comprehension Questions are at the very end of every chapter.
Solved Problems at end of chapter (answers included): S1-S4.
Conceptual questions and Experimental/Application Questions at end of chapter (answers found by logging into publisher’s website, or find them in the book):
Concepts--C2, C4, C5, C6, C7, C12 (may become clearer after linkage chapter), C22, E9
Predicting progeny and genotypes--C8, C9, C10, C17, C19, C21, C22, C26, C27, E10 (I like this question), E14,
Human pedigrees--C13, C15, C23, C24,
A little more challenging—C29, C30, C32, E11,
Chi-square analysis--E13 (I like this question too), E15, E16<br>
11
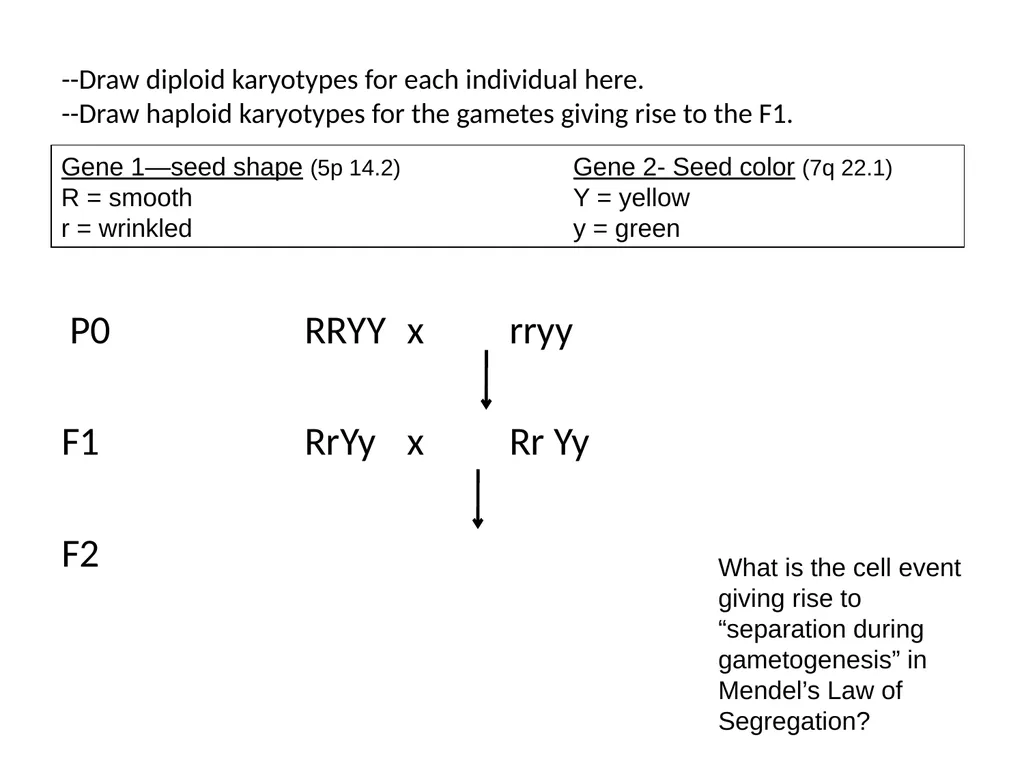
--Draw diploid karyotypes for each individual here. --Draw haploid karyotypes for the gametes giving rise to the F1. P0 RRYY x rryy
F1 RrYy x Rr Yy
F2 Gene 1—seed shape (5p 14.2) Gene 2- Seed color (7q 22.1)
R = smooth Y = yellow
r = wrinkled y = green What is the cell event giving rise to “separation during gametogenesis” in Mendel’s Law of Segregation?<br>
12
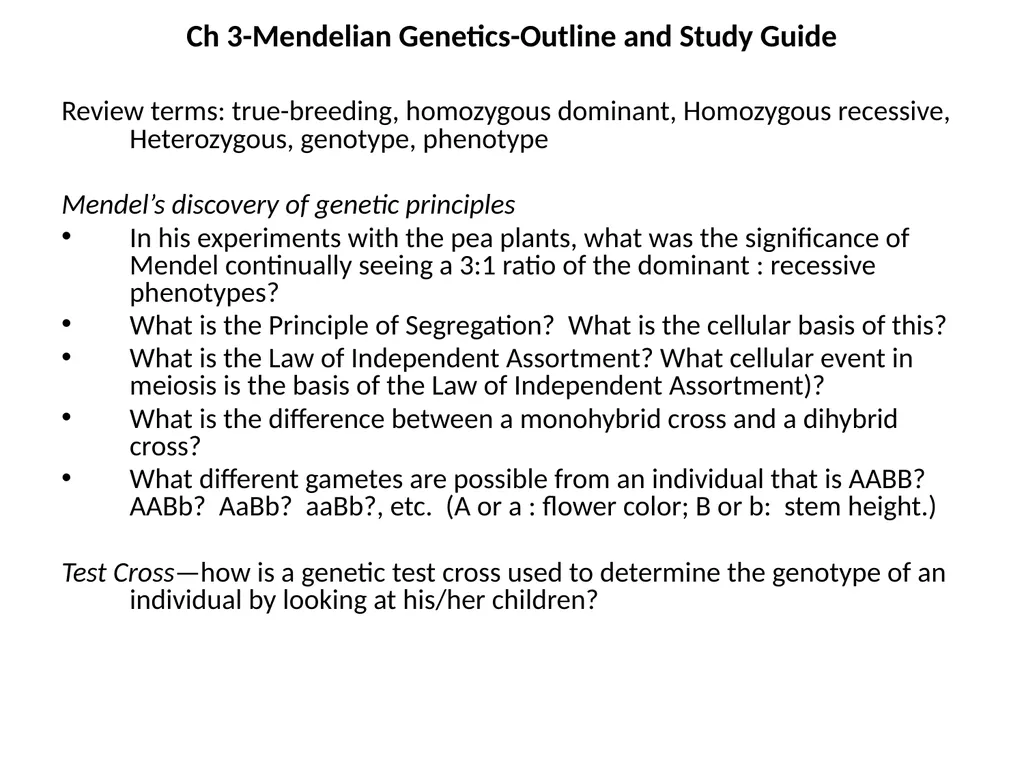
Ch 3-Mendelian Genetics-Outline and Study Guide Review terms: true-breeding, homozygous dominant, Homozygous recessive, Heterozygous, genotype, phenotype
Mendel’s discovery of genetic principles
In his experiments with the pea plants, what was the significance of Mendel continually seeing a 3:1 ratio of the dominant : recessive phenotypes?
What is the Principle of Segregation? What is the cellular basis of this?
What is the Law of Independent Assortment? What cellular event in meiosis is the basis of the Law of Independent Assortment)?
What is the difference between a monohybrid cross and a dihybrid cross?
What different gametes are possible from an individual that is AABB? AABb? AaBb? aaBb?, etc. (A or a : flower color; B or b: stem height.)
Test Cross—how is a genetic test cross used to determine the genotype of an individual by looking at his/her children?<br>
13
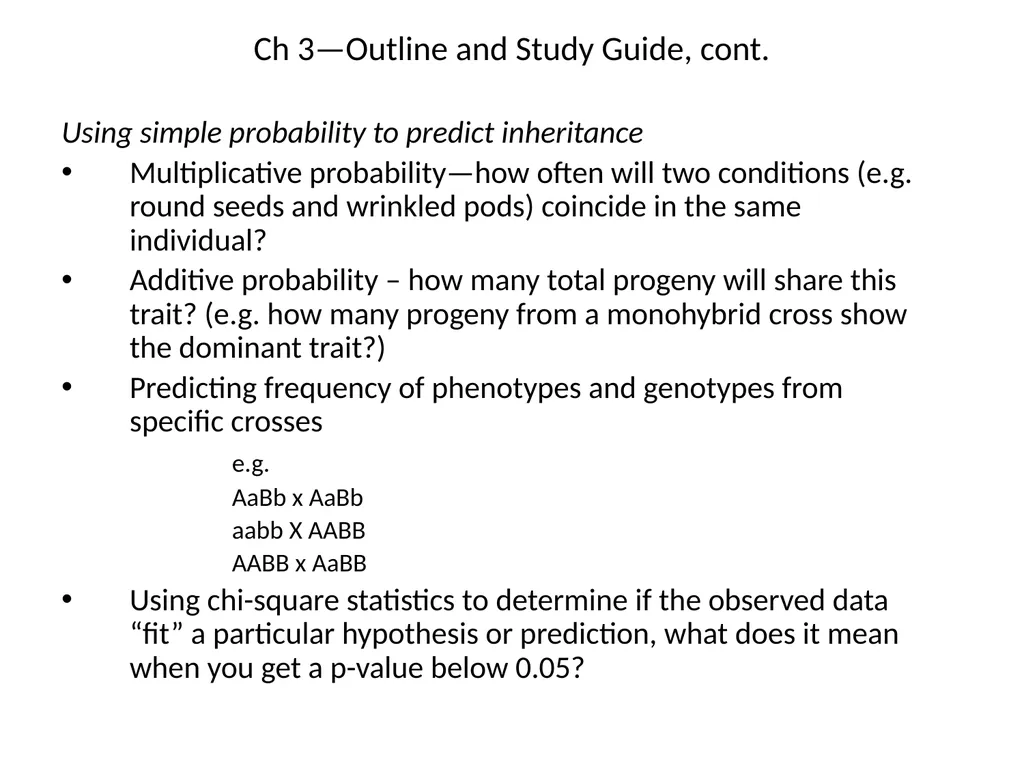
Ch 3—Outline and Study Guide, cont. Using simple probability to predict inheritance
Multiplicative probability—how often will two conditions (e.g. round seeds and wrinkled pods) coincide in the same individual?
Additive probability – how many total progeny will share this trait? (e.g. how many progeny from a monohybrid cross show the dominant trait?)
Predicting frequency of phenotypes and genotypes from specific crosses
e.g.
AaBb x AaBb
aabb X AABB
AABB x AaBB
Using chi-square statistics to determine if the observed data “fit” a particular hypothesis or prediction, what does it mean when you get a p-value below 0.05?<br>