
World Economic Outlook 18 August 2016 Sara






















Description: World Economic Outlook 18 August 2016 Sara Johnson, Senior Research Director, Global Economics 1 781 301 9115, sara.johnsonihsmarkit.com Economics Global economic growth remains subdued Global growth will remain below 3 in 2017 as
Related Topics
Download Presentation
"World Economic Outlook 18 August 2016 Sara" is the property of its rightful owner. Permission is granted to download and print the materials on this website for personal, non-commercial use only, and to display it on your personal computer provided you do not modify the materials and that you retain all copyright notices contained in the materials. By downloading content from our website, you accept the terms of this agreement.
Presentation Transcript
slide1. World Economic Outlook 18 August 2016 Sara Johnson, Senior Research Director, Global Economics
+1 781 301 9115, sara.johnson@ihsmarkit.com Economics<br>
slide2. Global economic growth remains subdued Global growth will remain below 3% in 2017 as slowdowns in Europe and China offset accelerations in the United States and emerging markets.
US economic growth will pick up from 1.6% in 2016 to 2.4% in 2017, led by consumer spending and homebuilding.
Economic and political uncertainty will hurt UK investment, consumer spending, and capital inflows, stalling UK growth in the year ahead.
Eurozone growth is projected to slow from 1.5% in 2016 to 1.1% in 2017, reflecting increased political instability and banking problems.
China’s economic growth will slow further because of imbalances in credit, housing, and industrial markets.
Recessions in Brazil and Russia are abating. 2 US Economic Outlook / August 2016<br>
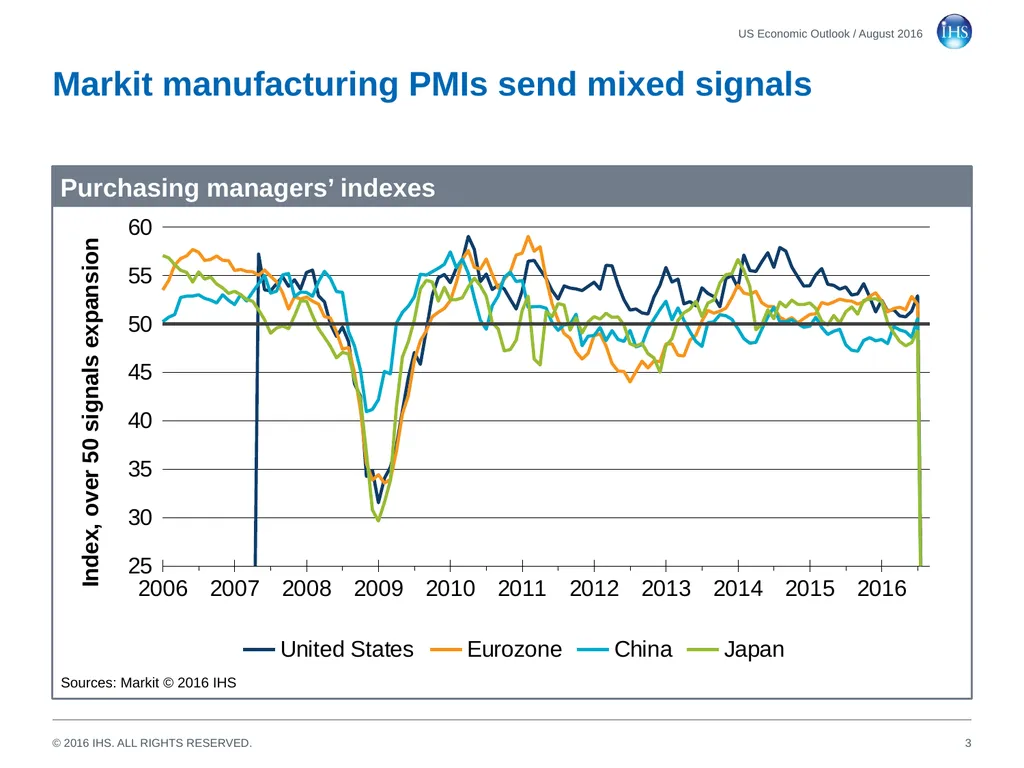
slide3. (Index, over 50 indicates expansion) Markit manufacturing PMIs send mixed signals 3 US Economic Outlook / August 2016 Purchasing managers’ indexes Sources: Markit © 2016 IHS<br>
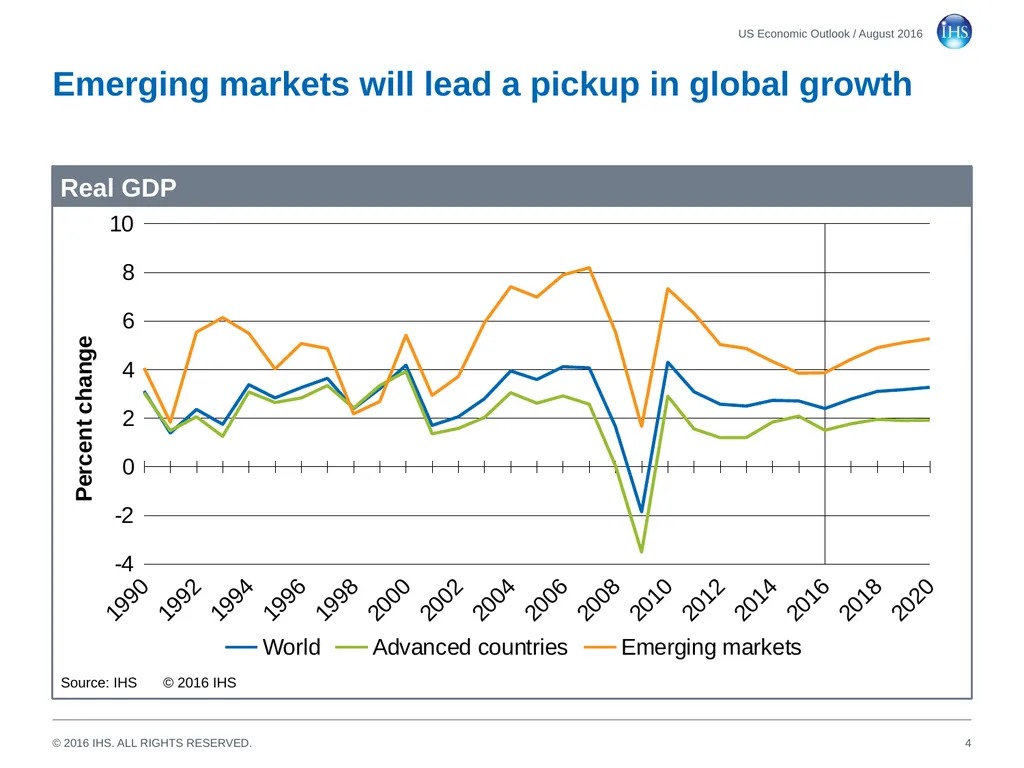
slide4. Emerging markets will lead a pickup in global growth 4 US Economic Outlook / August 2016 Real GDP Source: IHS © 2016 IHS<br>
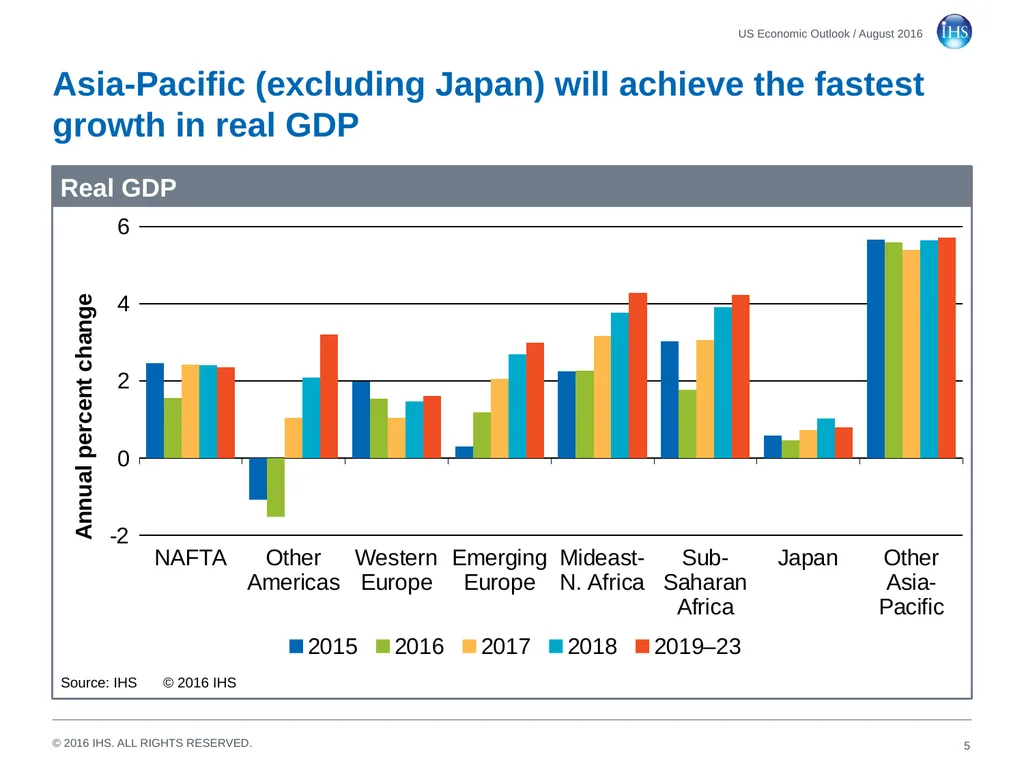
slide5. Asia-Pacific (excluding Japan) will achieve the fastest growth in real GDP 5 US Economic Outlook / August 2016 Real GDP Source: IHS © 2016 IHS<br>
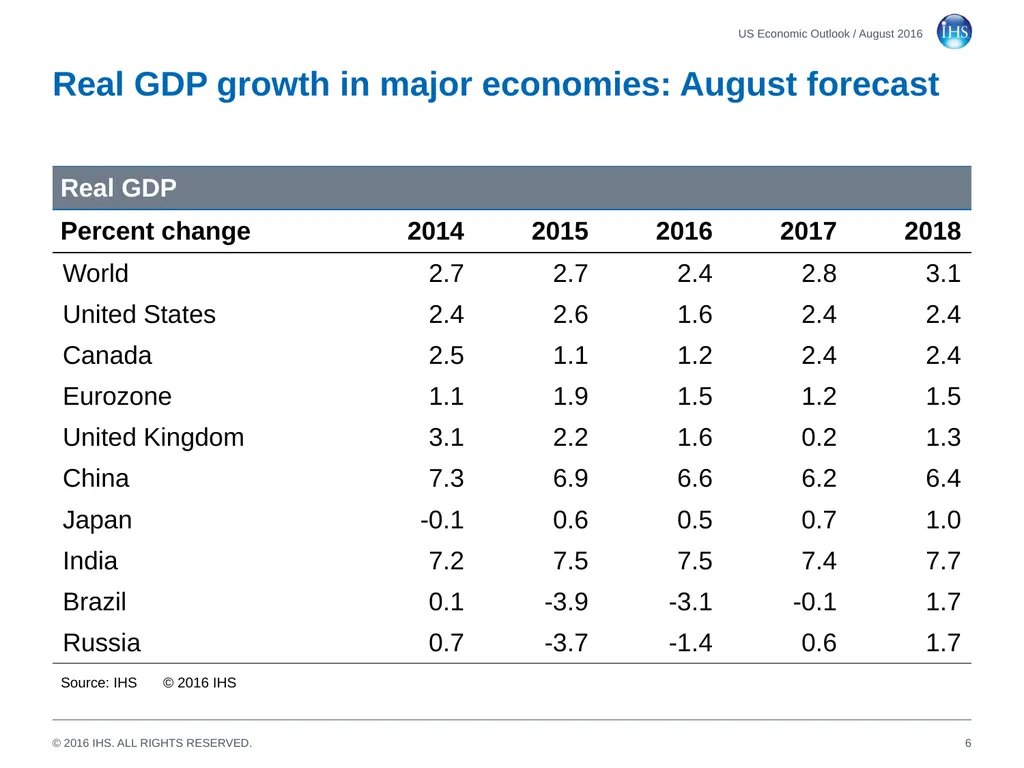
slide6. Real GDP growth in major economies: August forecast 6 US Economic Outlook / August 2016 Source: IHS © 2016 IHS<br>
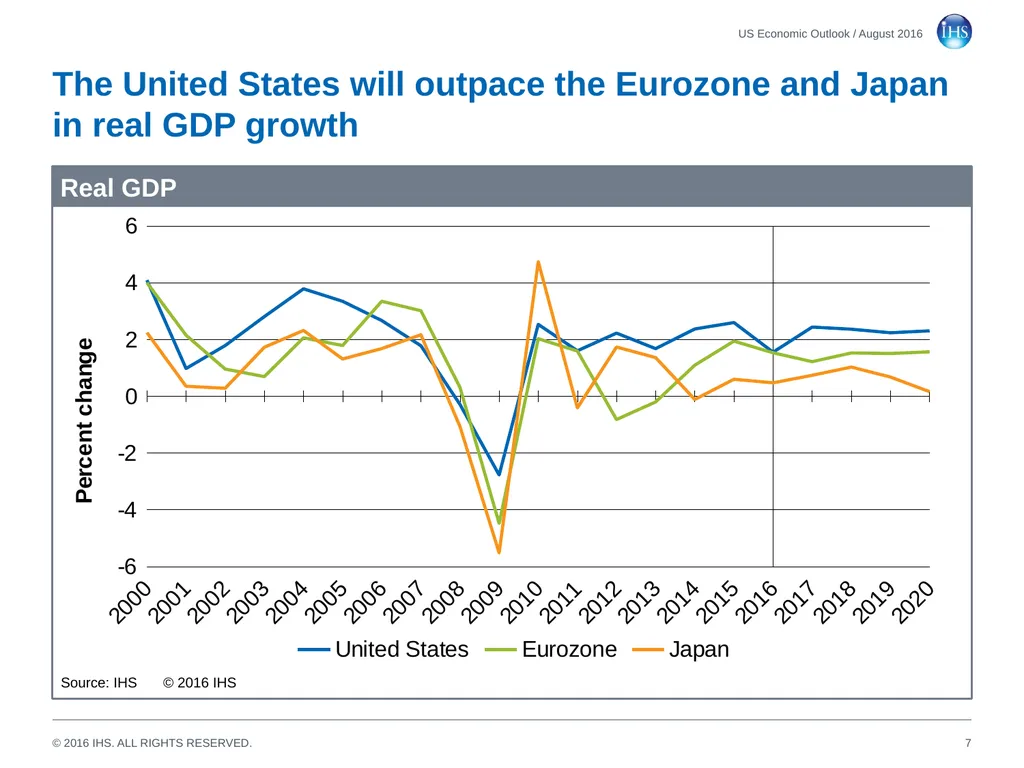
slide7. The United States will outpace the Eurozone and Japan in real GDP growth 7 US Economic Outlook / August 2016 Real GDP Source: IHS © 2016 IHS<br>
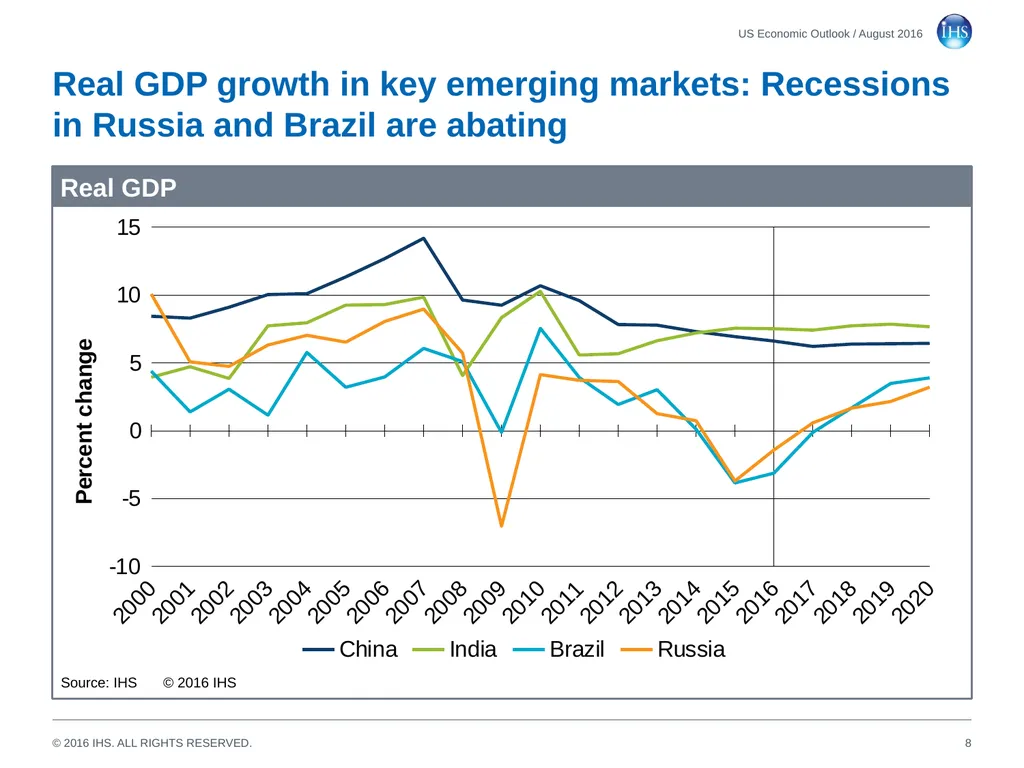
slide8. Real GDP growth in key emerging markets: Recessions in Russia and Brazil are abating 8 US Economic Outlook / August 2016 Real GDP Source: IHS © 2016 IHS<br>
slide9. The era of rapid growth in world trade has ended 9 US Economic Outlook / August 2016 Real GDP and trade Source: IHS © 2016 IHS<br>
slide10. Why has growth in world trade slowed? 10 US Economic Outlook / August 2016<br>
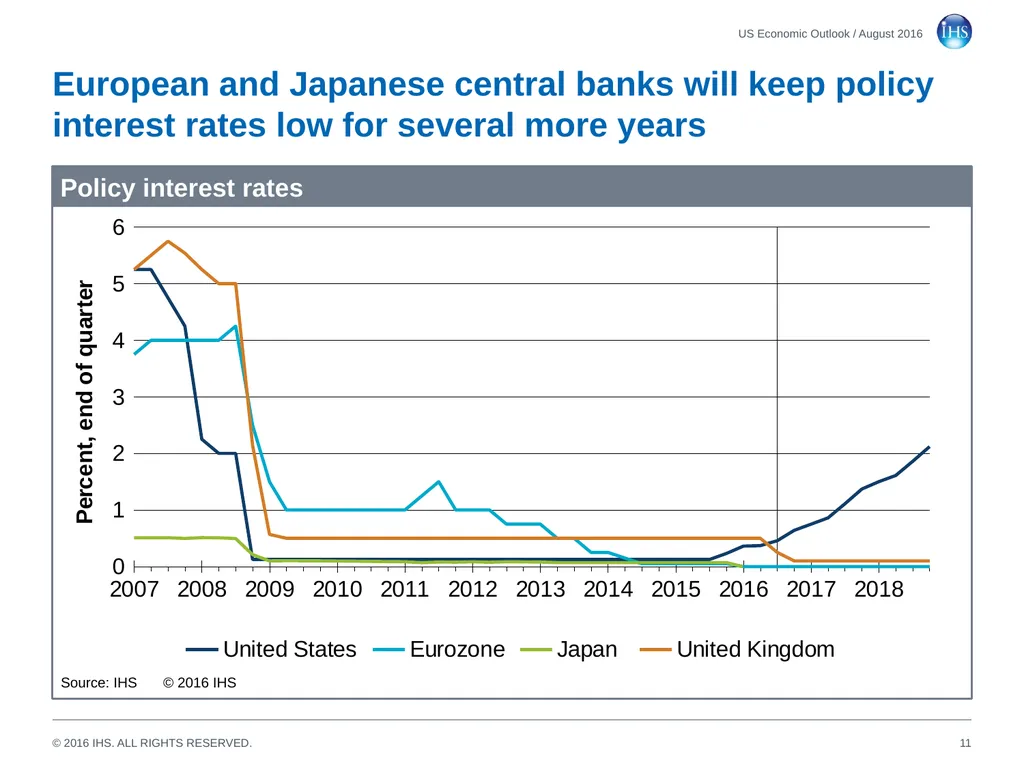
slide11. European and Japanese central banks will keep policy interest rates low for several more years 11 US Economic Outlook / August 2016 Policy interest rates Source: IHS © 2016 IHS<br>
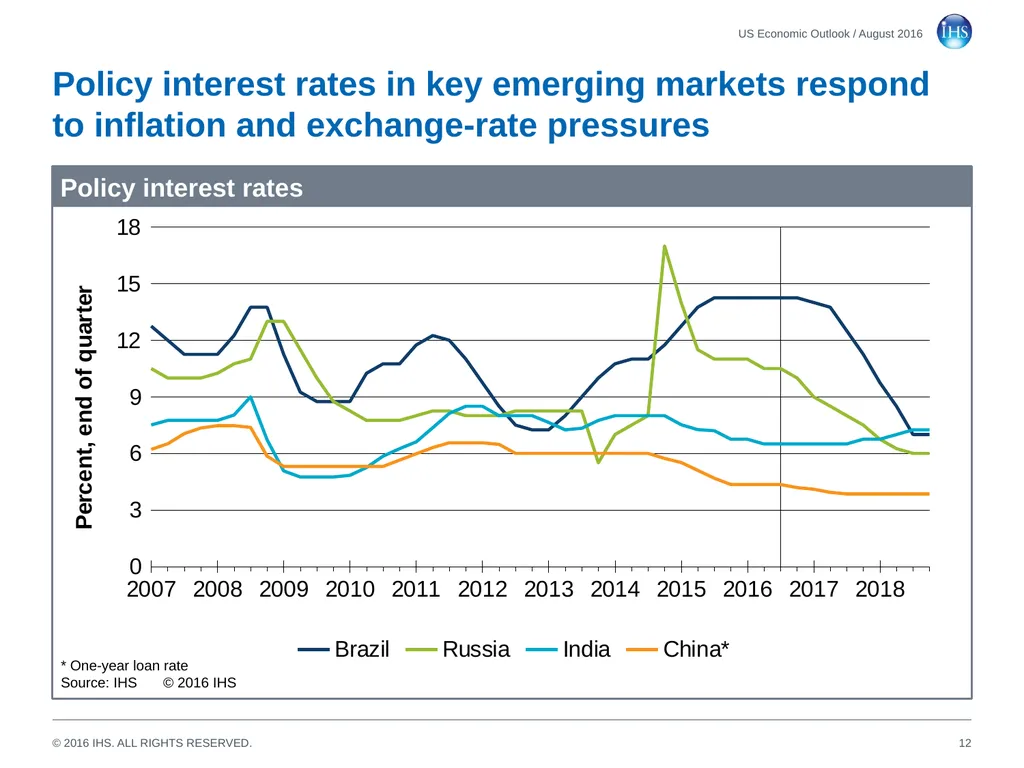
slide12. Policy interest rates in key emerging markets respond to inflation and exchange-rate pressures 12 US Economic Outlook / August 2016 Policy interest rates * One-year loan rate
Source: IHS © 2016 IHS<br>
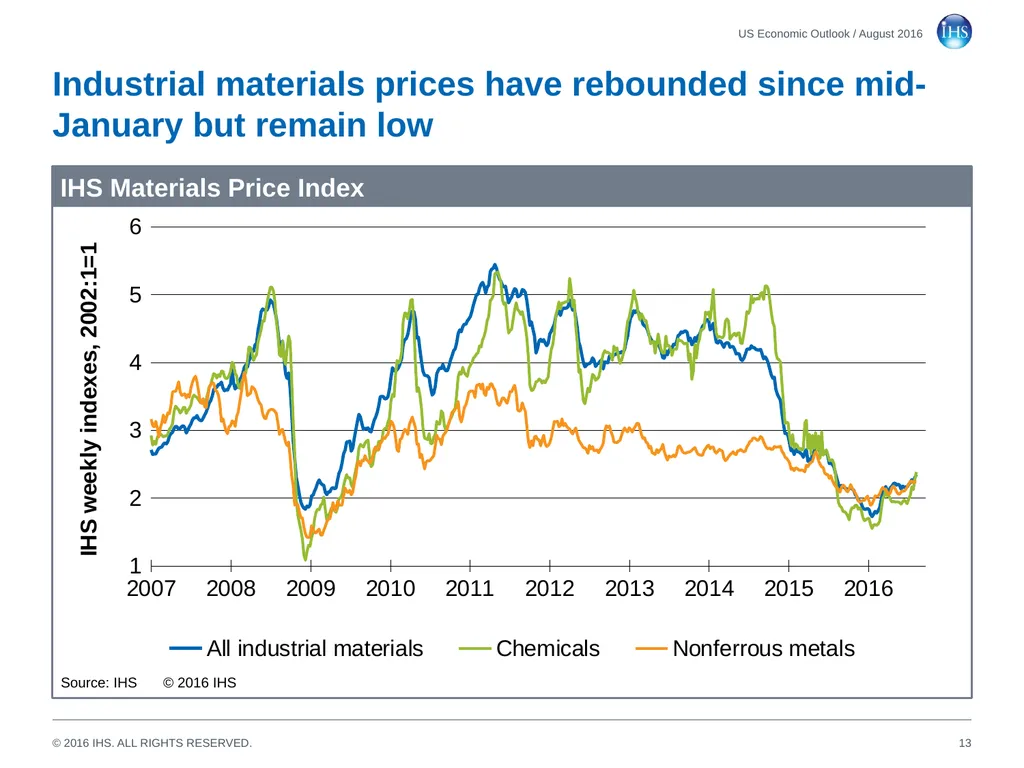
slide13. Industrial materials prices have rebounded since mid-January but remain low IHS Materials Price Index Source: IHS © 2016 IHS US Economic Outlook / August 2016 13<br>
slide14. The global crude-oil market returns to balance High product stocks will restrain prices in the near term.
After significant surpluses in 2015 and the first half of 2016, the global liquids market will return to balance in late 2016 and in 2017.
A continuing decline in US oil production into 2017 will be key to supporting oil prices.
The United States, China, and India drive global oil demand growth.
Reduced economic growth in the United Kingdom and European Union will lead to some modest reduction in oil demand, but the low oil intensity of European countries mitigates the downside risk.
The price of Dated Brent is projected to average USD44 per barrel in 2016, USD57 in 2017, and USD64 in 2018. 14 US Economic Outlook / August 2016<br>
slide15. Crude-oil prices will gradually recover 15 US Economic Outlook / August 2016 Price of Dated Brent crude oil Source: IHS © 2016 IHS<br>
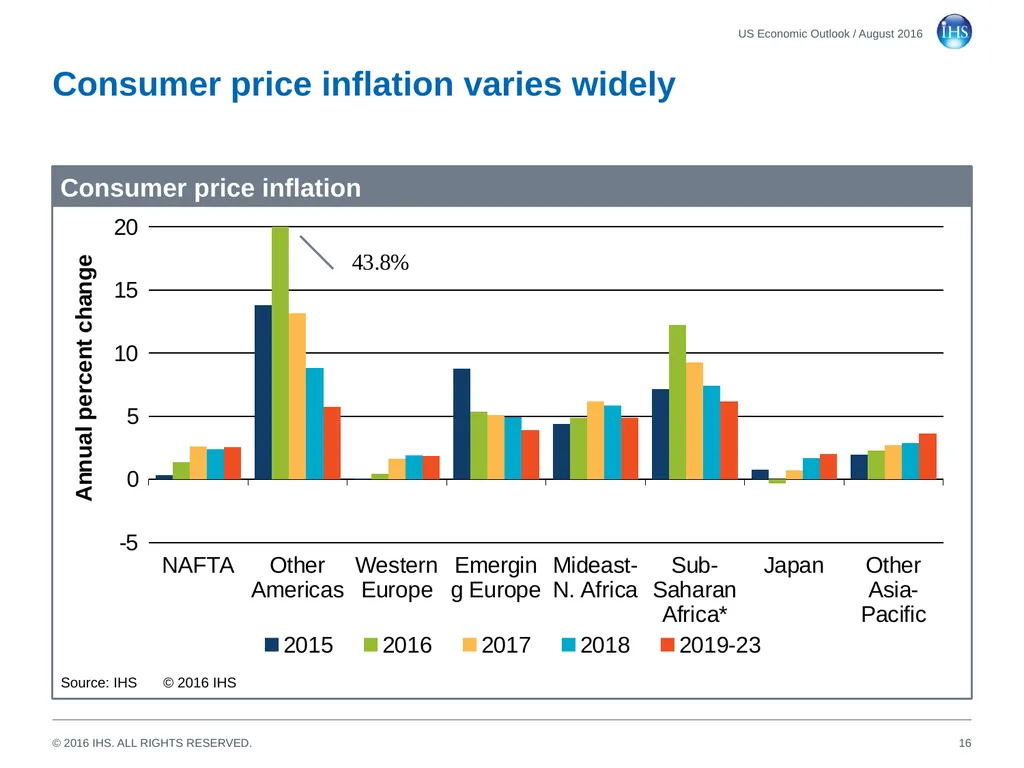
slide16. Consumer price inflation varies widely 16 US Economic Outlook / August 2016 Consumer price inflation Source: IHS © 2016 IHS<br>
slide17. The drop in oil prices has erased the Middle East’s current-account surplus 17 US Economic Outlook / August 2016 Current-account balances Source: IHS © 2016 IHS<br>
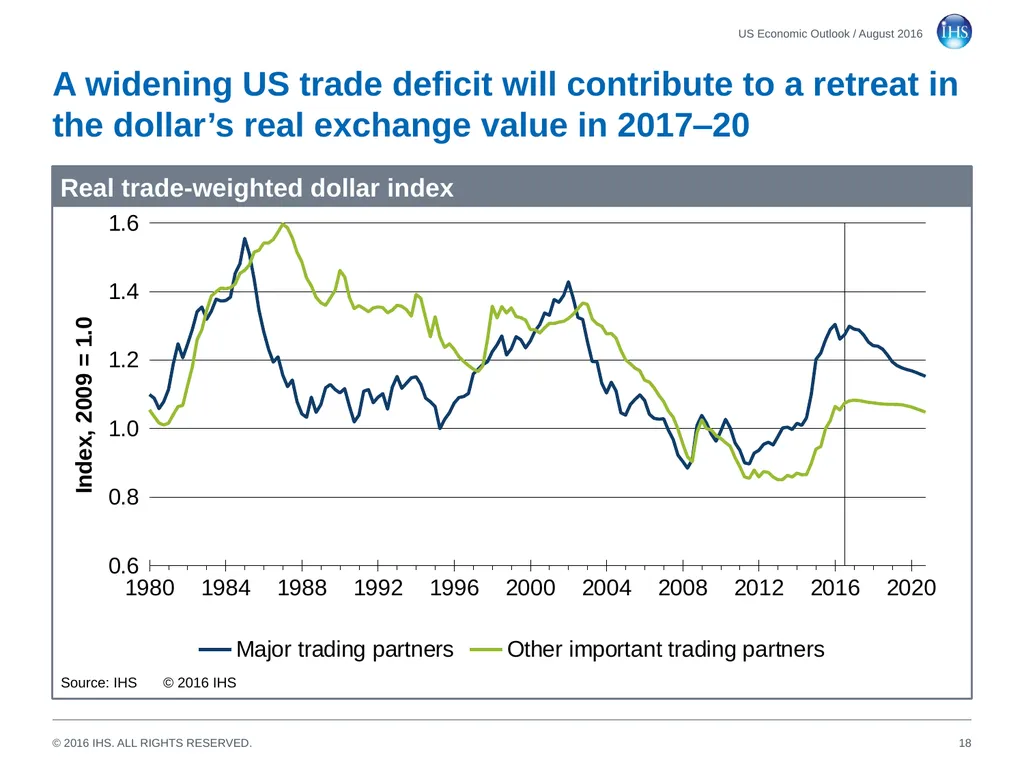
slide18. A widening US trade deficit will contribute to a retreat in the dollar’s real exchange value in 2017‒20 18 US Economic Outlook / August 2016 Real trade-weighted dollar index Source: IHS © 2016 IHS<br>
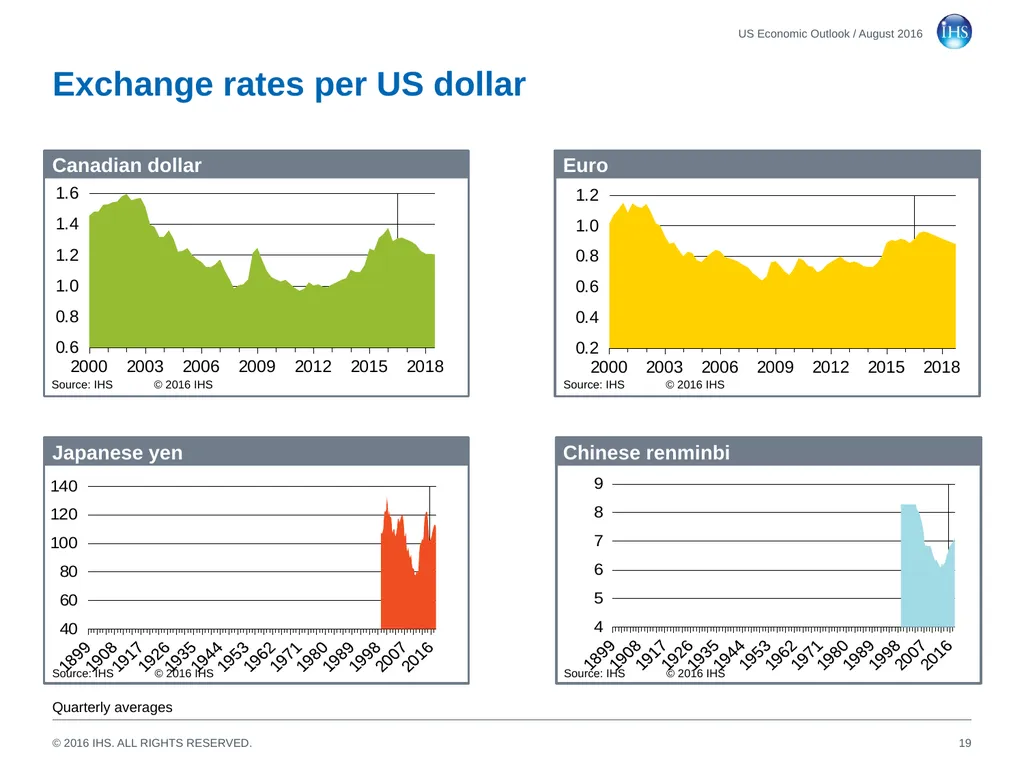
slide19. Exchange rates per US dollar 19 US Economic Outlook / August 2016 Quarterly averages Canadian dollar Japanese yen Euro Chinese renminbi Source: IHS © 2016 IHS Source: IHS © 2016 IHS Source: IHS © 2016 IHS Source: IHS © 2016 IHS<br>
slide20. The euro will depreciate further against the US dollar before recovering 20 US Economic Outlook / August 2016 Euro exchange rate Source: IHS © 2016 IHS<br>
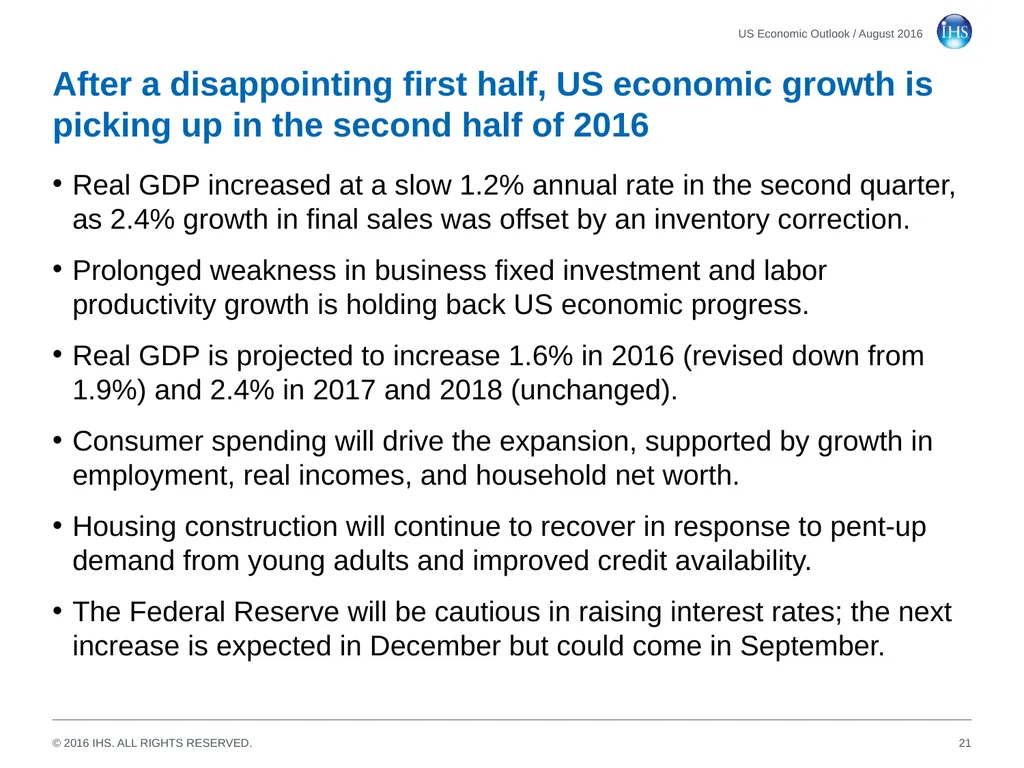
slide21. After a disappointing first half, US economic growth is picking up in the second half of 2016 Real GDP increased at a slow 1.2% annual rate in the second quarter, as 2.4% growth in final sales was offset by an inventory correction.
Prolonged weakness in business fixed investment and labor productivity growth is holding back US economic progress.
Real GDP is projected to increase 1.6% in 2016 (revised down from 1.9%) and 2.4% in 2017 and 2018 (unchanged).
Consumer spending will drive the expansion, supported by growth in employment, real incomes, and household net worth.
Housing construction will continue to recover in response to pent-up demand from young adults and improved credit availability.
The Federal Reserve will be cautious in raising interest rates; the next increase is expected in December but could come in September. 21 US Economic Outlook / August 2016<br>
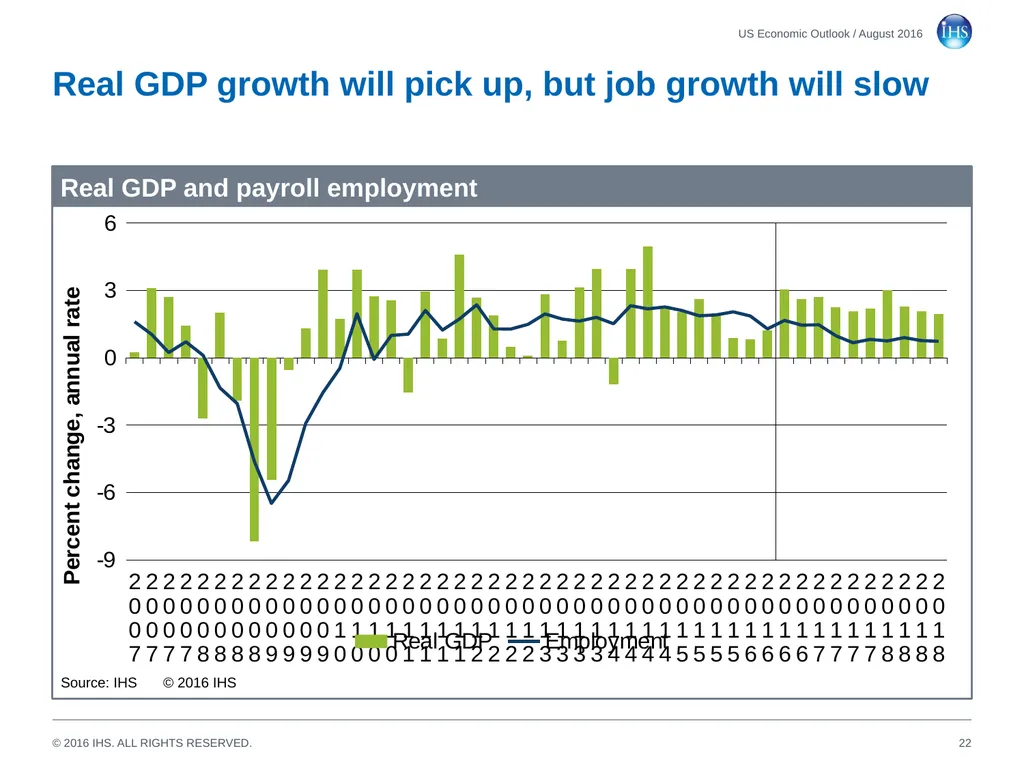
slide22. Real GDP growth will pick up, but job growth will slow 22 US Economic Outlook / August 2016 Real GDP and payroll employment Source: IHS © 2016 IHS<br>
slide23. US economic growth by sector 23 US Economic Outlook / August 2016<br>
slide24. Canada’s energy sector is holding back growth Wildfires near Alberta’s oil sands fields temporarily disrupted production in the second quarter, causing a setback to real GDP.
Fiscal stimulus will support near-term growth, but declining investment in resource industries will restrain it.
The Bank of Canada should keep its policy rate at 0.50% through the summer of 2017 to support economic growth.
The Canadian dollar and oil prices will gradually recover in 2017–20.
Regional performances have diverged, with weakness in Alberta, Saskatchewan, and Newfoundland, but strength in British Columbia, Ontario, and Manitoba.
Housing prices and construction are surging in Vancouver and Toronto, but declining in Calgary. 24 US Economic Outlook / August 2016<br>
slide25. Canada’s real GDP and industrial production growth 25 US Economic Outlook / August 2016 Real GDP and industrial production Source: IHS © 2016 IHS<br>
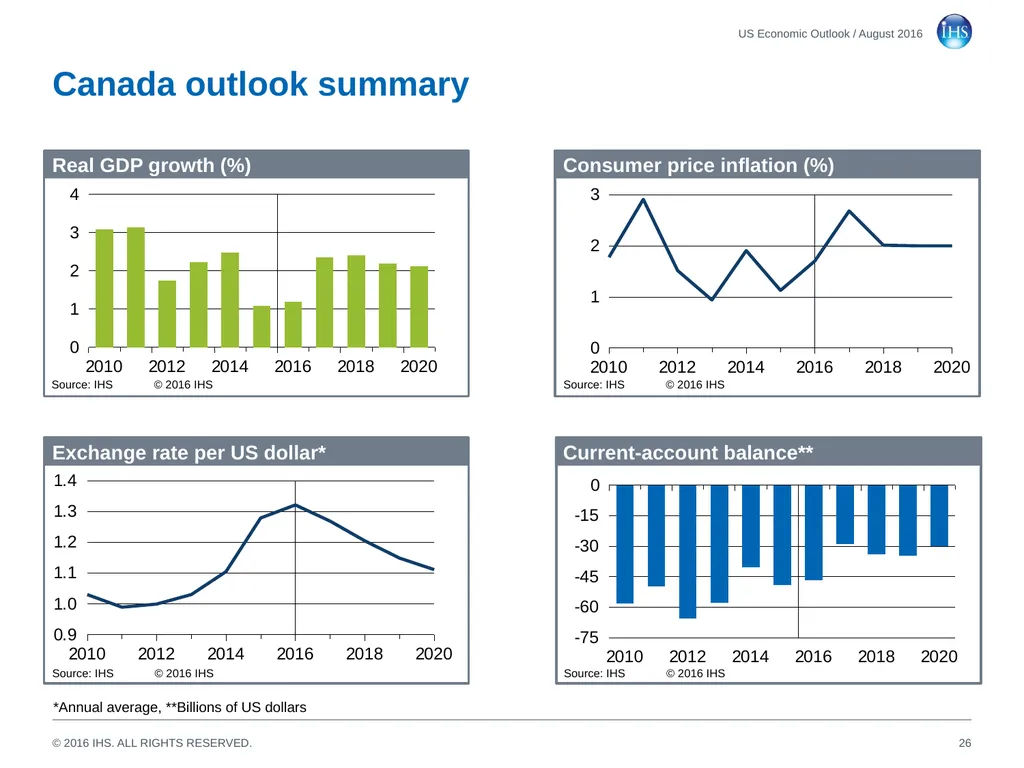
slide26. Canada outlook summary 26 US Economic Outlook / August 2016 *Annual average, **Billions of US dollars Real GDP growth (%) Exchange rate per US dollar* Consumer price inflation (%) Current-account balance** Source: IHS © 2016 IHS Source: IHS © 2016 IHS Source: IHS © 2016 IHS Source: IHS © 2016 IHS<br>
slide27. Canada’s economic growth by sector 27 US Economic Outlook / August 2016<br>
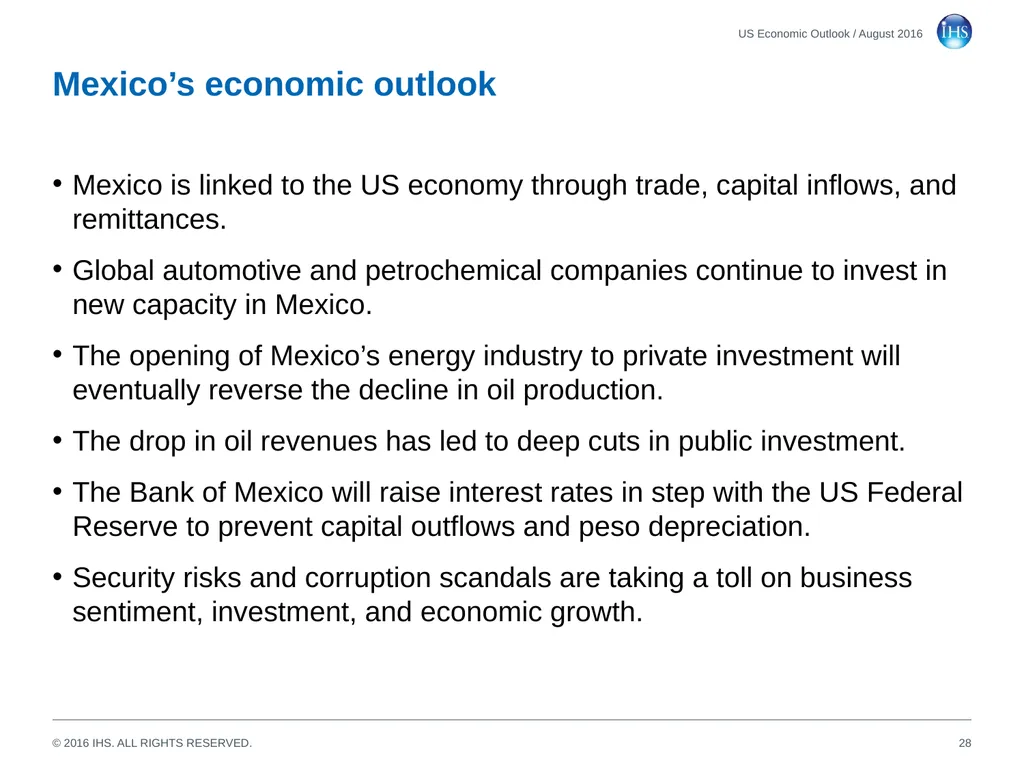
slide28. Mexico’s economic outlook Mexico is linked to the US economy through trade, capital inflows, and remittances.
Global automotive and petrochemical companies continue to invest in new capacity in Mexico.
The opening of Mexico’s energy industry to private investment will eventually reverse the decline in oil production.
The drop in oil revenues has led to deep cuts in public investment.
The Bank of Mexico will raise interest rates in step with the US Federal Reserve to prevent capital outflows and peso depreciation.
Security risks and corruption scandals are taking a toll on business sentiment, investment, and economic growth. 28 US Economic Outlook / August 2016<br>
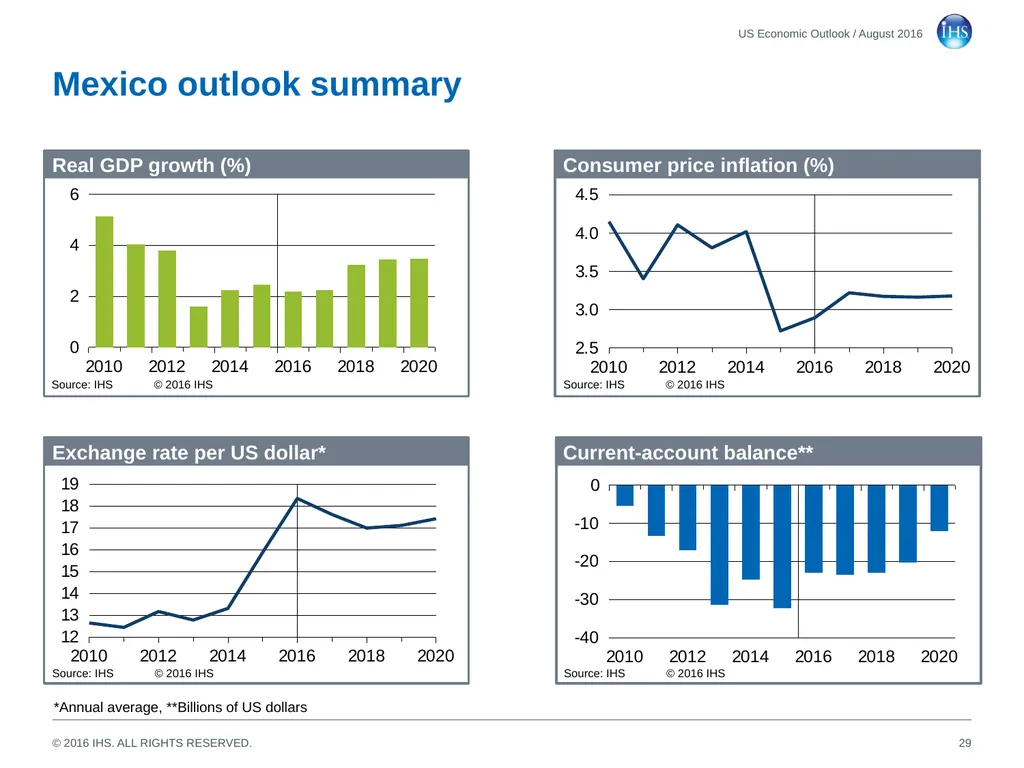
slide29. Mexico outlook summary 29 US Economic Outlook / August 2016 *Annual average, **Billions of US dollars Real GDP growth (%) Exchange rate per US dollar* Consumer price inflation (%) Current-account balance** Source: IHS © 2016 IHS Source: IHS © 2016 IHS Source: IHS © 2016 IHS Source: IHS © 2016 IHS<br>
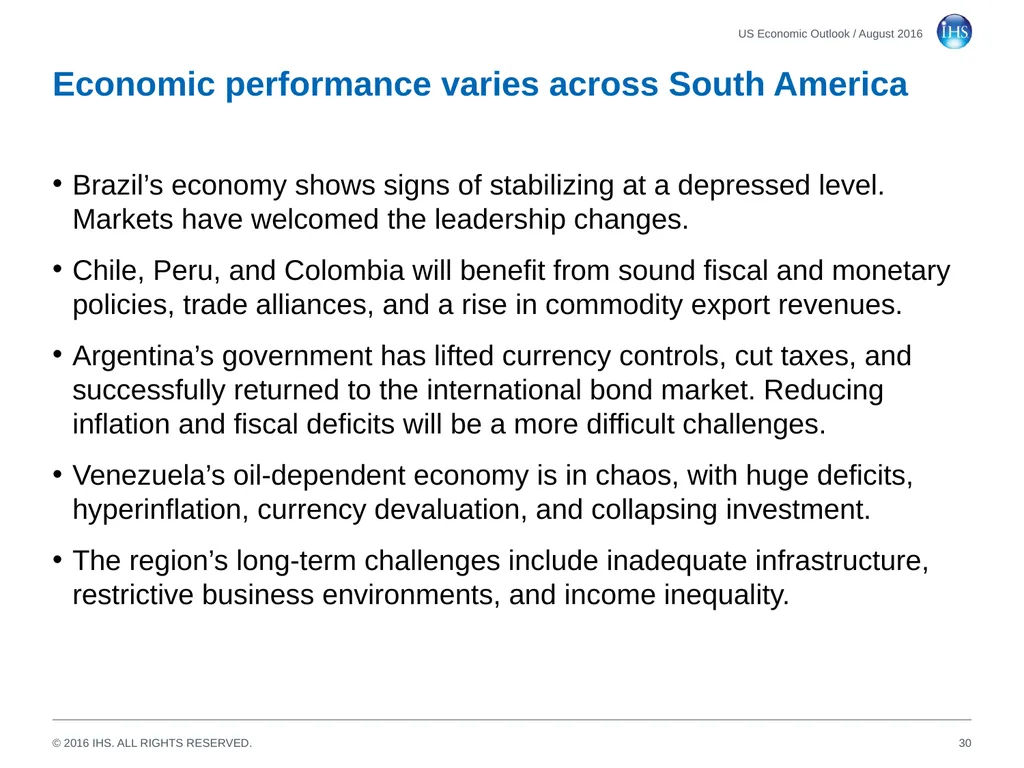
slide30. Economic performance varies across South America Brazil’s economy shows signs of stabilizing at a depressed level. Markets have welcomed the leadership changes.
Chile, Peru, and Colombia will benefit from sound fiscal and monetary policies, trade alliances, and a rise in commodity export revenues.
Argentina’s government has lifted currency controls, cut taxes, and successfully returned to the international bond market. Reducing inflation and fiscal deficits will be a more difficult challenges.
Venezuela’s oil-dependent economy is in chaos, with huge deficits, hyperinflation, currency devaluation, and collapsing investment.
The region’s long-term challenges include inadequate infrastructure, restrictive business environments, and income inequality. 30 US Economic Outlook / August 2016<br>
slide31. Real GDP growth in South America 31 US Economic Outlook / August 2016 Real GDP Source: IHS © 2016 IHS<br>
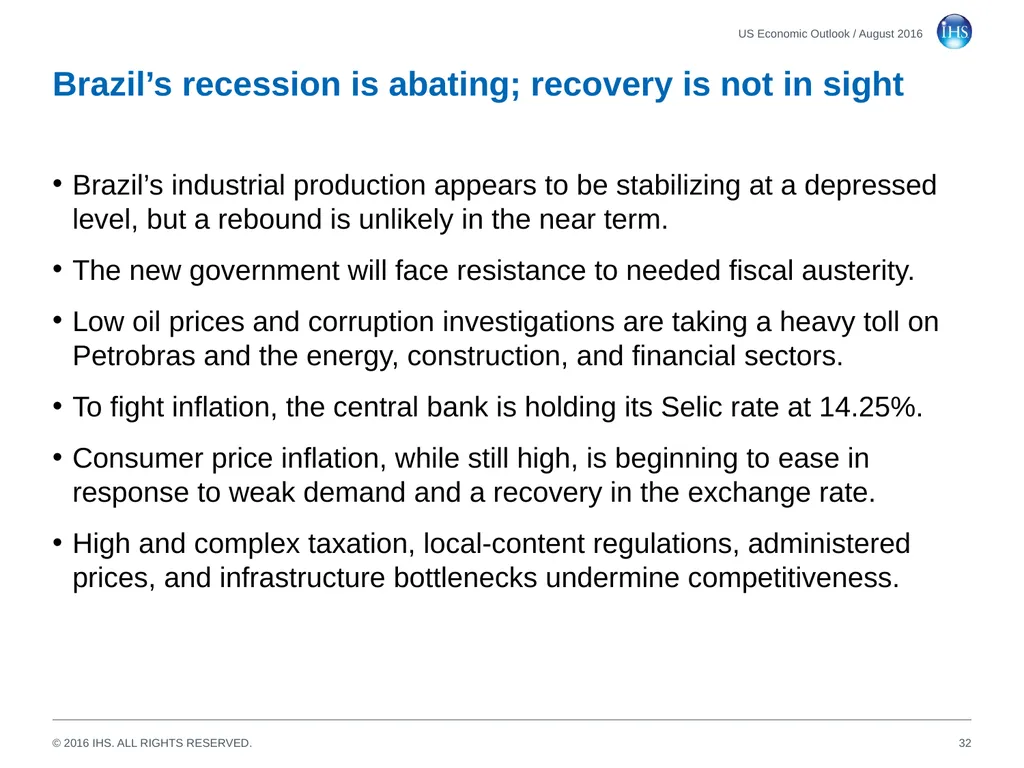
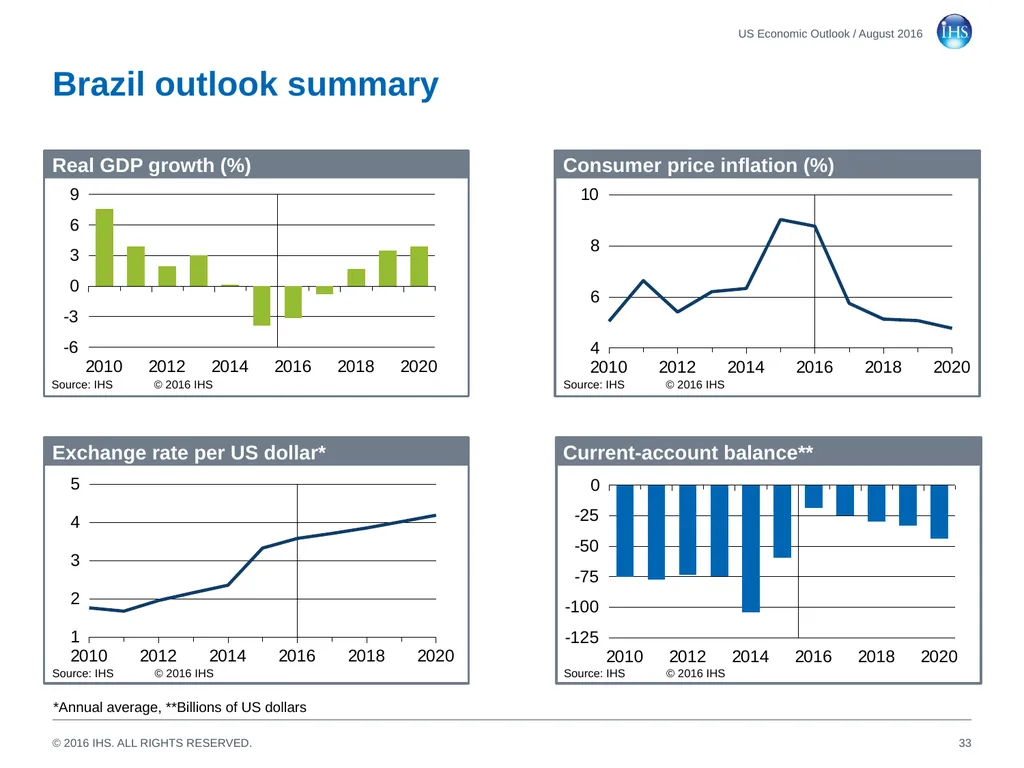
slide32. Brazil’s recession is abating; recovery is not in sight Brazil’s industrial production appears to be stabilizing at a depressed level, but a rebound is unlikely in the near term.
The new government will face resistance to needed fiscal austerity.
Low oil prices and corruption investigations are taking a heavy toll on Petrobras and the energy, construction, and financial sectors.
To fight inflation, the central bank is holding its Selic rate at 14.25%.
Consumer price inflation, while still high, is beginning to ease in response to weak demand and a recovery in the exchange rate.
High and complex taxation, local-content regulations, administered prices, and infrastructure bottlenecks undermine competitiveness. 32 US Economic Outlook / August 2016<br>
slide33. Brazil outlook summary 33 US Economic Outlook / August 2016 *Annual average, **Billions of US dollars Real GDP growth (%) Exchange rate per US dollar* Consumer price inflation (%) Current-account balance** Source: IHS © 2016 IHS Source: IHS © 2016 IHS Source: IHS © 2016 IHS Source: IHS © 2016 IHS<br>
slide34. Brazil’s economic growth by sector 34 US Economic Outlook / August 2016<br>
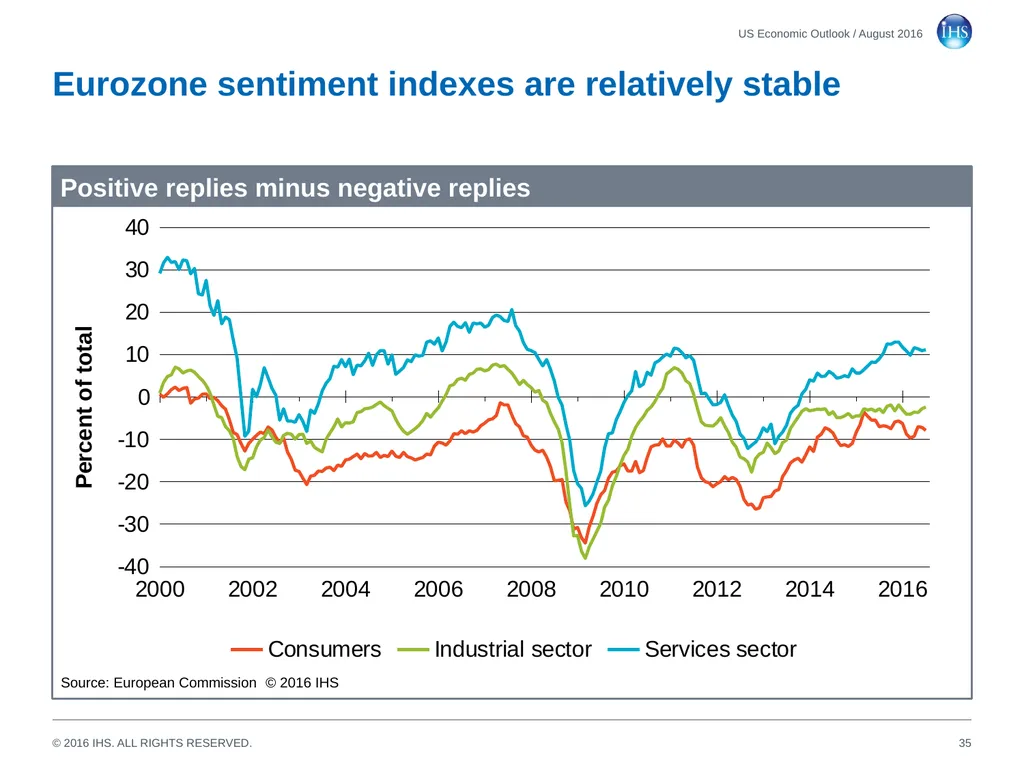
slide35. Eurozone sentiment indexes are relatively stable 35 US Economic Outlook / August 2016 Positive replies minus negative replies Source: European Commission © 2016 IHS<br>
slide36. Western Europe stays on a slow growth path Eurozone growth slowed in the second quarter, with a loss of momentum in consumer spending and business investment.
Increased uncertainty will discourage capital spending, although some investment will be diverted from the United Kingdom to EU countries.
Aggressive monetary stimulus, a weaker euro, and reduced fiscal headwinds will help sustain growth.
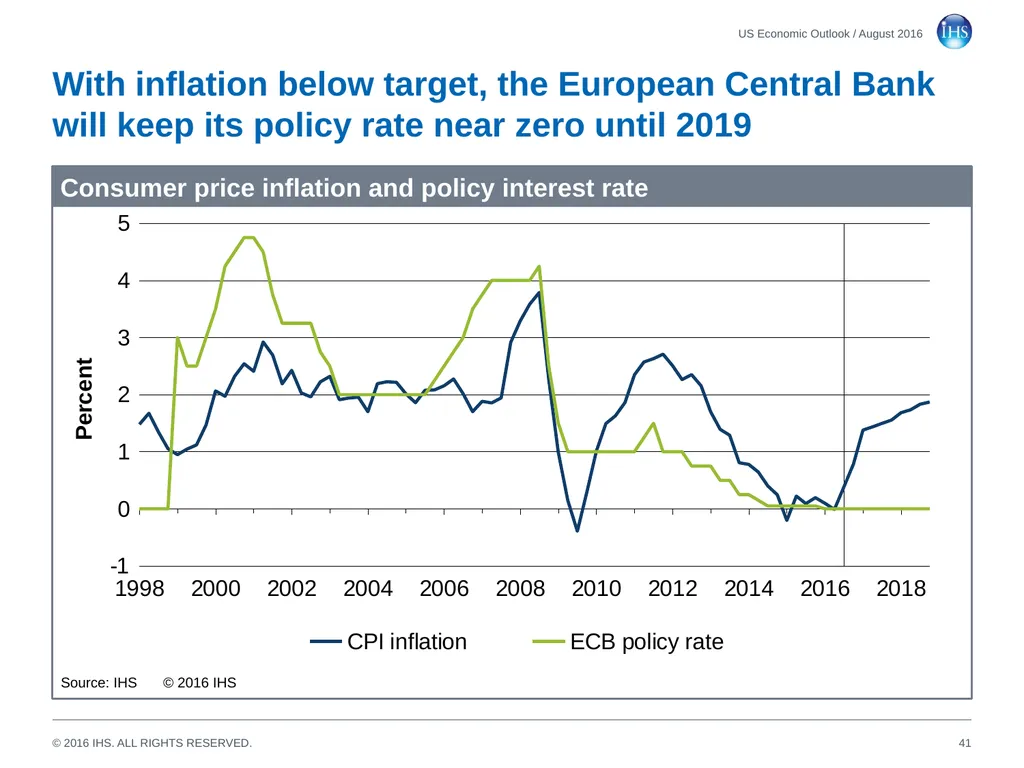
With inflation picking up only gradually, the European Central Bank (ECB) is not expected to raise interest rates until 2019.
The euro is projected to bottom out near USD1.04 in late 2016/early 2017 and then gradually recover to USD1.24 by the end of 2020.
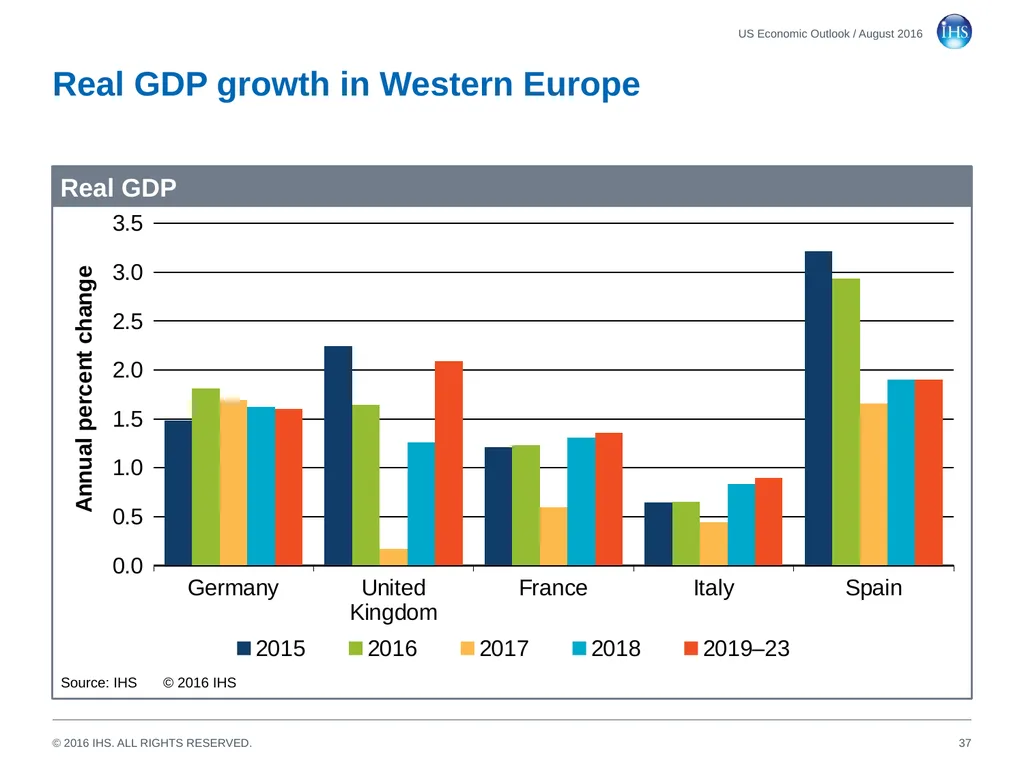
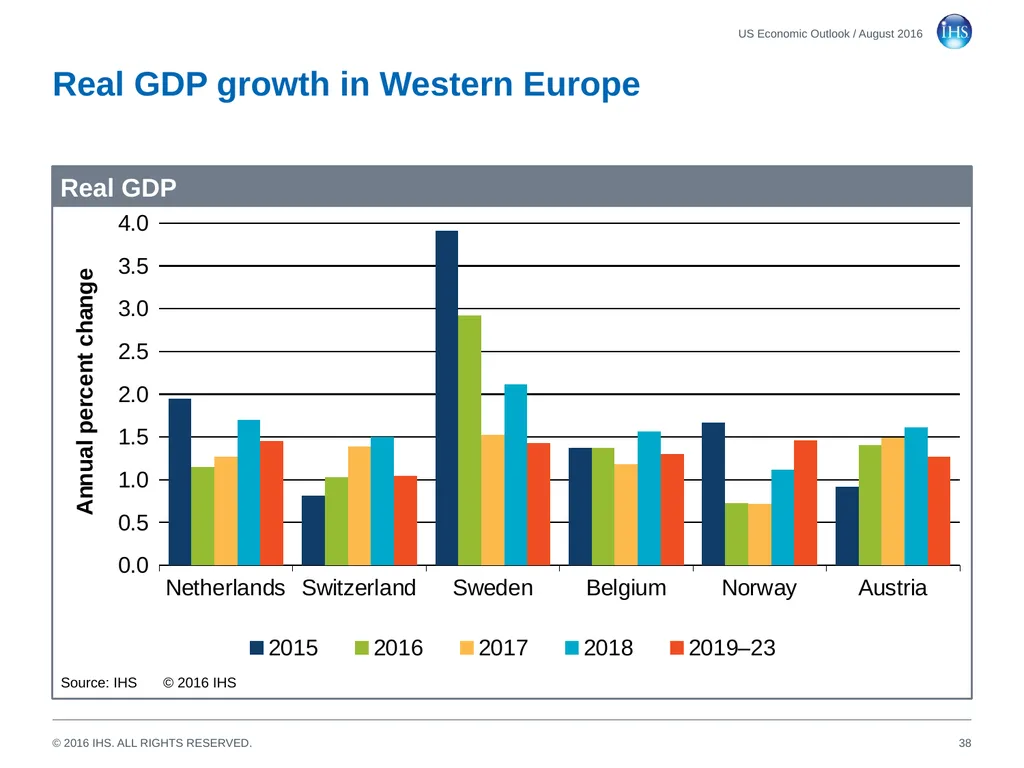
Ireland, Spain, and Sweden will maintain relatively healthy economic growth, but the United Kingdom, Italy, and France will struggle. 36 US Economic Outlook / August 2016<br>
slide37. Real GDP growth in Western Europe 37 US Economic Outlook / August 2016 Real GDP Source: IHS © 2016 IHS<br>
slide38. Real GDP growth in Western Europe 38 US Economic Outlook / August 2016 Real GDP Source: IHS © 2016 IHS<br>
slide39. Ten-year Eurozone government bond yields remain low 39 US Economic Outlook / August 2016 10-year government bond yields Source: IHS © 2016 IHS<br>
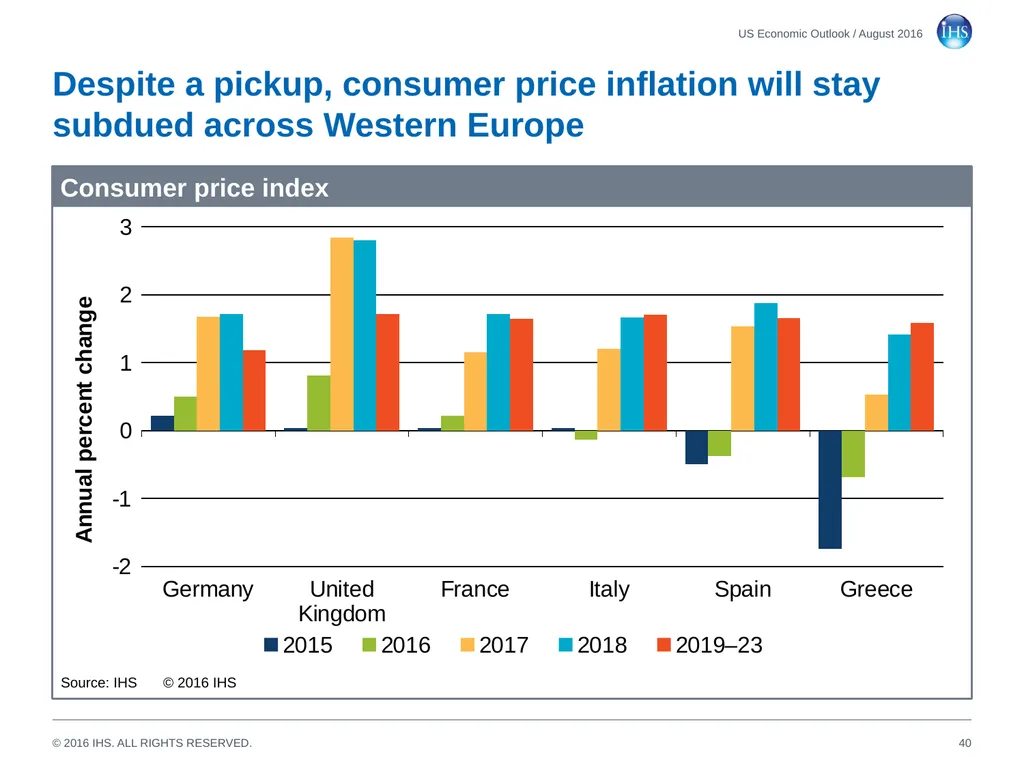
slide40. Despite a pickup, consumer price inflation will stay subdued across Western Europe 40 US Economic Outlook / August 2016 Consumer price index Source: IHS © 2016 IHS<br>
slide41. With inflation below target, the European Central Bank will keep its policy rate near zero until 2019 41 US Economic Outlook / August 2016 Consumer price inflation and policy interest rate Source: IHS © 2016 IHS<br>
slide42. The United Kingdom’s outlook is clouded by the vote to exit the European Union Real GDP growth picked up to 0.6% in the spring quarter, as strength in consumer spending was offset by weakness in business investment.
Our forecast assumes the United Kingdom invokes Article 50 in early 2017, initiating two years of negotiations on future UK-EU relations.
Uncertainty about the terms of Brexit is a major restraint on growth, leading to cutbacks in foreign and domestic investment.
A mild recession is expected in late 2016 and early 2017.
In early August, the Bank of England cut its policy rate from 0.50% to 0.25% and restarted quantitative easing. Fiscal policies remain tight.
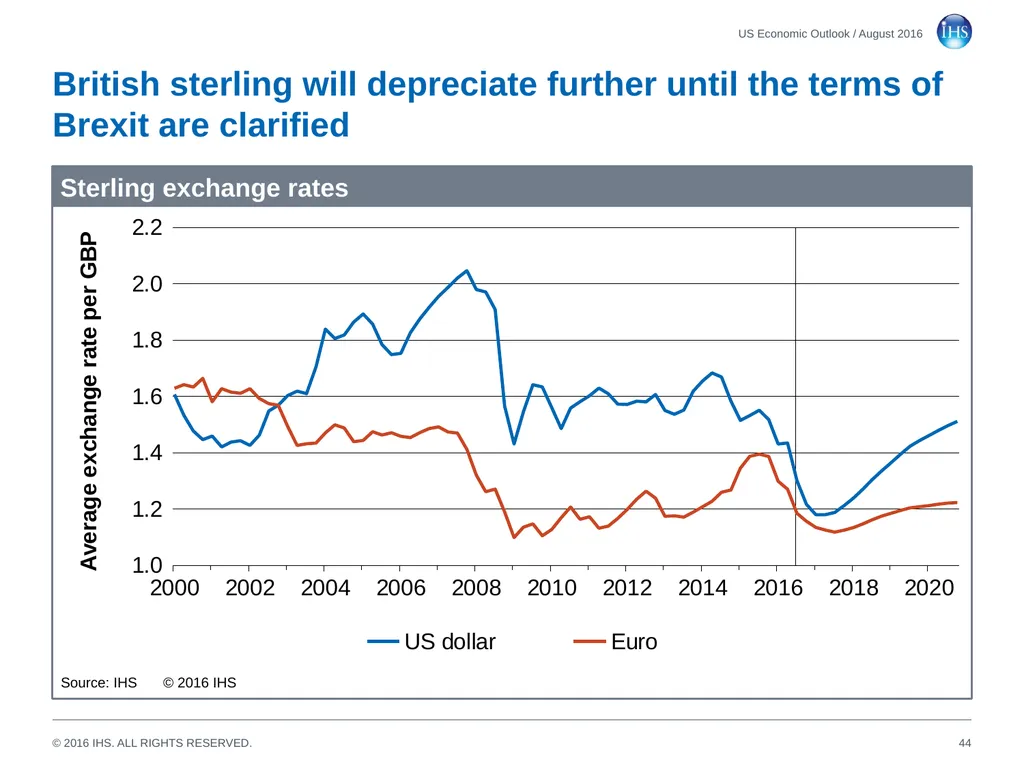
Sterling will likely sink further as Brexit triggers capital flight. 42 US Economic Outlook / August 2016<br>
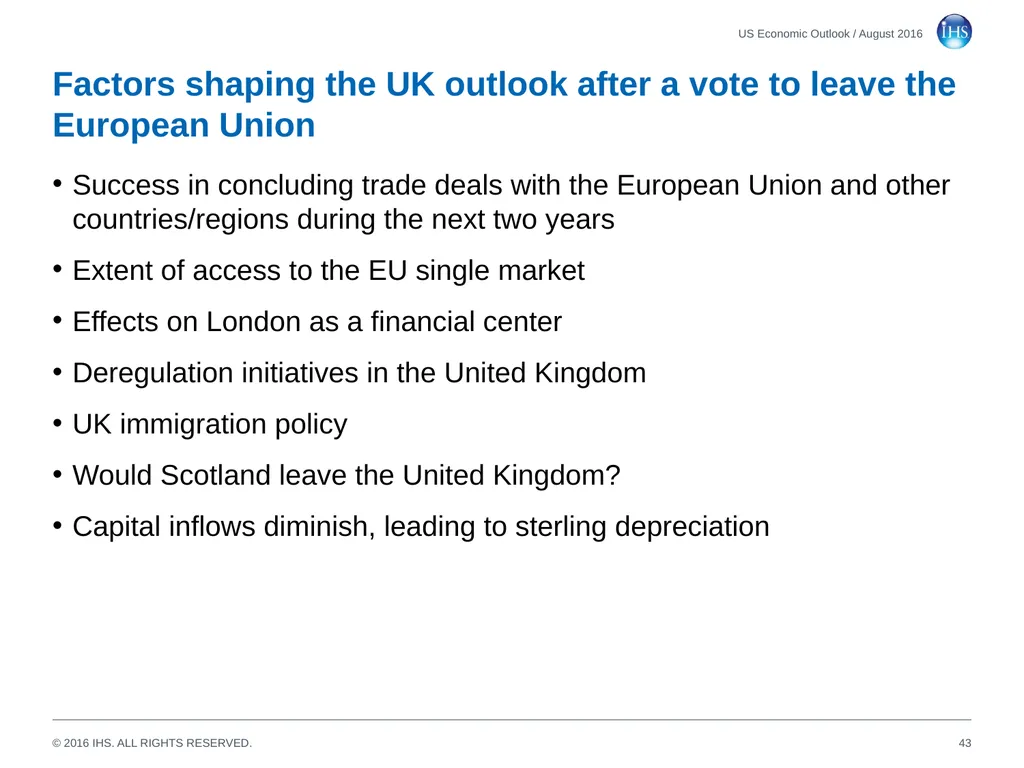
slide43. Factors shaping the UK outlook after a vote to leave the European Union Success in concluding trade deals with the European Union and other countries/regions during the next two years
Extent of access to the EU single market
Effects on London as a financial center
Deregulation initiatives in the United Kingdom
UK immigration policy
Would Scotland leave the United Kingdom?
Capital inflows diminish, leading to sterling depreciation US Economic Outlook / August 2016 43<br>
slide44. British sterling will depreciate further until the terms of Brexit are clarified 44 US Economic Outlook / August 2016 Sterling exchange rates Source: IHS © 2016 IHS<br>
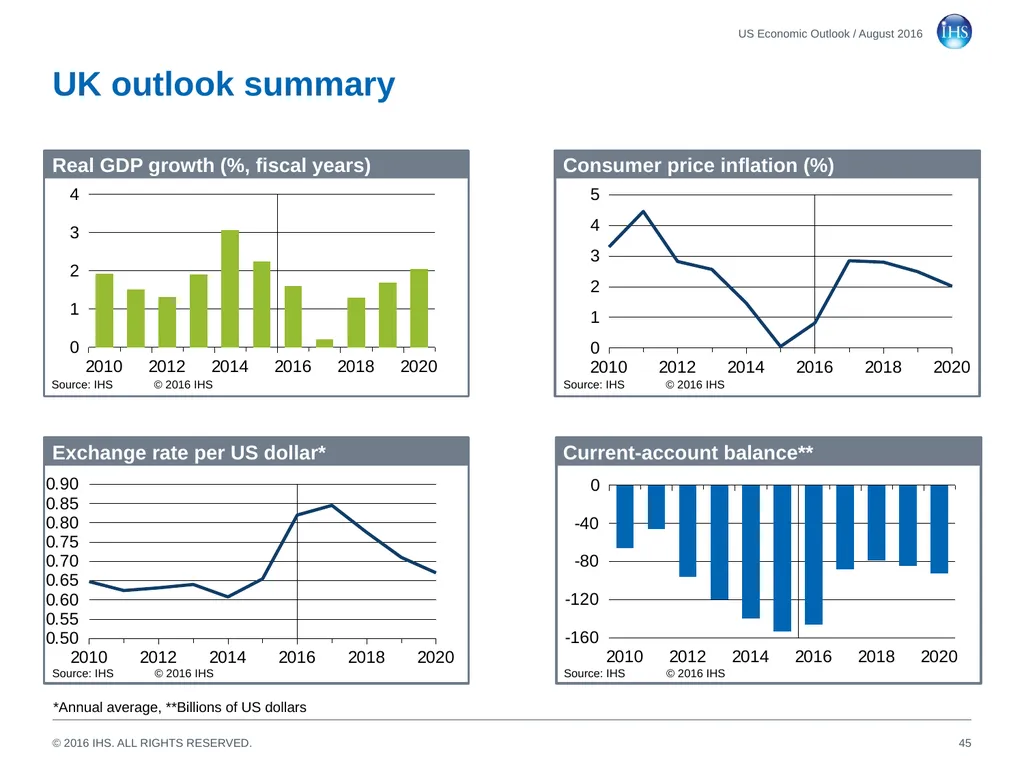
slide45. UK outlook summary 45 US Economic Outlook / August 2016 *Annual average, **Billions of US dollars Real GDP growth (%, fiscal years) Exchange rate per US dollar* Consumer price inflation (%) Current-account balance** Source: IHS © 2016 IHS Source: IHS © 2016 IHS Source: IHS © 2016 IHS Source: IHS © 2016 IHS<br>
slide46. UK economic growth by sector 46 US Economic Outlook / August 2016<br>
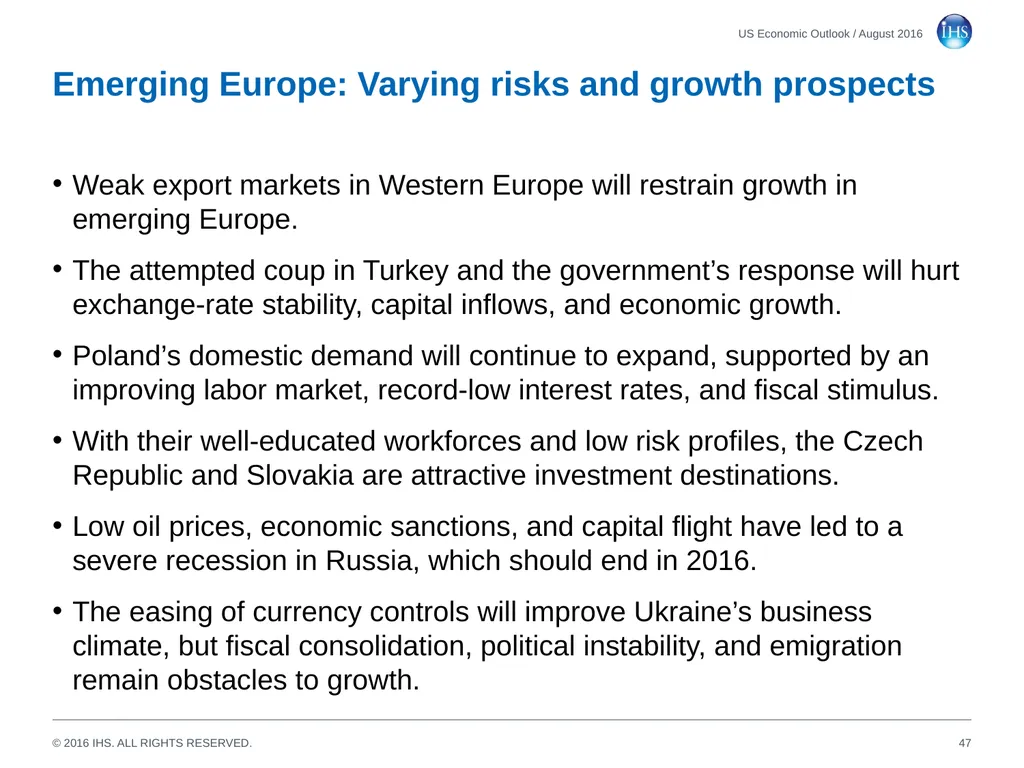
slide47. Emerging Europe: Varying risks and growth prospects Weak export markets in Western Europe will restrain growth in emerging Europe.
The attempted coup in Turkey and the government’s response will hurt exchange-rate stability, capital inflows, and economic growth.
Poland’s domestic demand will continue to expand, supported by an improving labor market, record-low interest rates, and fiscal stimulus.
With their well-educated workforces and low risk profiles, the Czech Republic and Slovakia are attractive investment destinations.
Low oil prices, economic sanctions, and capital flight have led to a severe recession in Russia, which should end in 2016.
The easing of currency controls will improve Ukraine’s business climate, but fiscal consolidation, political instability, and emigration remain obstacles to growth. 47 US Economic Outlook / August 2016<br>
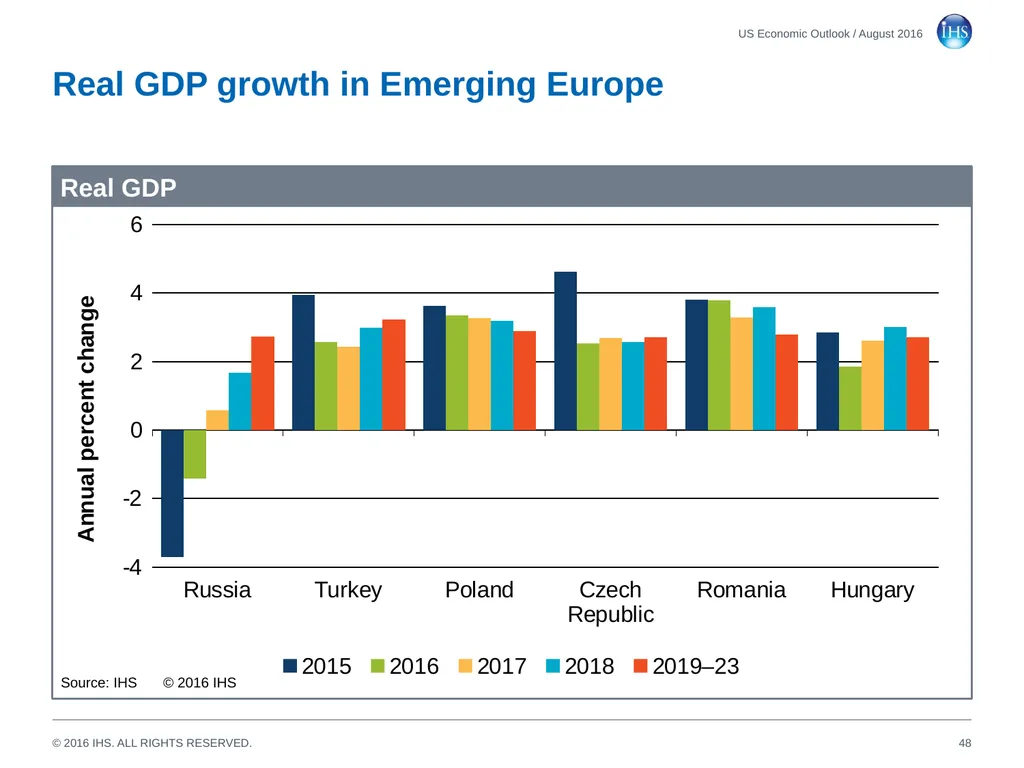
slide48. Real GDP growth in Emerging Europe 48 US Economic Outlook / August 2016 Real GDP Source: IHS © 2016 IHS<br>
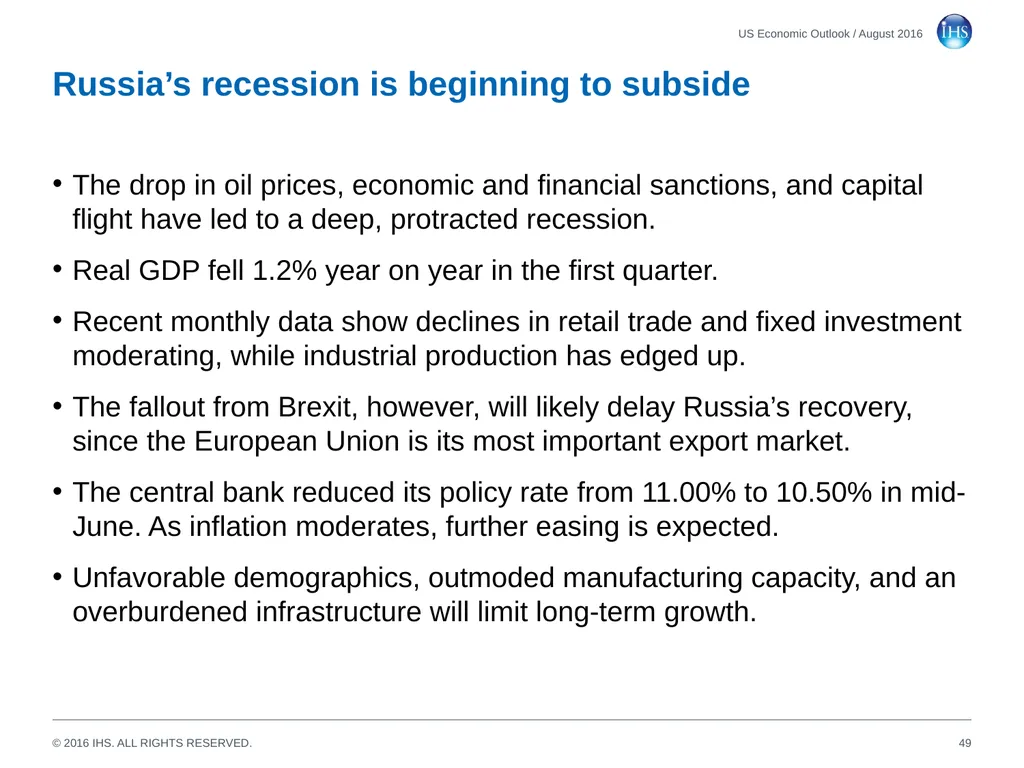
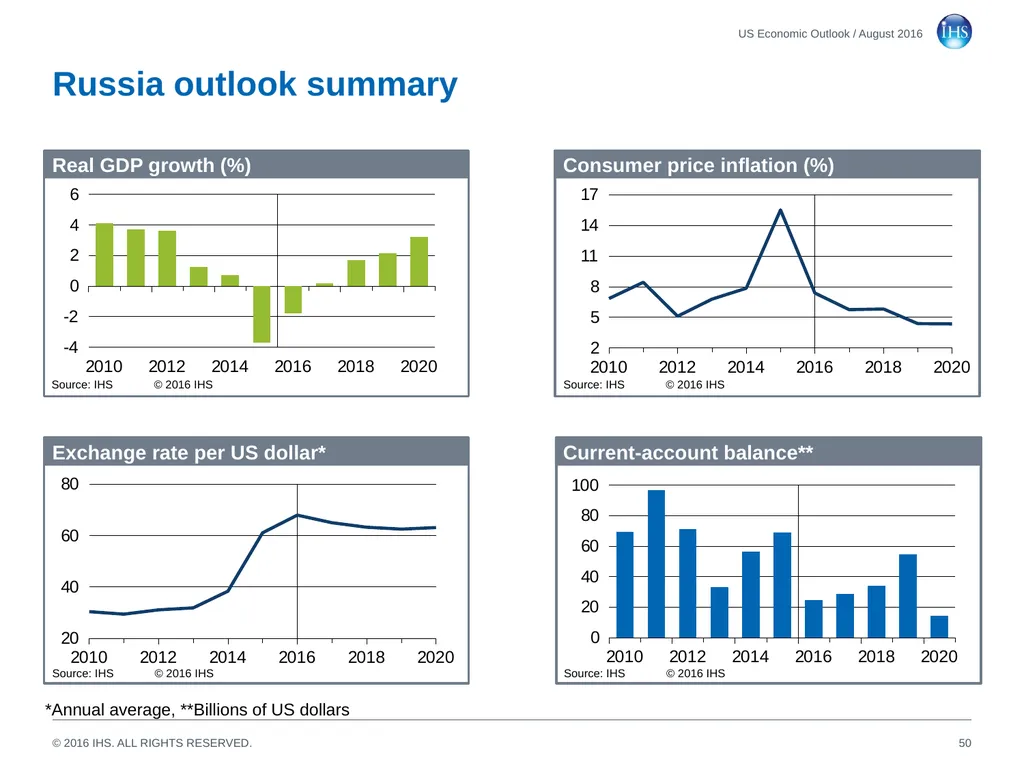
slide49. Russia’s recession is beginning to subside The drop in oil prices, economic and financial sanctions, and capital flight have led to a deep, protracted recession.
Real GDP fell 1.2% year on year in the first quarter.
Recent monthly data show declines in retail trade and fixed investment moderating, while industrial production has edged up.
The fallout from Brexit, however, will likely delay Russia’s recovery, since the European Union is its most important export market.
The central bank reduced its policy rate from 11.00% to 10.50% in mid-June. As inflation moderates, further easing is expected.
Unfavorable demographics, outmoded manufacturing capacity, and an overburdened infrastructure will limit long-term growth. 49 US Economic Outlook / August 2016<br>
slide50. Russia outlook summary 50 US Economic Outlook / August 2016 *Annual average, **Billions of US dollars Real GDP growth (%) Exchange rate per US dollar* Consumer price inflation (%) Current-account balance** Source: IHS © 2016 IHS Source: IHS © 2016 IHS Source: IHS © 2016 IHS Source: IHS © 2016 IHS<br>
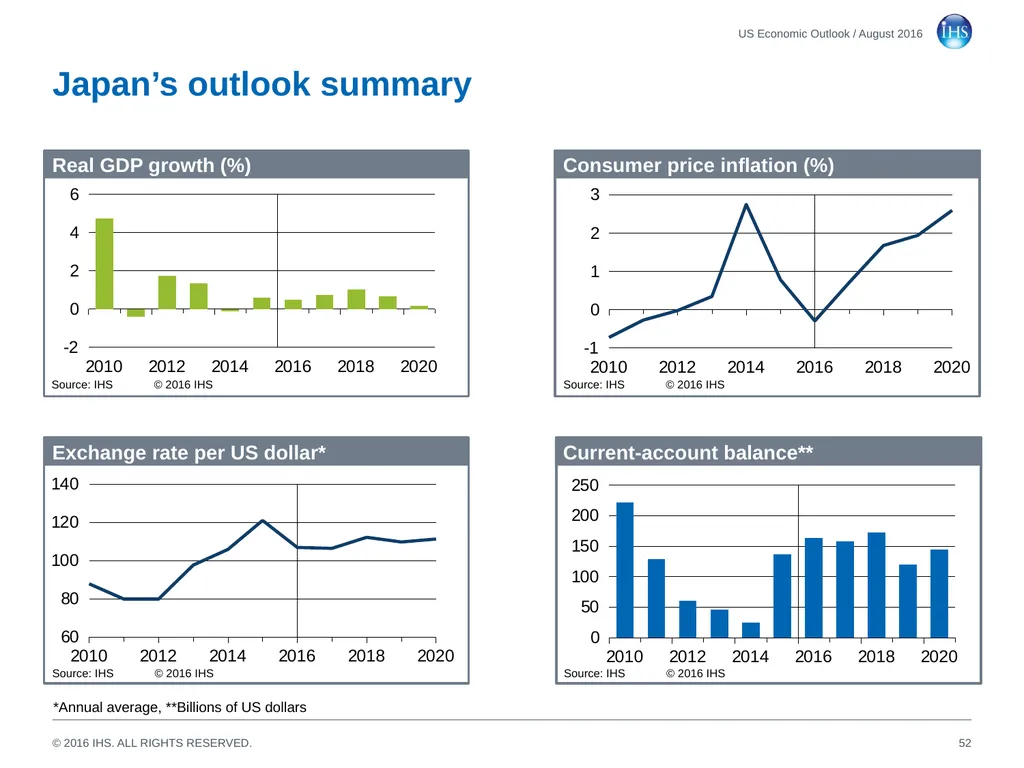
slide51. Japan’s economy travels a slow growth path The yen’s recent appreciation will hurt exports (first price and later volume), corporate earnings, capital spending, and tourism.
The Kumamoto earthquake in April disrupted production and tourism, limiting real GDP growth to a 0.2% annual rate in the second quarter.
A new fiscal stimulus package and monetary policy easing will have modest effects on economic growth.
Labor markets are tight, with the unemployment rate at 3.2%, but weak real wage gains are restraining consumer spending.
A declining, aging population limits growth potential.
High government debt may become a serious challenge. 51 US Economic Outlook / August 2016<br>
slide52. Japan’s outlook summary 52 US Economic Outlook / August 2016 *Annual average, **Billions of US dollars Real GDP growth (%) Exchange rate per US dollar* Consumer price inflation (%) Current-account balance** Source: IHS © 2016 IHS Source: IHS © 2016 IHS Source: IHS © 2016 IHS Source: IHS © 2016 IHS<br>
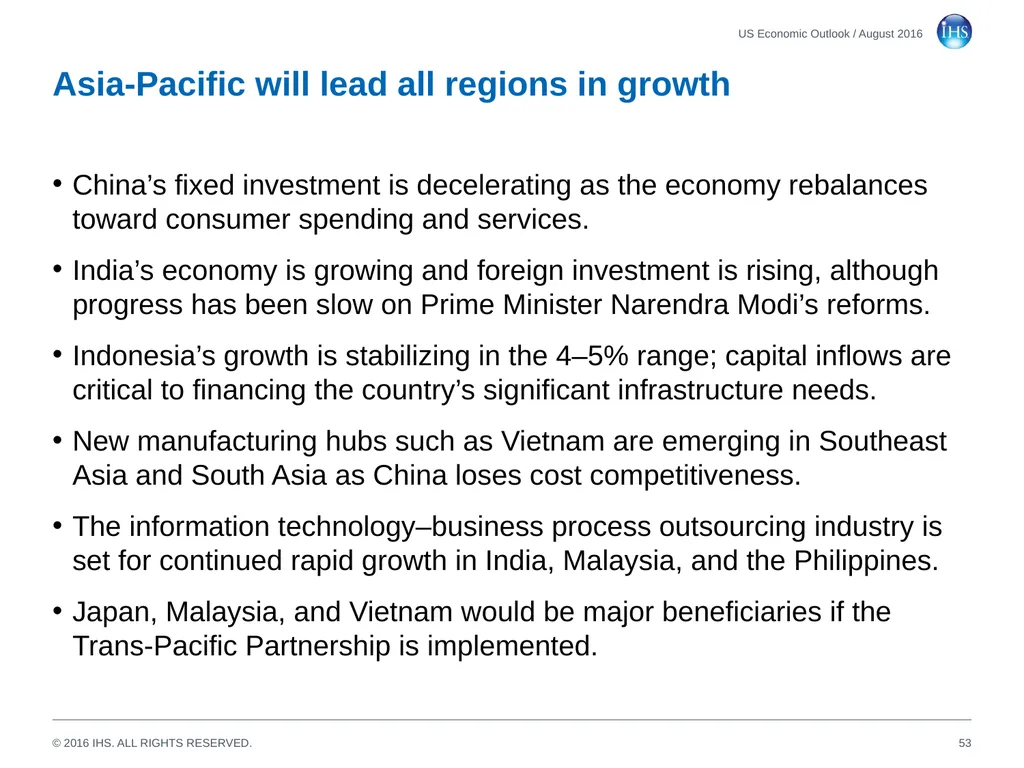
slide53. Asia-Pacific will lead all regions in growth China’s fixed investment is decelerating as the economy rebalances toward consumer spending and services.
India’s economy is growing and foreign investment is rising, although progress has been slow on Prime Minister Narendra Modi’s reforms.
Indonesia’s growth is stabilizing in the 4–5% range; capital inflows are critical to financing the country’s significant infrastructure needs.
New manufacturing hubs such as Vietnam are emerging in Southeast Asia and South Asia as China loses cost competitiveness.
The information technology–business process outsourcing industry is set for continued rapid growth in India, Malaysia, and the Philippines.
Japan, Malaysia, and Vietnam would be major beneficiaries if the Trans-Pacific Partnership is implemented. 53 US Economic Outlook / August 2016<br>
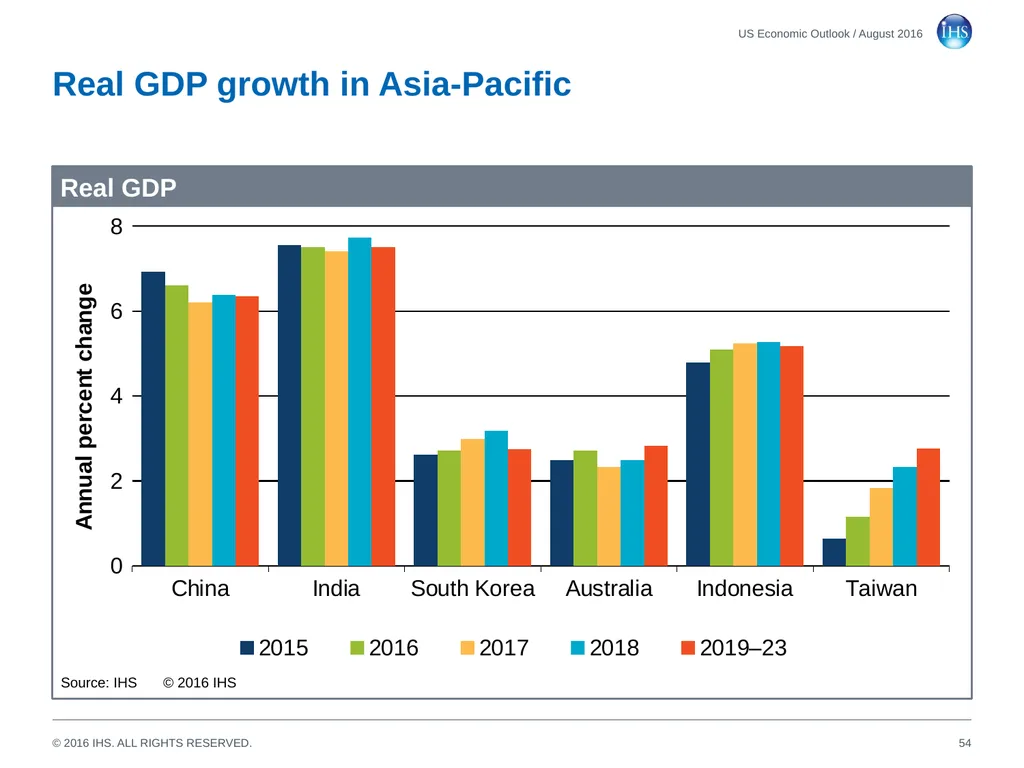
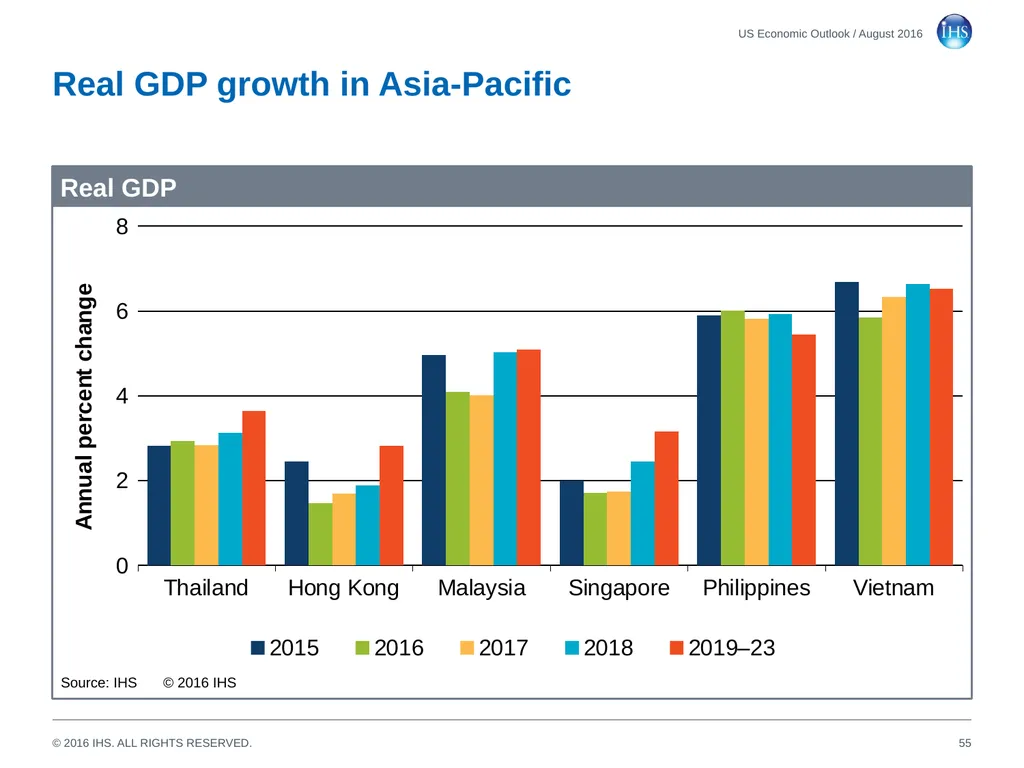
slide54. Real GDP growth in Asia-Pacific 54 US Economic Outlook / August 2016 Real GDP Source: IHS © 2016 IHS<br>
slide55. Real GDP growth in Asia-Pacific 55 US Economic Outlook / August 2016 Real GDP Source: IHS © 2016 IHS<br>
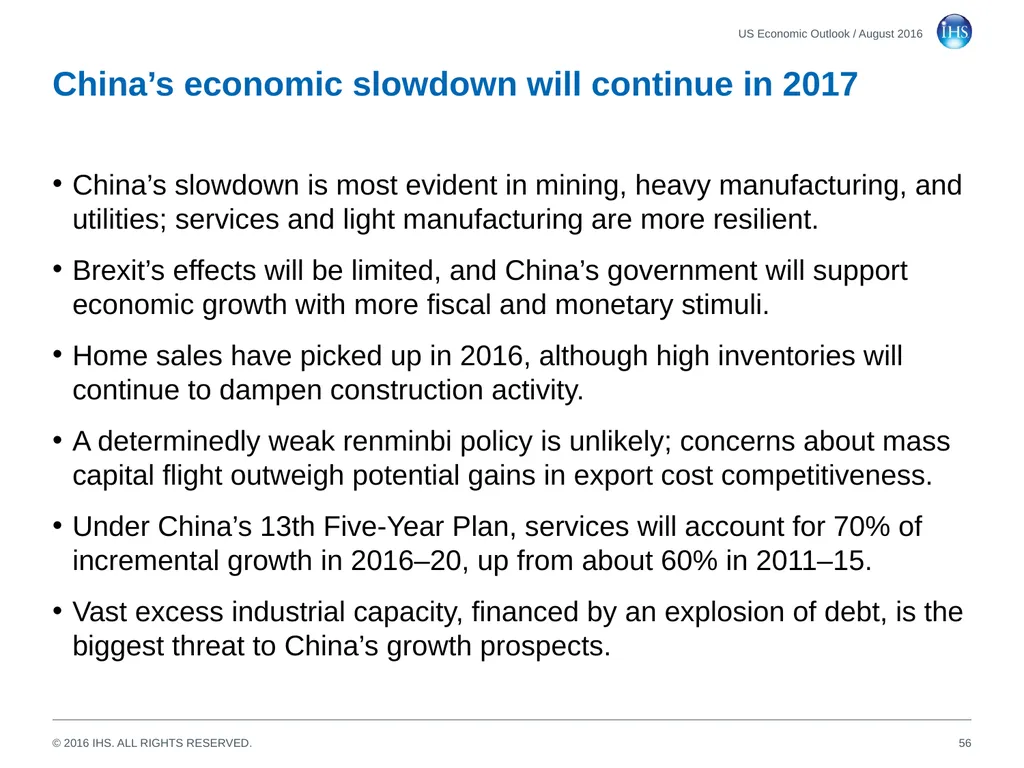
slide56. China’s economic slowdown will continue in 2017 China’s slowdown is most evident in mining, heavy manufacturing, and utilities; services and light manufacturing are more resilient.
Brexit’s effects will be limited, and China’s government will support economic growth with more fiscal and monetary stimuli.
Home sales have picked up in 2016, although high inventories will continue to dampen construction activity.
A determinedly weak renminbi policy is unlikely; concerns about mass capital flight outweigh potential gains in export cost competitiveness.
Under China’s 13th Five-Year Plan, services will account for 70% of incremental growth in 2016–20, up from about 60% in 2011–15.
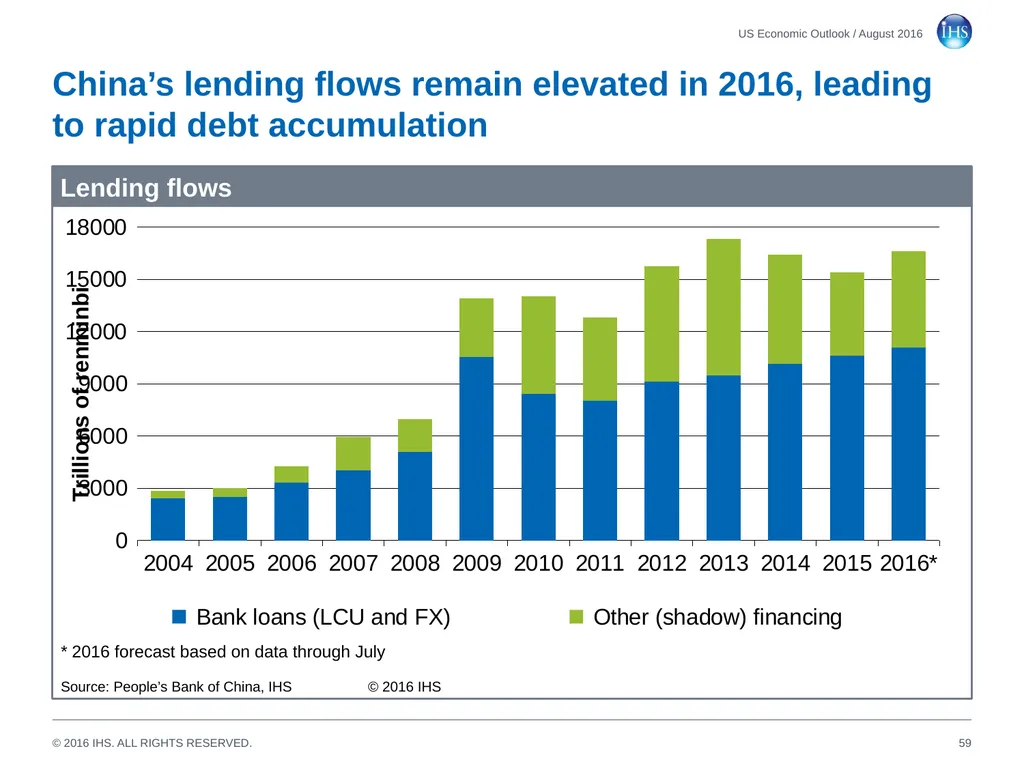
Vast excess industrial capacity, financed by an explosion of debt, is the biggest threat to China’s growth prospects. 56 US Economic Outlook / August 2016<br>
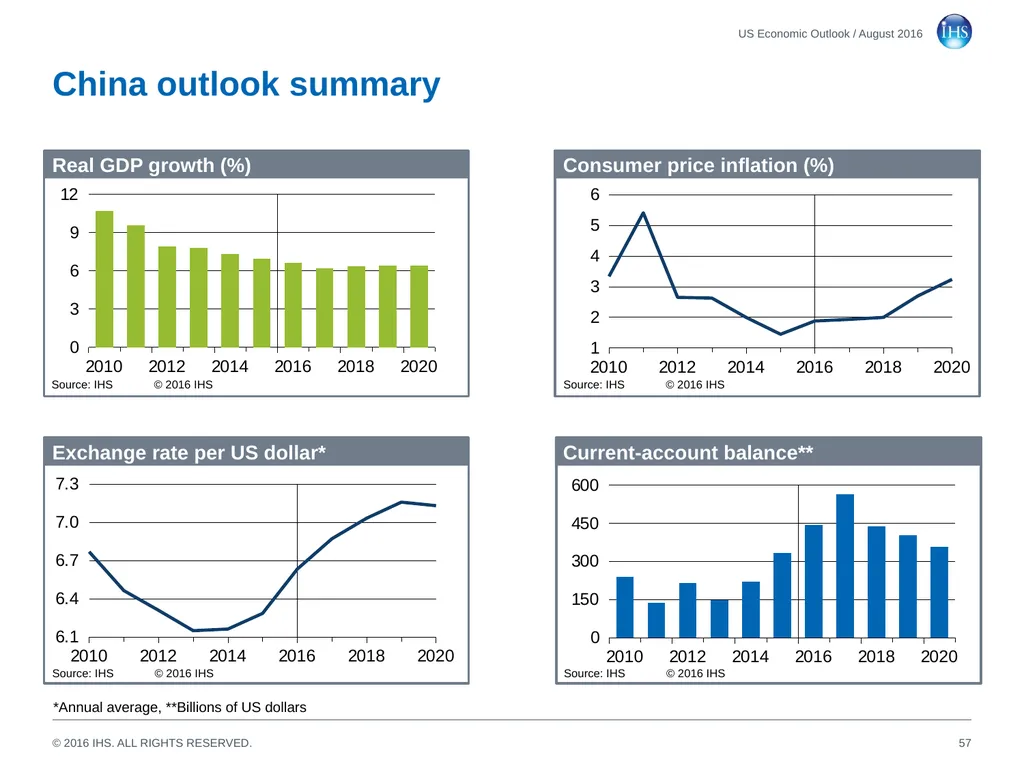
slide57. China outlook summary 57 US Economic Outlook / August 2016 *Annual average, **Billions of US dollars Real GDP growth (%) Exchange rate per US dollar* Consumer price inflation (%) Current-account balance** Source: IHS © 2016 IHS Source: IHS © 2016 IHS Source: IHS © 2016 IHS Source: IHS © 2016 IHS<br>
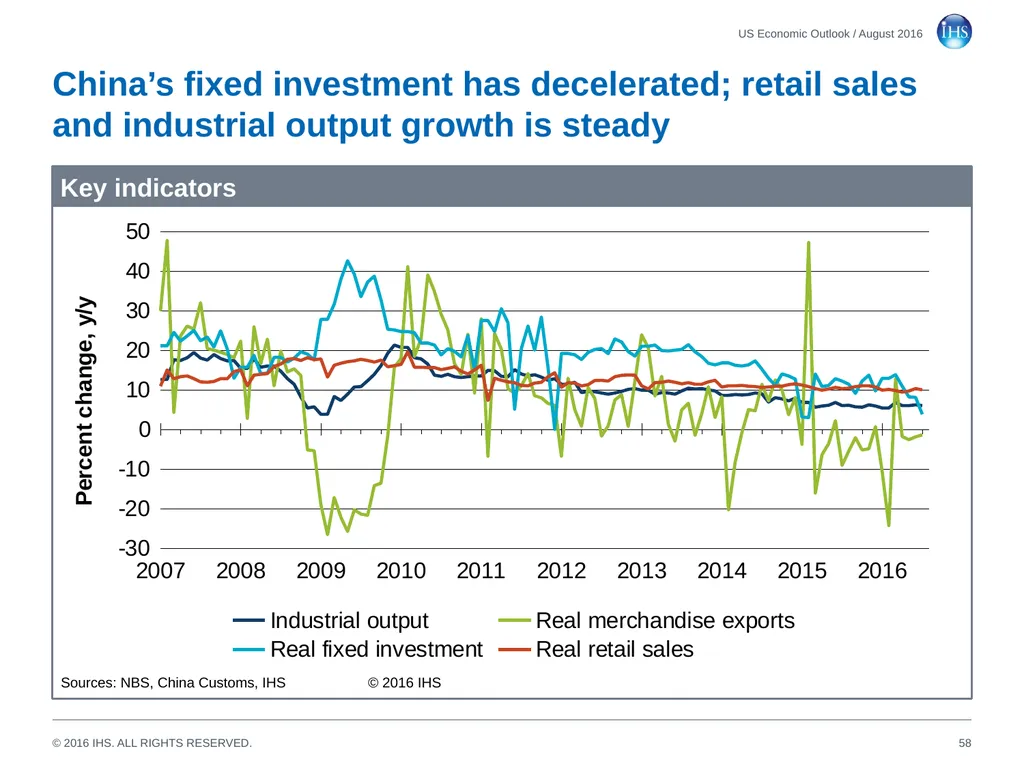
slide58. China’s fixed investment has decelerated; retail sales and industrial output growth is steady 58 US Economic Outlook / August 2016 Key indicators Sources: NBS, China Customs, IHS © 2016 IHS<br>
slide59. China’s lending flows remain elevated in 2016, leading to rapid debt accumulation 59 US Economic Outlook / August 2016 Lending flows * 2016 forecast based on data through July
Source: People’s Bank of China, IHS © 2016 IHS<br>
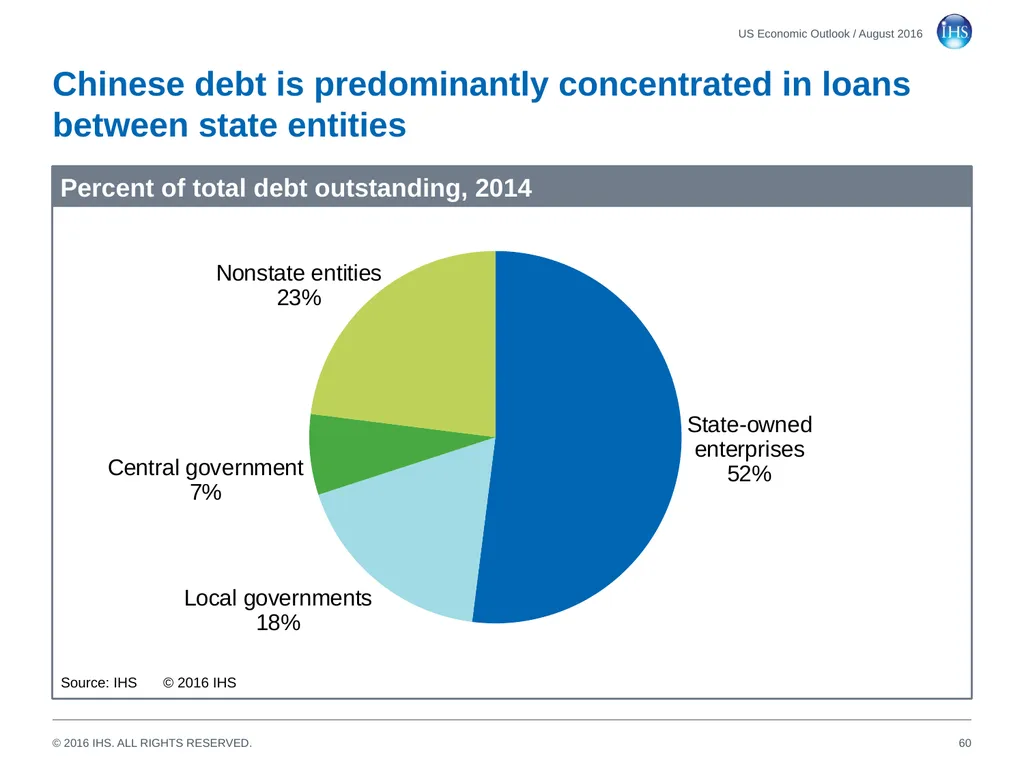
slide60. Chinese debt is predominantly concentrated in loans between state entities 60 US Economic Outlook / August 2016 Percent of total debt outstanding, 2014 Source: IHS © 2016 IHS<br>
slide61. China’s economic growth by sector 61 US Economic Outlook / August 2016<br>
slide62. China’s economic growth will downshift in the long run 62 US Economic Outlook / August 2016 Real GDP and industrial production Source: IHS © 2016 IHS<br>
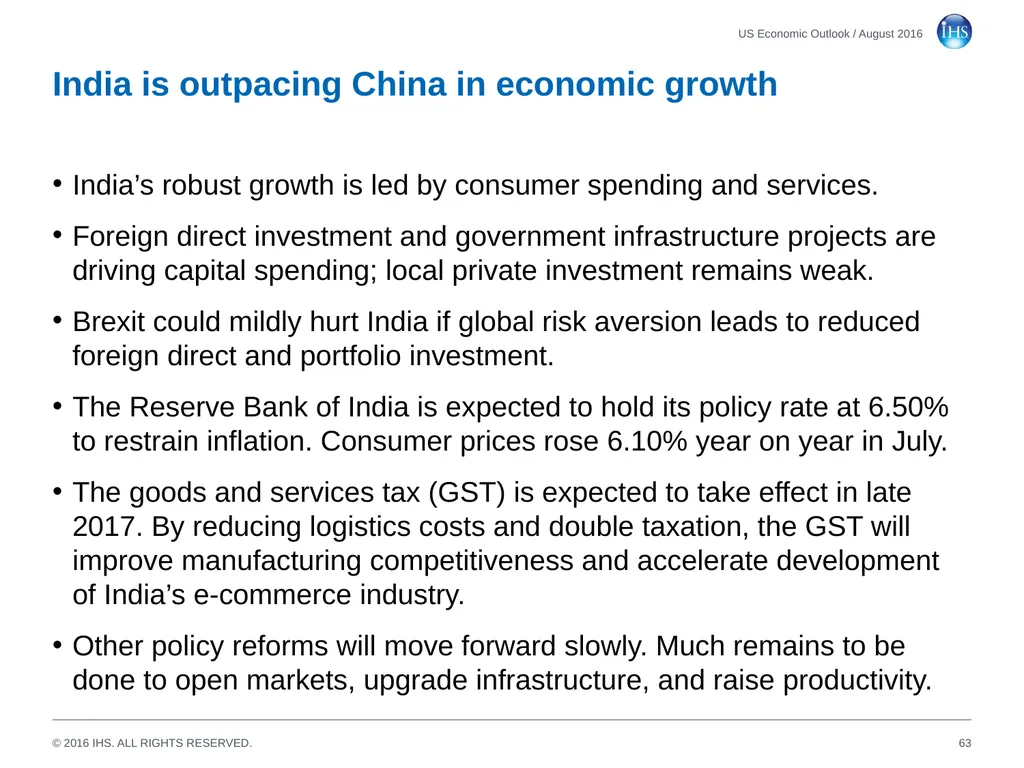
slide63. India is outpacing China in economic growth India’s robust growth is led by consumer spending and services.
Foreign direct investment and government infrastructure projects are driving capital spending; local private investment remains weak.
Brexit could mildly hurt India if global risk aversion leads to reduced foreign direct and portfolio investment.
The Reserve Bank of India is expected to hold its policy rate at 6.50% to restrain inflation. Consumer prices rose 6.10% year on year in July.
The goods and services tax (GST) is expected to take effect in late 2017. By reducing logistics costs and double taxation, the GST will improve manufacturing competitiveness and accelerate development of India’s e-commerce industry.
Other policy reforms will move forward slowly. Much remains to be done to open markets, upgrade infrastructure, and raise productivity. 63 US Economic Outlook / August 2016<br>
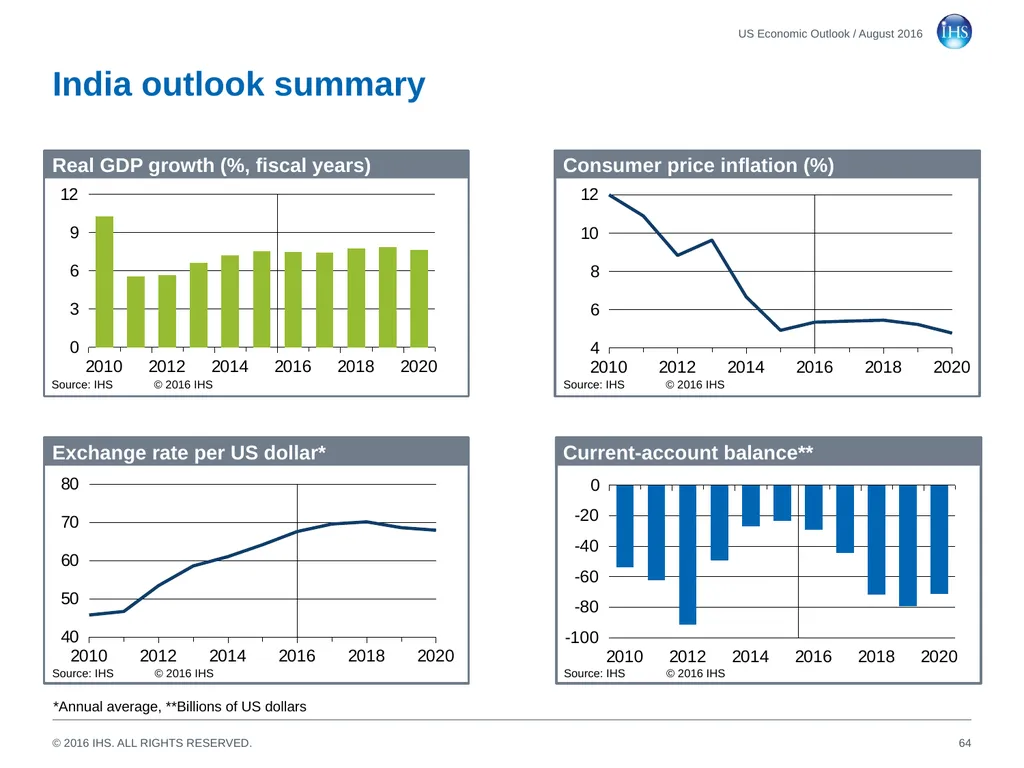
slide64. India outlook summary 64 US Economic Outlook / August 2016 *Annual average, **Billions of US dollars Real GDP growth (%, fiscal years) Exchange rate per US dollar* Consumer price inflation (%) Current-account balance** Source: IHS © 2016 IHS Source: IHS © 2016 IHS Source: IHS © 2016 IHS Source: IHS © 2016 IHS<br>
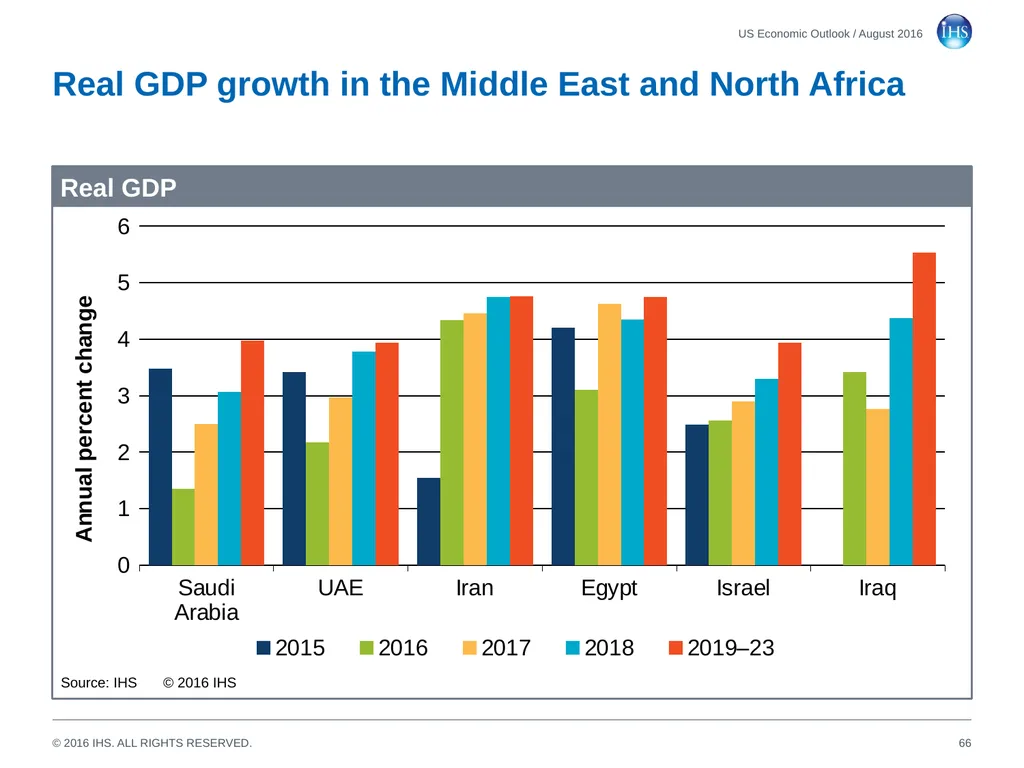
slide65. The Middle East and North Africa The drop in oil prices, regional political instability, and war with the Islamic State are restraining economic growth.
The region shifted from current-account surpluses to deficits in 2015; a return to surplus is expected in 2017 as oil prices recover.
Lower oil prices are hurting Iran, Kuwait, Iraq, Saudi Arabia, the UAE, and Libya, but are helping Jordan, Lebanon, Morocco, and Tunisia.
Whereas Saudi Arabia, Kuwait, and the UAE have substantial reserves, the finances of Iran, Libya, and Algeria are strained.
The end of sanctions is raising Iran’s oil exports and economic growth.
Egypt’s economy is expanding, but political and security risks remain.
Addressing job growth, economic diversification, and competitiveness will be critical to regional stability in the long run. 65 US Economic Outlook / August 2016<br>
slide66. Real GDP growth in the Middle East and North Africa 66 US Economic Outlook / August 2016 Real GDP Source: IHS © 2016 IHS<br>
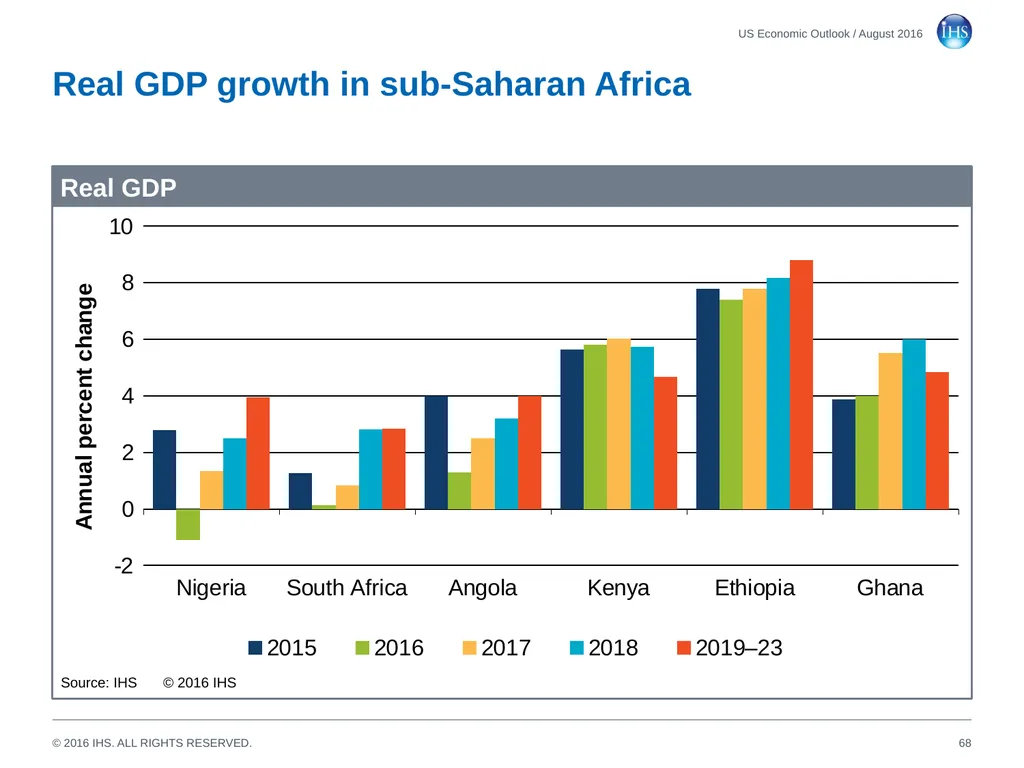
slide67. Sub-Saharan Africa depends on commodity exports Weak commodity prices and the slowdown in China are hurting export revenues, foreign investment, and economic growth.
South Africa will struggle with large fiscal and current-account deficits and a challenging business environment.
In Nigeria, terrorism by Boko Haram and attacks on oil facilities could threaten foreign direct investment and the economy. The naira has plummeted following the end of peg to the US dollar.
Poor infrastructure (especially power generation), political instability, and corruption remain obstacles to economic development.
In the long run, expanding domestic markets, growing middle-class populations, and regional integration will support economic growth.
Several countries have strong growth prospects, including Kenya, Mozambique, Ethiopia, Liberia, Uganda, Ghana, and Tanzania. 67 US Economic Outlook / August 2016<br>
slide68. Real GDP growth in sub-Saharan Africa 68 US Economic Outlook / August 2016 Real GDP Source: IHS © 2016 IHS<br>
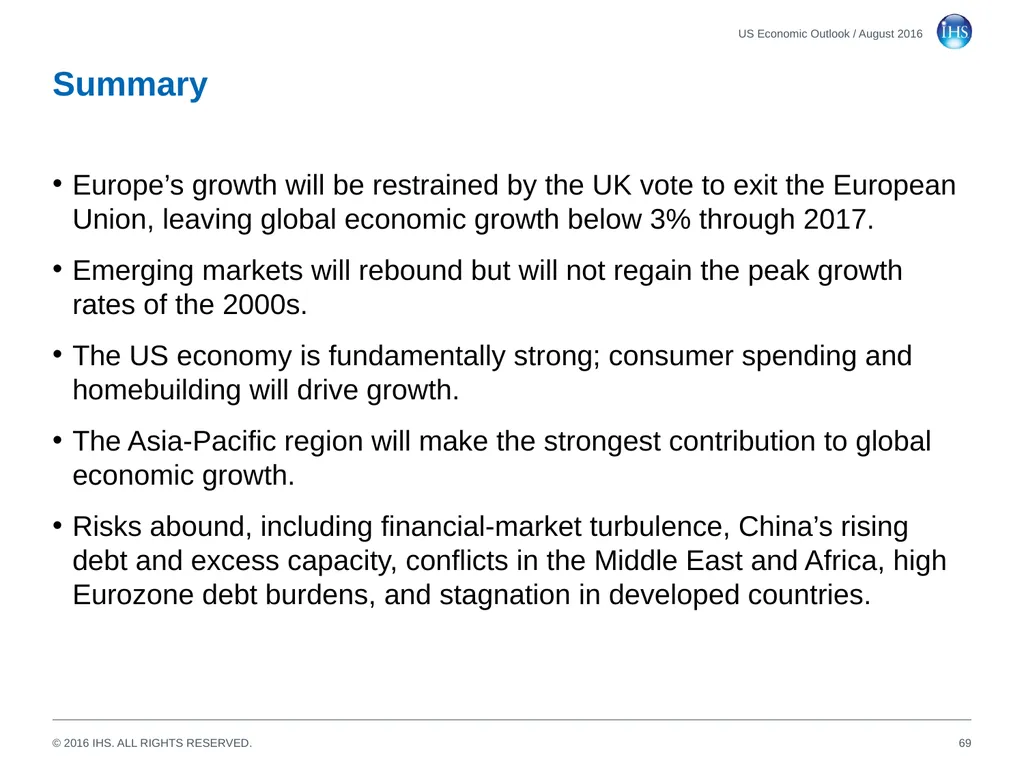
slide69. Summary Europe’s growth will be restrained by the UK vote to exit the European Union, leaving global economic growth below 3% through 2017.
Emerging markets will rebound but will not regain the peak growth rates of the 2000s.
The US economy is fundamentally strong; consumer spending and homebuilding will drive growth.
The Asia-Pacific region will make the strongest contribution to global economic growth.
Risks abound, including financial-market turbulence, China’s rising debt and excess capacity, conflicts in the Middle East and Africa, high Eurozone debt burdens, and stagnation in developed countries. 69 US Economic Outlook / August 2016<br>
slide70. Economics<br>
+1 781 301 9115, sara.johnson@ihsmarkit.com Economics<br>
slide2. Global economic growth remains subdued Global growth will remain below 3% in 2017 as slowdowns in Europe and China offset accelerations in the United States and emerging markets.
US economic growth will pick up from 1.6% in 2016 to 2.4% in 2017, led by consumer spending and homebuilding.
Economic and political uncertainty will hurt UK investment, consumer spending, and capital inflows, stalling UK growth in the year ahead.
Eurozone growth is projected to slow from 1.5% in 2016 to 1.1% in 2017, reflecting increased political instability and banking problems.
China’s economic growth will slow further because of imbalances in credit, housing, and industrial markets.
Recessions in Brazil and Russia are abating. 2 US Economic Outlook / August 2016<br>
slide3. (Index, over 50 indicates expansion) Markit manufacturing PMIs send mixed signals 3 US Economic Outlook / August 2016 Purchasing managers’ indexes Sources: Markit © 2016 IHS<br>
slide4. Emerging markets will lead a pickup in global growth 4 US Economic Outlook / August 2016 Real GDP Source: IHS © 2016 IHS<br>
slide5. Asia-Pacific (excluding Japan) will achieve the fastest growth in real GDP 5 US Economic Outlook / August 2016 Real GDP Source: IHS © 2016 IHS<br>
slide6. Real GDP growth in major economies: August forecast 6 US Economic Outlook / August 2016 Source: IHS © 2016 IHS<br>
slide7. The United States will outpace the Eurozone and Japan in real GDP growth 7 US Economic Outlook / August 2016 Real GDP Source: IHS © 2016 IHS<br>
slide8. Real GDP growth in key emerging markets: Recessions in Russia and Brazil are abating 8 US Economic Outlook / August 2016 Real GDP Source: IHS © 2016 IHS<br>
slide9. The era of rapid growth in world trade has ended 9 US Economic Outlook / August 2016 Real GDP and trade Source: IHS © 2016 IHS<br>
slide10. Why has growth in world trade slowed? 10 US Economic Outlook / August 2016<br>
slide11. European and Japanese central banks will keep policy interest rates low for several more years 11 US Economic Outlook / August 2016 Policy interest rates Source: IHS © 2016 IHS<br>
slide12. Policy interest rates in key emerging markets respond to inflation and exchange-rate pressures 12 US Economic Outlook / August 2016 Policy interest rates * One-year loan rate
Source: IHS © 2016 IHS<br>
slide13. Industrial materials prices have rebounded since mid-January but remain low IHS Materials Price Index Source: IHS © 2016 IHS US Economic Outlook / August 2016 13<br>
slide14. The global crude-oil market returns to balance High product stocks will restrain prices in the near term.
After significant surpluses in 2015 and the first half of 2016, the global liquids market will return to balance in late 2016 and in 2017.
A continuing decline in US oil production into 2017 will be key to supporting oil prices.
The United States, China, and India drive global oil demand growth.
Reduced economic growth in the United Kingdom and European Union will lead to some modest reduction in oil demand, but the low oil intensity of European countries mitigates the downside risk.
The price of Dated Brent is projected to average USD44 per barrel in 2016, USD57 in 2017, and USD64 in 2018. 14 US Economic Outlook / August 2016<br>
slide15. Crude-oil prices will gradually recover 15 US Economic Outlook / August 2016 Price of Dated Brent crude oil Source: IHS © 2016 IHS<br>
slide16. Consumer price inflation varies widely 16 US Economic Outlook / August 2016 Consumer price inflation Source: IHS © 2016 IHS<br>
slide17. The drop in oil prices has erased the Middle East’s current-account surplus 17 US Economic Outlook / August 2016 Current-account balances Source: IHS © 2016 IHS<br>
slide18. A widening US trade deficit will contribute to a retreat in the dollar’s real exchange value in 2017‒20 18 US Economic Outlook / August 2016 Real trade-weighted dollar index Source: IHS © 2016 IHS<br>
slide19. Exchange rates per US dollar 19 US Economic Outlook / August 2016 Quarterly averages Canadian dollar Japanese yen Euro Chinese renminbi Source: IHS © 2016 IHS Source: IHS © 2016 IHS Source: IHS © 2016 IHS Source: IHS © 2016 IHS<br>
slide20. The euro will depreciate further against the US dollar before recovering 20 US Economic Outlook / August 2016 Euro exchange rate Source: IHS © 2016 IHS<br>
slide21. After a disappointing first half, US economic growth is picking up in the second half of 2016 Real GDP increased at a slow 1.2% annual rate in the second quarter, as 2.4% growth in final sales was offset by an inventory correction.
Prolonged weakness in business fixed investment and labor productivity growth is holding back US economic progress.
Real GDP is projected to increase 1.6% in 2016 (revised down from 1.9%) and 2.4% in 2017 and 2018 (unchanged).
Consumer spending will drive the expansion, supported by growth in employment, real incomes, and household net worth.
Housing construction will continue to recover in response to pent-up demand from young adults and improved credit availability.
The Federal Reserve will be cautious in raising interest rates; the next increase is expected in December but could come in September. 21 US Economic Outlook / August 2016<br>
slide22. Real GDP growth will pick up, but job growth will slow 22 US Economic Outlook / August 2016 Real GDP and payroll employment Source: IHS © 2016 IHS<br>
slide23. US economic growth by sector 23 US Economic Outlook / August 2016<br>
slide24. Canada’s energy sector is holding back growth Wildfires near Alberta’s oil sands fields temporarily disrupted production in the second quarter, causing a setback to real GDP.
Fiscal stimulus will support near-term growth, but declining investment in resource industries will restrain it.
The Bank of Canada should keep its policy rate at 0.50% through the summer of 2017 to support economic growth.
The Canadian dollar and oil prices will gradually recover in 2017–20.
Regional performances have diverged, with weakness in Alberta, Saskatchewan, and Newfoundland, but strength in British Columbia, Ontario, and Manitoba.
Housing prices and construction are surging in Vancouver and Toronto, but declining in Calgary. 24 US Economic Outlook / August 2016<br>
slide25. Canada’s real GDP and industrial production growth 25 US Economic Outlook / August 2016 Real GDP and industrial production Source: IHS © 2016 IHS<br>
slide26. Canada outlook summary 26 US Economic Outlook / August 2016 *Annual average, **Billions of US dollars Real GDP growth (%) Exchange rate per US dollar* Consumer price inflation (%) Current-account balance** Source: IHS © 2016 IHS Source: IHS © 2016 IHS Source: IHS © 2016 IHS Source: IHS © 2016 IHS<br>
slide27. Canada’s economic growth by sector 27 US Economic Outlook / August 2016<br>
slide28. Mexico’s economic outlook Mexico is linked to the US economy through trade, capital inflows, and remittances.
Global automotive and petrochemical companies continue to invest in new capacity in Mexico.
The opening of Mexico’s energy industry to private investment will eventually reverse the decline in oil production.
The drop in oil revenues has led to deep cuts in public investment.
The Bank of Mexico will raise interest rates in step with the US Federal Reserve to prevent capital outflows and peso depreciation.
Security risks and corruption scandals are taking a toll on business sentiment, investment, and economic growth. 28 US Economic Outlook / August 2016<br>
slide29. Mexico outlook summary 29 US Economic Outlook / August 2016 *Annual average, **Billions of US dollars Real GDP growth (%) Exchange rate per US dollar* Consumer price inflation (%) Current-account balance** Source: IHS © 2016 IHS Source: IHS © 2016 IHS Source: IHS © 2016 IHS Source: IHS © 2016 IHS<br>
slide30. Economic performance varies across South America Brazil’s economy shows signs of stabilizing at a depressed level. Markets have welcomed the leadership changes.
Chile, Peru, and Colombia will benefit from sound fiscal and monetary policies, trade alliances, and a rise in commodity export revenues.
Argentina’s government has lifted currency controls, cut taxes, and successfully returned to the international bond market. Reducing inflation and fiscal deficits will be a more difficult challenges.
Venezuela’s oil-dependent economy is in chaos, with huge deficits, hyperinflation, currency devaluation, and collapsing investment.
The region’s long-term challenges include inadequate infrastructure, restrictive business environments, and income inequality. 30 US Economic Outlook / August 2016<br>
slide31. Real GDP growth in South America 31 US Economic Outlook / August 2016 Real GDP Source: IHS © 2016 IHS<br>
slide32. Brazil’s recession is abating; recovery is not in sight Brazil’s industrial production appears to be stabilizing at a depressed level, but a rebound is unlikely in the near term.
The new government will face resistance to needed fiscal austerity.
Low oil prices and corruption investigations are taking a heavy toll on Petrobras and the energy, construction, and financial sectors.
To fight inflation, the central bank is holding its Selic rate at 14.25%.
Consumer price inflation, while still high, is beginning to ease in response to weak demand and a recovery in the exchange rate.
High and complex taxation, local-content regulations, administered prices, and infrastructure bottlenecks undermine competitiveness. 32 US Economic Outlook / August 2016<br>
slide33. Brazil outlook summary 33 US Economic Outlook / August 2016 *Annual average, **Billions of US dollars Real GDP growth (%) Exchange rate per US dollar* Consumer price inflation (%) Current-account balance** Source: IHS © 2016 IHS Source: IHS © 2016 IHS Source: IHS © 2016 IHS Source: IHS © 2016 IHS<br>
slide34. Brazil’s economic growth by sector 34 US Economic Outlook / August 2016<br>
slide35. Eurozone sentiment indexes are relatively stable 35 US Economic Outlook / August 2016 Positive replies minus negative replies Source: European Commission © 2016 IHS<br>
slide36. Western Europe stays on a slow growth path Eurozone growth slowed in the second quarter, with a loss of momentum in consumer spending and business investment.
Increased uncertainty will discourage capital spending, although some investment will be diverted from the United Kingdom to EU countries.
Aggressive monetary stimulus, a weaker euro, and reduced fiscal headwinds will help sustain growth.
With inflation picking up only gradually, the European Central Bank (ECB) is not expected to raise interest rates until 2019.
The euro is projected to bottom out near USD1.04 in late 2016/early 2017 and then gradually recover to USD1.24 by the end of 2020.
Ireland, Spain, and Sweden will maintain relatively healthy economic growth, but the United Kingdom, Italy, and France will struggle. 36 US Economic Outlook / August 2016<br>
slide37. Real GDP growth in Western Europe 37 US Economic Outlook / August 2016 Real GDP Source: IHS © 2016 IHS<br>
slide38. Real GDP growth in Western Europe 38 US Economic Outlook / August 2016 Real GDP Source: IHS © 2016 IHS<br>
slide39. Ten-year Eurozone government bond yields remain low 39 US Economic Outlook / August 2016 10-year government bond yields Source: IHS © 2016 IHS<br>
slide40. Despite a pickup, consumer price inflation will stay subdued across Western Europe 40 US Economic Outlook / August 2016 Consumer price index Source: IHS © 2016 IHS<br>
slide41. With inflation below target, the European Central Bank will keep its policy rate near zero until 2019 41 US Economic Outlook / August 2016 Consumer price inflation and policy interest rate Source: IHS © 2016 IHS<br>
slide42. The United Kingdom’s outlook is clouded by the vote to exit the European Union Real GDP growth picked up to 0.6% in the spring quarter, as strength in consumer spending was offset by weakness in business investment.
Our forecast assumes the United Kingdom invokes Article 50 in early 2017, initiating two years of negotiations on future UK-EU relations.
Uncertainty about the terms of Brexit is a major restraint on growth, leading to cutbacks in foreign and domestic investment.
A mild recession is expected in late 2016 and early 2017.
In early August, the Bank of England cut its policy rate from 0.50% to 0.25% and restarted quantitative easing. Fiscal policies remain tight.
Sterling will likely sink further as Brexit triggers capital flight. 42 US Economic Outlook / August 2016<br>
slide43. Factors shaping the UK outlook after a vote to leave the European Union Success in concluding trade deals with the European Union and other countries/regions during the next two years
Extent of access to the EU single market
Effects on London as a financial center
Deregulation initiatives in the United Kingdom
UK immigration policy
Would Scotland leave the United Kingdom?
Capital inflows diminish, leading to sterling depreciation US Economic Outlook / August 2016 43<br>
slide44. British sterling will depreciate further until the terms of Brexit are clarified 44 US Economic Outlook / August 2016 Sterling exchange rates Source: IHS © 2016 IHS<br>
slide45. UK outlook summary 45 US Economic Outlook / August 2016 *Annual average, **Billions of US dollars Real GDP growth (%, fiscal years) Exchange rate per US dollar* Consumer price inflation (%) Current-account balance** Source: IHS © 2016 IHS Source: IHS © 2016 IHS Source: IHS © 2016 IHS Source: IHS © 2016 IHS<br>
slide46. UK economic growth by sector 46 US Economic Outlook / August 2016<br>
slide47. Emerging Europe: Varying risks and growth prospects Weak export markets in Western Europe will restrain growth in emerging Europe.
The attempted coup in Turkey and the government’s response will hurt exchange-rate stability, capital inflows, and economic growth.
Poland’s domestic demand will continue to expand, supported by an improving labor market, record-low interest rates, and fiscal stimulus.
With their well-educated workforces and low risk profiles, the Czech Republic and Slovakia are attractive investment destinations.
Low oil prices, economic sanctions, and capital flight have led to a severe recession in Russia, which should end in 2016.
The easing of currency controls will improve Ukraine’s business climate, but fiscal consolidation, political instability, and emigration remain obstacles to growth. 47 US Economic Outlook / August 2016<br>
slide48. Real GDP growth in Emerging Europe 48 US Economic Outlook / August 2016 Real GDP Source: IHS © 2016 IHS<br>
slide49. Russia’s recession is beginning to subside The drop in oil prices, economic and financial sanctions, and capital flight have led to a deep, protracted recession.
Real GDP fell 1.2% year on year in the first quarter.
Recent monthly data show declines in retail trade and fixed investment moderating, while industrial production has edged up.
The fallout from Brexit, however, will likely delay Russia’s recovery, since the European Union is its most important export market.
The central bank reduced its policy rate from 11.00% to 10.50% in mid-June. As inflation moderates, further easing is expected.
Unfavorable demographics, outmoded manufacturing capacity, and an overburdened infrastructure will limit long-term growth. 49 US Economic Outlook / August 2016<br>
slide50. Russia outlook summary 50 US Economic Outlook / August 2016 *Annual average, **Billions of US dollars Real GDP growth (%) Exchange rate per US dollar* Consumer price inflation (%) Current-account balance** Source: IHS © 2016 IHS Source: IHS © 2016 IHS Source: IHS © 2016 IHS Source: IHS © 2016 IHS<br>
slide51. Japan’s economy travels a slow growth path The yen’s recent appreciation will hurt exports (first price and later volume), corporate earnings, capital spending, and tourism.
The Kumamoto earthquake in April disrupted production and tourism, limiting real GDP growth to a 0.2% annual rate in the second quarter.
A new fiscal stimulus package and monetary policy easing will have modest effects on economic growth.
Labor markets are tight, with the unemployment rate at 3.2%, but weak real wage gains are restraining consumer spending.
A declining, aging population limits growth potential.
High government debt may become a serious challenge. 51 US Economic Outlook / August 2016<br>
slide52. Japan’s outlook summary 52 US Economic Outlook / August 2016 *Annual average, **Billions of US dollars Real GDP growth (%) Exchange rate per US dollar* Consumer price inflation (%) Current-account balance** Source: IHS © 2016 IHS Source: IHS © 2016 IHS Source: IHS © 2016 IHS Source: IHS © 2016 IHS<br>
slide53. Asia-Pacific will lead all regions in growth China’s fixed investment is decelerating as the economy rebalances toward consumer spending and services.
India’s economy is growing and foreign investment is rising, although progress has been slow on Prime Minister Narendra Modi’s reforms.
Indonesia’s growth is stabilizing in the 4–5% range; capital inflows are critical to financing the country’s significant infrastructure needs.
New manufacturing hubs such as Vietnam are emerging in Southeast Asia and South Asia as China loses cost competitiveness.
The information technology–business process outsourcing industry is set for continued rapid growth in India, Malaysia, and the Philippines.
Japan, Malaysia, and Vietnam would be major beneficiaries if the Trans-Pacific Partnership is implemented. 53 US Economic Outlook / August 2016<br>
slide54. Real GDP growth in Asia-Pacific 54 US Economic Outlook / August 2016 Real GDP Source: IHS © 2016 IHS<br>
slide55. Real GDP growth in Asia-Pacific 55 US Economic Outlook / August 2016 Real GDP Source: IHS © 2016 IHS<br>
slide56. China’s economic slowdown will continue in 2017 China’s slowdown is most evident in mining, heavy manufacturing, and utilities; services and light manufacturing are more resilient.
Brexit’s effects will be limited, and China’s government will support economic growth with more fiscal and monetary stimuli.
Home sales have picked up in 2016, although high inventories will continue to dampen construction activity.
A determinedly weak renminbi policy is unlikely; concerns about mass capital flight outweigh potential gains in export cost competitiveness.
Under China’s 13th Five-Year Plan, services will account for 70% of incremental growth in 2016–20, up from about 60% in 2011–15.
Vast excess industrial capacity, financed by an explosion of debt, is the biggest threat to China’s growth prospects. 56 US Economic Outlook / August 2016<br>
slide57. China outlook summary 57 US Economic Outlook / August 2016 *Annual average, **Billions of US dollars Real GDP growth (%) Exchange rate per US dollar* Consumer price inflation (%) Current-account balance** Source: IHS © 2016 IHS Source: IHS © 2016 IHS Source: IHS © 2016 IHS Source: IHS © 2016 IHS<br>
slide58. China’s fixed investment has decelerated; retail sales and industrial output growth is steady 58 US Economic Outlook / August 2016 Key indicators Sources: NBS, China Customs, IHS © 2016 IHS<br>
slide59. China’s lending flows remain elevated in 2016, leading to rapid debt accumulation 59 US Economic Outlook / August 2016 Lending flows * 2016 forecast based on data through July
Source: People’s Bank of China, IHS © 2016 IHS<br>
slide60. Chinese debt is predominantly concentrated in loans between state entities 60 US Economic Outlook / August 2016 Percent of total debt outstanding, 2014 Source: IHS © 2016 IHS<br>
slide61. China’s economic growth by sector 61 US Economic Outlook / August 2016<br>
slide62. China’s economic growth will downshift in the long run 62 US Economic Outlook / August 2016 Real GDP and industrial production Source: IHS © 2016 IHS<br>
slide63. India is outpacing China in economic growth India’s robust growth is led by consumer spending and services.
Foreign direct investment and government infrastructure projects are driving capital spending; local private investment remains weak.
Brexit could mildly hurt India if global risk aversion leads to reduced foreign direct and portfolio investment.
The Reserve Bank of India is expected to hold its policy rate at 6.50% to restrain inflation. Consumer prices rose 6.10% year on year in July.
The goods and services tax (GST) is expected to take effect in late 2017. By reducing logistics costs and double taxation, the GST will improve manufacturing competitiveness and accelerate development of India’s e-commerce industry.
Other policy reforms will move forward slowly. Much remains to be done to open markets, upgrade infrastructure, and raise productivity. 63 US Economic Outlook / August 2016<br>
slide64. India outlook summary 64 US Economic Outlook / August 2016 *Annual average, **Billions of US dollars Real GDP growth (%, fiscal years) Exchange rate per US dollar* Consumer price inflation (%) Current-account balance** Source: IHS © 2016 IHS Source: IHS © 2016 IHS Source: IHS © 2016 IHS Source: IHS © 2016 IHS<br>
slide65. The Middle East and North Africa The drop in oil prices, regional political instability, and war with the Islamic State are restraining economic growth.
The region shifted from current-account surpluses to deficits in 2015; a return to surplus is expected in 2017 as oil prices recover.
Lower oil prices are hurting Iran, Kuwait, Iraq, Saudi Arabia, the UAE, and Libya, but are helping Jordan, Lebanon, Morocco, and Tunisia.
Whereas Saudi Arabia, Kuwait, and the UAE have substantial reserves, the finances of Iran, Libya, and Algeria are strained.
The end of sanctions is raising Iran’s oil exports and economic growth.
Egypt’s economy is expanding, but political and security risks remain.
Addressing job growth, economic diversification, and competitiveness will be critical to regional stability in the long run. 65 US Economic Outlook / August 2016<br>
slide66. Real GDP growth in the Middle East and North Africa 66 US Economic Outlook / August 2016 Real GDP Source: IHS © 2016 IHS<br>
slide67. Sub-Saharan Africa depends on commodity exports Weak commodity prices and the slowdown in China are hurting export revenues, foreign investment, and economic growth.
South Africa will struggle with large fiscal and current-account deficits and a challenging business environment.
In Nigeria, terrorism by Boko Haram and attacks on oil facilities could threaten foreign direct investment and the economy. The naira has plummeted following the end of peg to the US dollar.
Poor infrastructure (especially power generation), political instability, and corruption remain obstacles to economic development.
In the long run, expanding domestic markets, growing middle-class populations, and regional integration will support economic growth.
Several countries have strong growth prospects, including Kenya, Mozambique, Ethiopia, Liberia, Uganda, Ghana, and Tanzania. 67 US Economic Outlook / August 2016<br>
slide68. Real GDP growth in sub-Saharan Africa 68 US Economic Outlook / August 2016 Real GDP Source: IHS © 2016 IHS<br>
slide69. Summary Europe’s growth will be restrained by the UK vote to exit the European Union, leaving global economic growth below 3% through 2017.
Emerging markets will rebound but will not regain the peak growth rates of the 2000s.
The US economy is fundamentally strong; consumer spending and homebuilding will drive growth.
The Asia-Pacific region will make the strongest contribution to global economic growth.
Risks abound, including financial-market turbulence, China’s rising debt and excess capacity, conflicts in the Middle East and Africa, high Eurozone debt burdens, and stagnation in developed countries. 69 US Economic Outlook / August 2016<br>
slide70. Economics<br>