
Writing linear equations in the form y = mx +

Description: Writing linear equations in the form y mx c (from 4.2 Graphical representations) KS3 Mastery PD Materials: Exemplified Key Ideas Materials for use in the classroom or to support professional development discussions Summer 2021 About
Related Topics
Download Presentation
"Writing linear equations in the form y = mx +" is the property of its rightful owner. Permission is granted to download and print the materials on this website for personal, non-commercial use only, and to display it on your personal computer provided you do not modify the materials and that you retain all copyright notices contained in the materials. By downloading content from our website, you accept the terms of this agreement.
Presentation Transcript
slide1. Writing linear equations in the form y = mx + c (from 4.2 Graphical representations) KS3 Mastery PD Materials: Exemplified Key Ideas
Materials for use in the classroom or to support professional development discussions Summer 2021<br>
slide2. About this resource These slides are designed to complement the 4.2 Graphical representations Core Concept document and its associated Theme Overview document 4 Sequences and Graphs, both found in the Secondary Mastery Professional Development pages.
These slides re-present the key examples from the Core Concept document so that the examples can be used either directly in the classroom or with a group of teachers. There are prompt questions alongside the examples, and further clarification in the notes.
These slides do not fully replicate the Core Concept document, so should be used alongside it. Reference to specific page numbers, and to other useful NCETM resources, can be found in the notes for each slide.
This slide deck is not designed to be a complete PD session, rather it is a selection of resources that you can adapt and use as needed when planning a session with a group of teachers.<br>
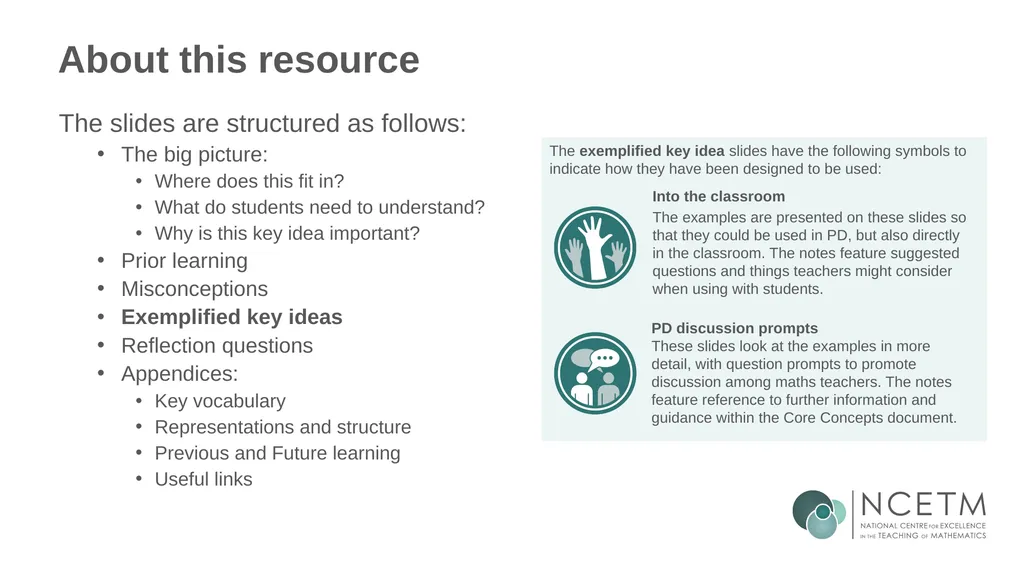
slide3. About this resource The slides are structured as follows:
The big picture:
Where does this fit in?
What do students need to understand?
Why is this key idea important?
Prior learning
Misconceptions
Exemplified key ideas
Reflection questions
Appendices:
Key vocabulary
Representations and structure
Previous and Future learning
Useful links The exemplified key idea slides have the following symbols to indicate how they have been designed to be used: Into the classroom
The examples are presented on these slides so that they could be used in PD, but also directly in the classroom. The notes feature suggested questions and things teachers might consider when using with students. PD discussion prompts
These slides look at the examples in more detail, with question prompts to promote discussion among maths teachers. The notes feature reference to further information and guidance within the Core Concepts document.<br>
slide4. Where does this fit in? The NCETM has identified a set of six ‘mathematical themes’ within Key Stage 3 mathematics that bring together a group of ‘core concepts’.
The fourth of these themes is Sequences and graphs, which covers the following interconnected core concepts:
4.1 Sequences
4.2 Graphical representations<br>
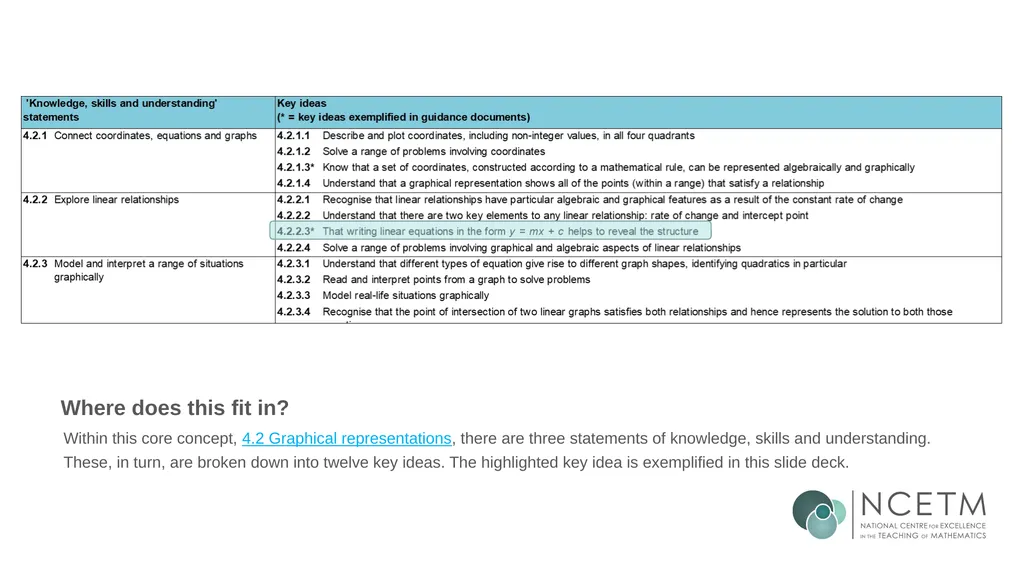
slide5. Where does this fit in? Within this core concept, 4.2 Graphical representations, there are three statements of knowledge, skills and understanding.
These, in turn, are broken down into twelve key ideas. The highlighted key idea is exemplified in this slide deck.<br>
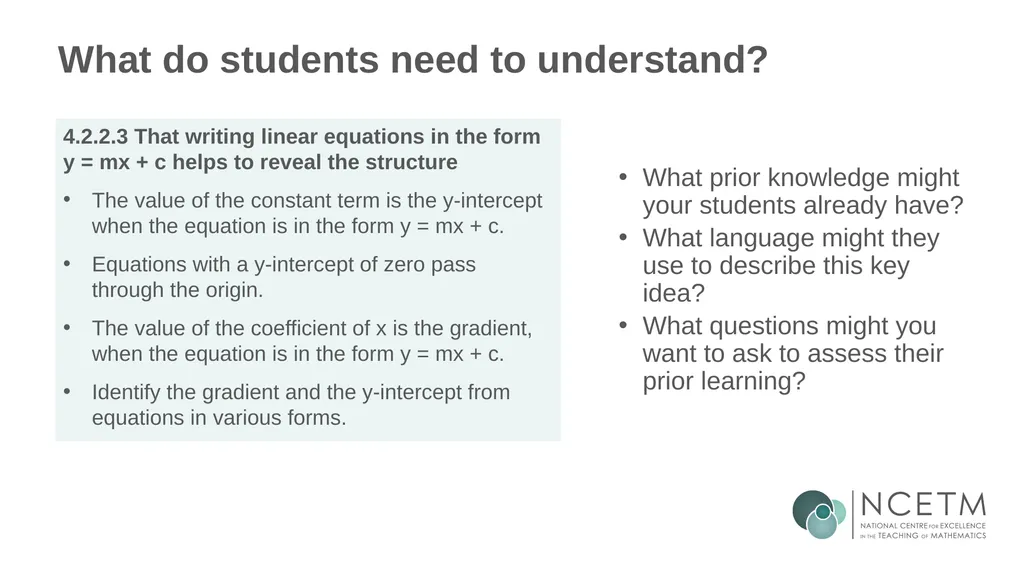
slide6. What do students need to understand? What prior knowledge might your students already have?
What language might they use to describe this key idea?
What questions might you want to ask to assess their prior learning? 4.2.2.3 That writing linear equations in the form y = mx + c helps to reveal the structure
The value of the constant term is the y-intercept when the equation is in the form y = mx + c.
Equations with a y-intercept of zero pass through the origin.
The value of the coefficient of x is the gradient, when the equation is in the form y = mx + c.
Identify the gradient and the y-intercept from equations in various forms.<br>
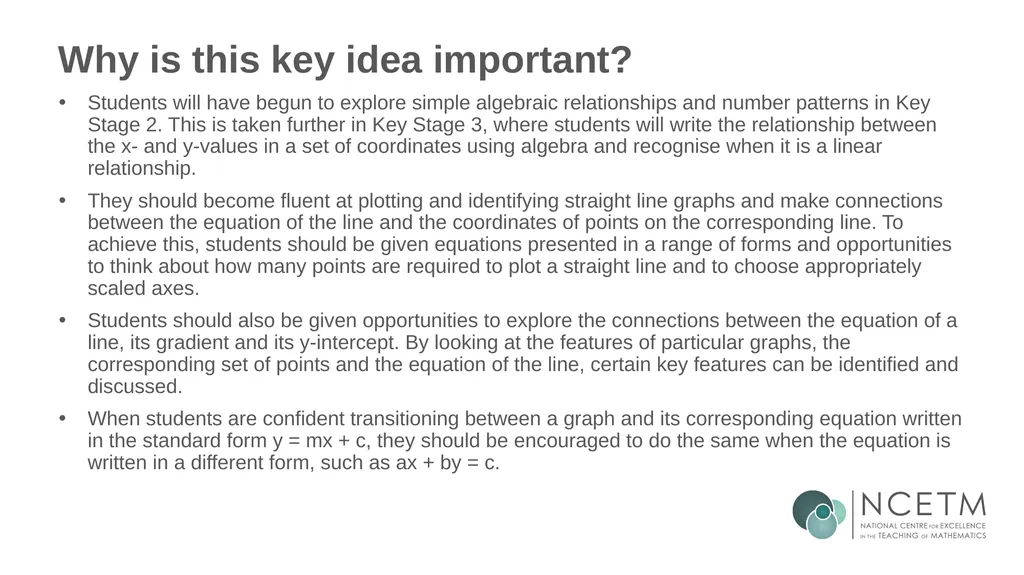
slide7. Why is this key idea important? Students will have begun to explore simple algebraic relationships and number patterns in Key Stage 2. This is taken further in Key Stage 3, where students will write the relationship between the x- and y-values in a set of coordinates using algebra and recognise when it is a linear relationship.
They should become fluent at plotting and identifying straight line graphs and make connections between the equation of the line and the coordinates of points on the corresponding line. To achieve this, students should be given equations presented in a range of forms and opportunities to think about how many points are required to plot a straight line and to choose appropriately scaled axes.
Students should also be given opportunities to explore the connections between the equation of a line, its gradient and its y-intercept. By looking at the features of particular graphs, the corresponding set of points and the equation of the line, certain key features can be identified and discussed.
When students are confident transitioning between a graph and its corresponding equation written in the standard form y = mx + c, they should be encouraged to do the same when the equation is written in a different form, such as ax + by = c.<br>
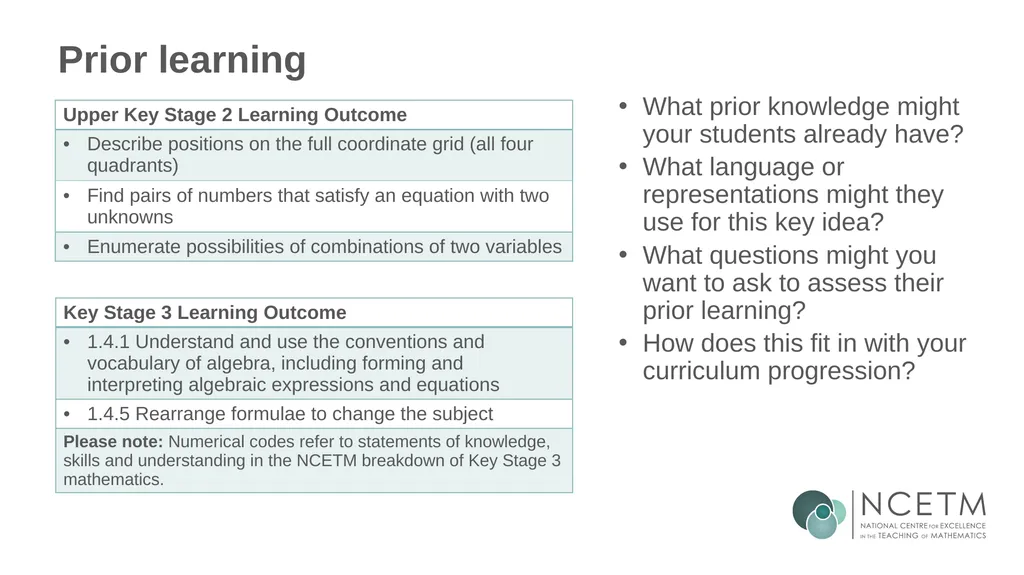
slide8. Prior learning What prior knowledge might your students already have?
What language or representations might they use for this key idea?
What questions might you want to ask to assess their prior learning?
How does this fit in with your curriculum progression?<br>
slide9. Checking prior learning The following slides contain questions for checking prior learning.
What representations might students use to support their understanding of these questions?
What variation might you put in place for these questions to fully assess students’ understanding of the concept?
How might changing the language of each question change the difficulty?
Why are these such crucial pre-requisites for this key idea?<br>
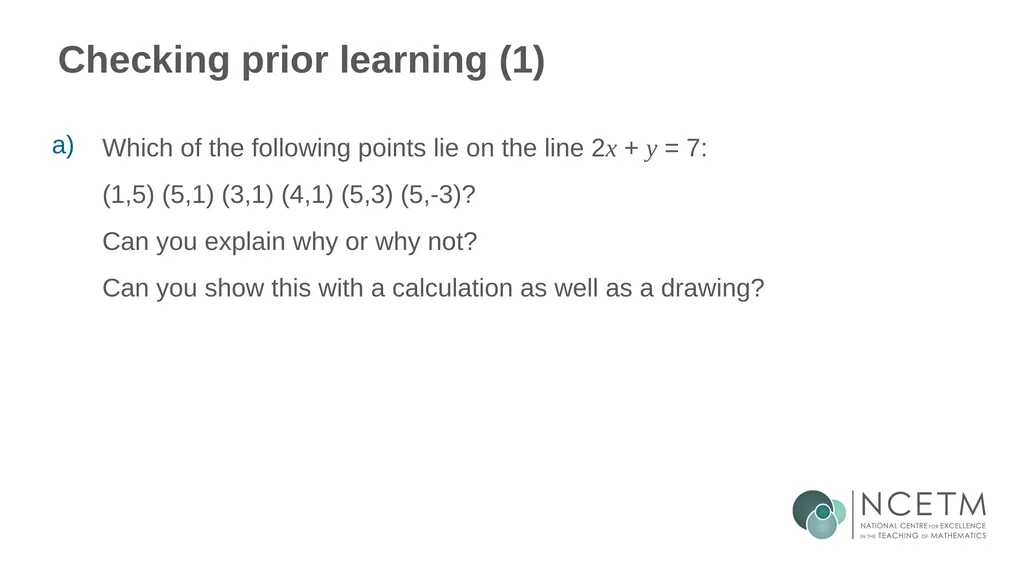
slide10. Checking prior learning (1) Which of the following points lie on the line 2x + y = 7:
(1,5) (5,1) (3,1) (4,1) (5,3) (5,-3)?
Can you explain why or why not?
Can you show this with a calculation as well as a drawing? a)<br>
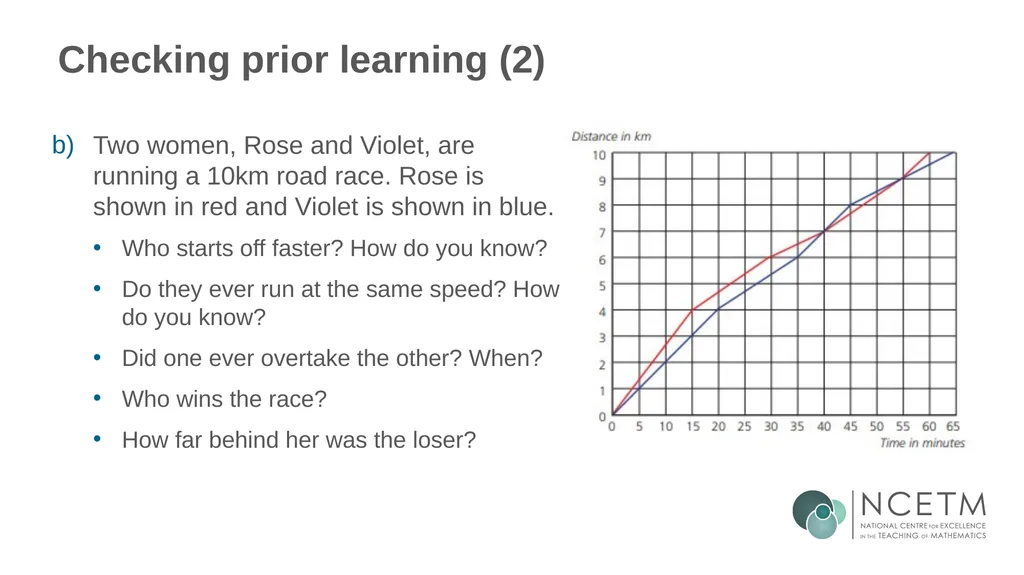
slide11. Checking prior learning (2) Two women, Rose and Violet, are running a 10km road race. Rose is shown in red and Violet is shown in blue.
Who starts off faster? How do you know?
Do they ever run at the same speed? How do you know?
Did one ever overtake the other? When?
Who wins the race?
How far behind her was the loser? b)<br>
slide12. Common difficulties and misconceptions What aspects of this key idea might students find challenging?
What misconceptions might students have? When teaching this topic, you may find students encounter difficulties with…
Assuming the difference between consecutive x co-ordinates can be written into the equation as an addition
The role of the y-intercept and the gradient
More information, and some suggestions for overcoming these challenges, can be found on the following slides.<br>
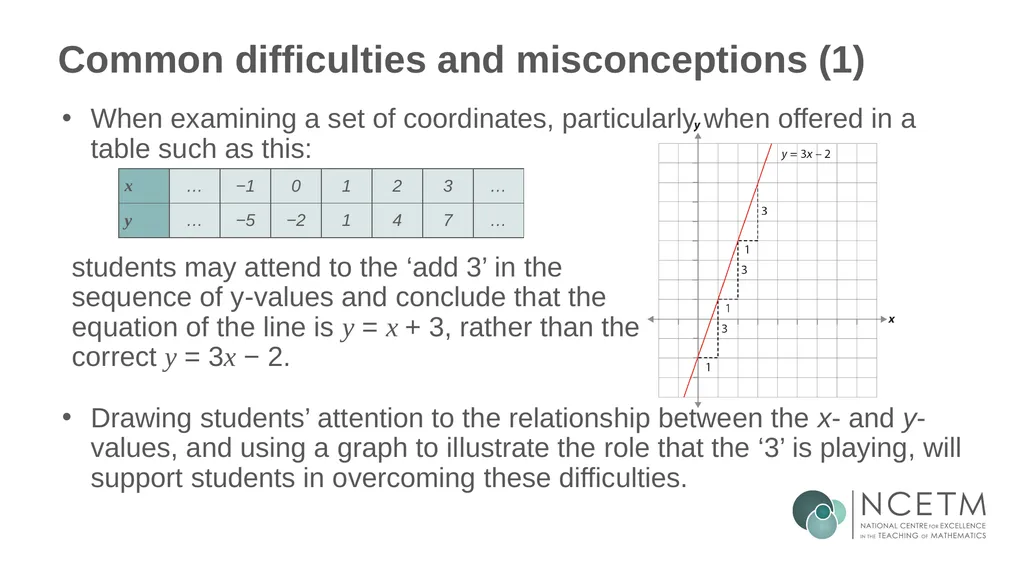
slide13. Common difficulties and misconceptions (1) When examining a set of coordinates, particularly when offered in a table such as this:
Drawing students’ attention to the relationship between the x- and y-values, and using a graph to illustrate the role that the ‘3’ is playing, will support students in overcoming these difficulties. students may attend to the ‘add 3’ in the sequence of y-values and conclude that the equation of the line is y = x + 3, rather than the correct y = 3x − 2.<br>
slide14. Common difficulties and misconceptions (2) Students should understand the key idea that the gradient is a measure of the rate at which the function is changing (i.e. as x increases by one, how is y increasing – or decreasing?) and that the y-intercept is a fixed point (i.e. the value of y when x is zero). Students should be aware that these two pieces of information uniquely define any straight line.
Another difficulty is the perceived randomness of ‘m’ and ‘c’ to represent the value of the gradient and y-intercept. Why not y = gx + i? Exploring the historical and cultural connections, such as ‘m’ representing the French word ‘monter’ (to climb or ascend) and ‘c’ representing the French word ‘commencer’ (to start), helps students to understand this mathematical convention and make connections with y = ax + b used in statistics.<br>
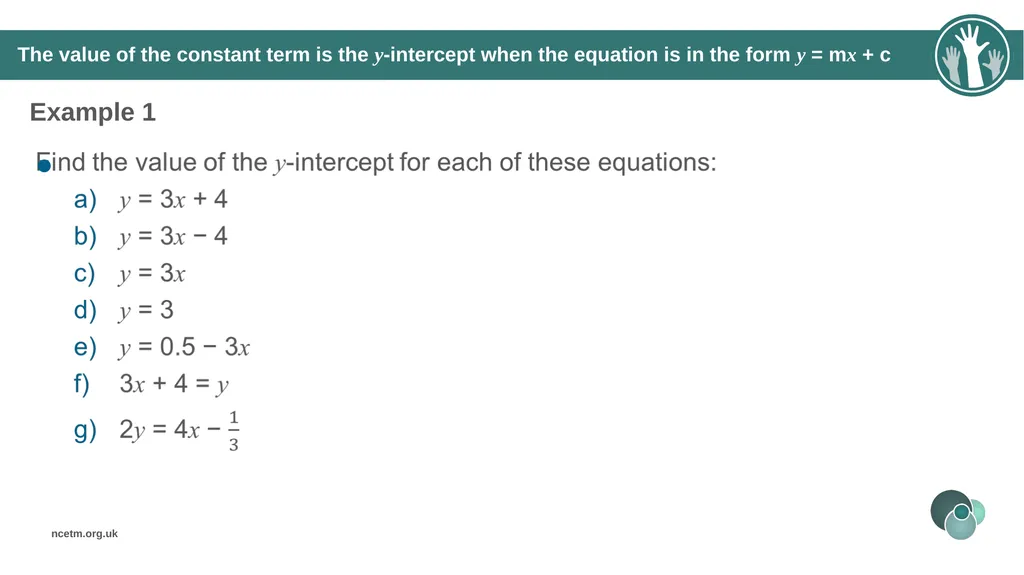
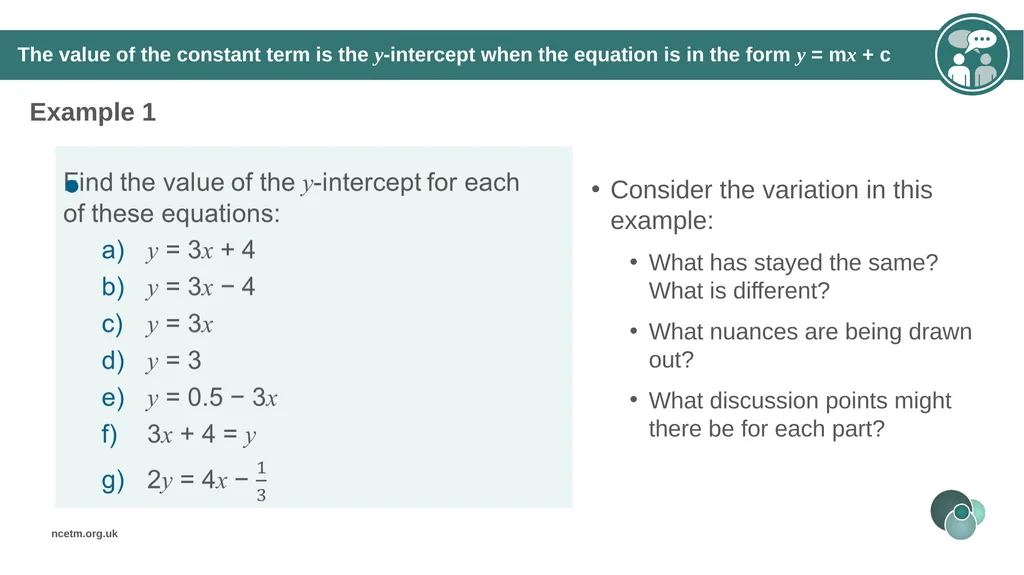
slide15. The value of the constant term is the y-intercept when the equation is in the form y = mx + c Example 1<br>
slide16. Consider the variation in this example:
What has stayed the same? What is different?
What nuances are being drawn out?
What discussion points might there be for each part? Example 1 The value of the constant term is the y-intercept when the equation is in the form y = mx + c<br>
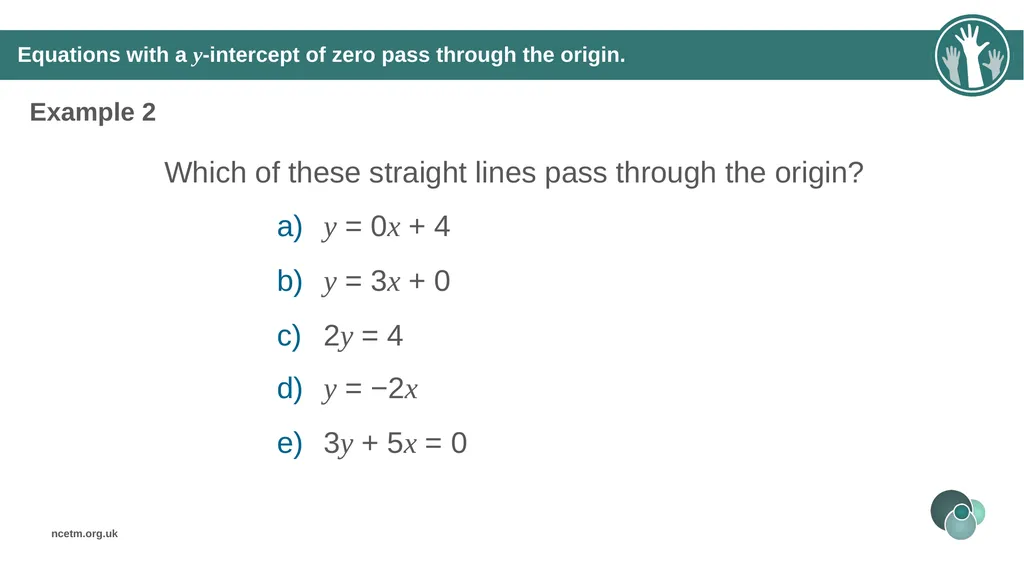
slide17. Equations with a y-intercept of zero pass through the origin. Example 2 Which of these straight lines pass through the origin? y = 0x + 4
y = 3x + 0
2y = 4
y = −2x
3y + 5x = 0<br>
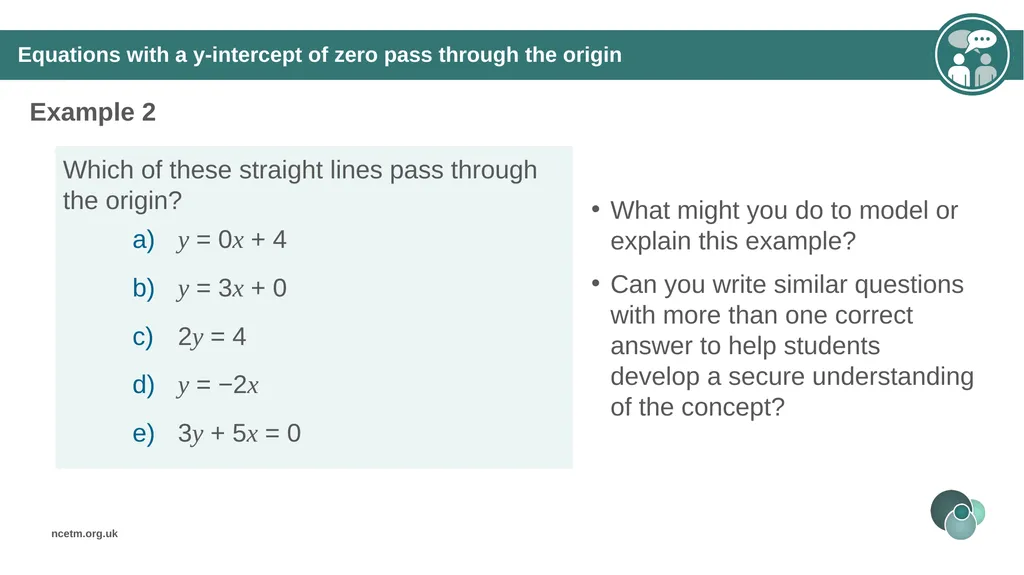
slide18. What might you do to model or explain this example?
Can you write similar questions with more than one correct answer to help students develop a secure understanding of the concept? Equations with a y-intercept of zero pass through the origin Example 2<br>
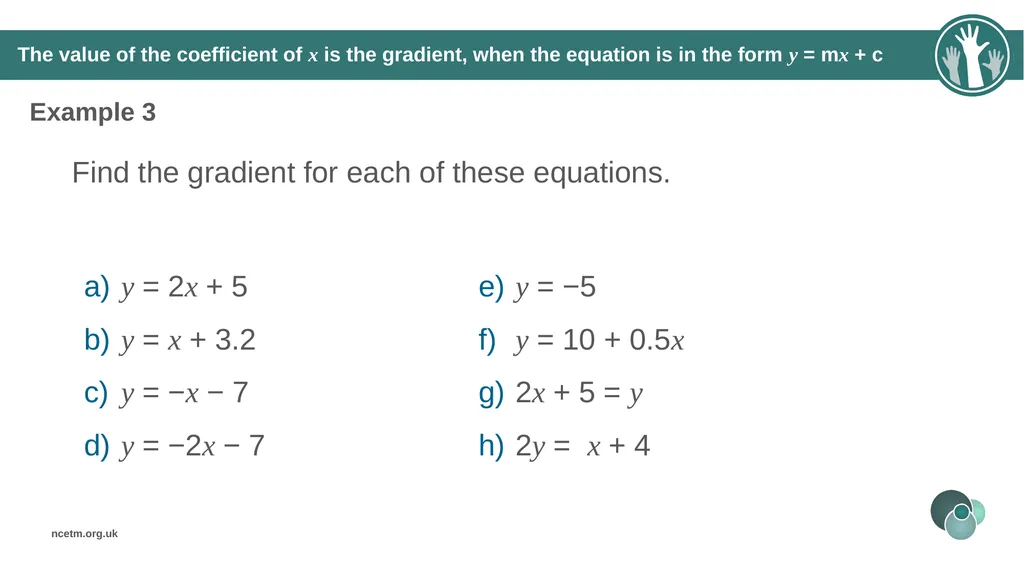
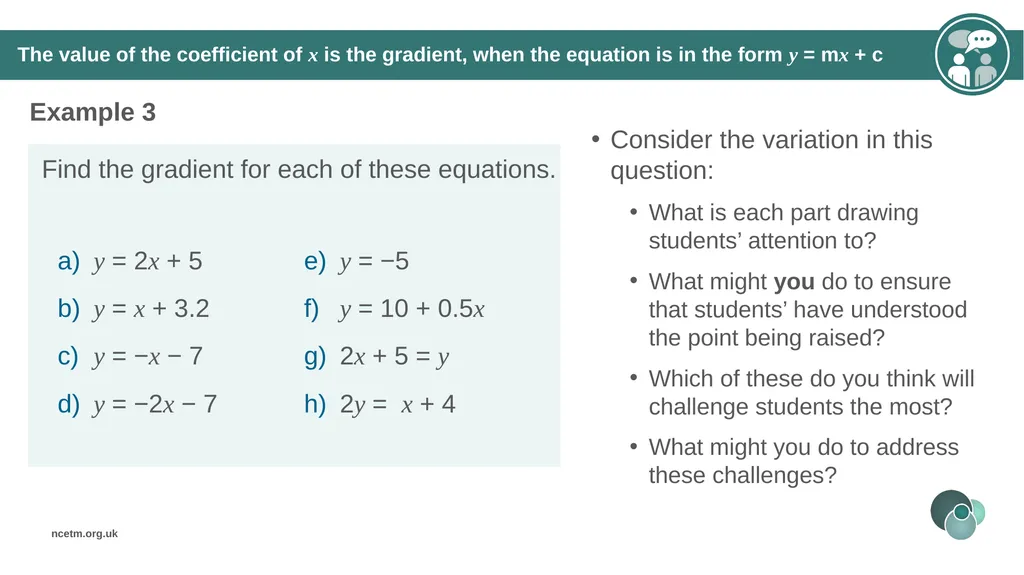
slide19. The value of the coefficient of x is the gradient, when the equation is in the form y = mx + c Example 3 Find the gradient for each of these equations. y = 2x + 5
y = x + 3.2
y = −x − 7
y = −2x − 7
y = −5
y = 10 + 0.5x
2x + 5 = y
2y = x + 4<br>
slide20. Consider the variation in this question:
What is each part drawing students’ attention to?
What might you do to ensure that students’ have understood the point being raised?
Which of these do you think will challenge students the most?
What might you do to address these challenges? Example 3 The value of the coefficient of x is the gradient, when the equation is in the form y = mx + c<br>
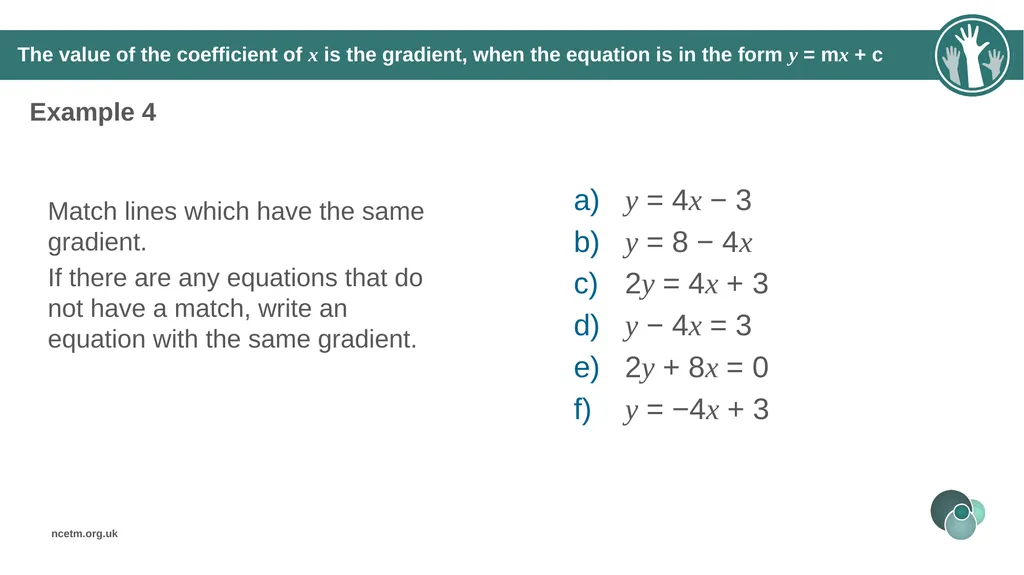
slide21. Example 4 Match lines which have the same gradient.
If there are any equations that do not have a match, write an equation with the same gradient. y = 4x − 3
y = 8 − 4x
2y = 4x + 3
y − 4x = 3
2y + 8x = 0
y = −4x + 3 The value of the coefficient of x is the gradient, when the equation is in the form y = mx + c<br>
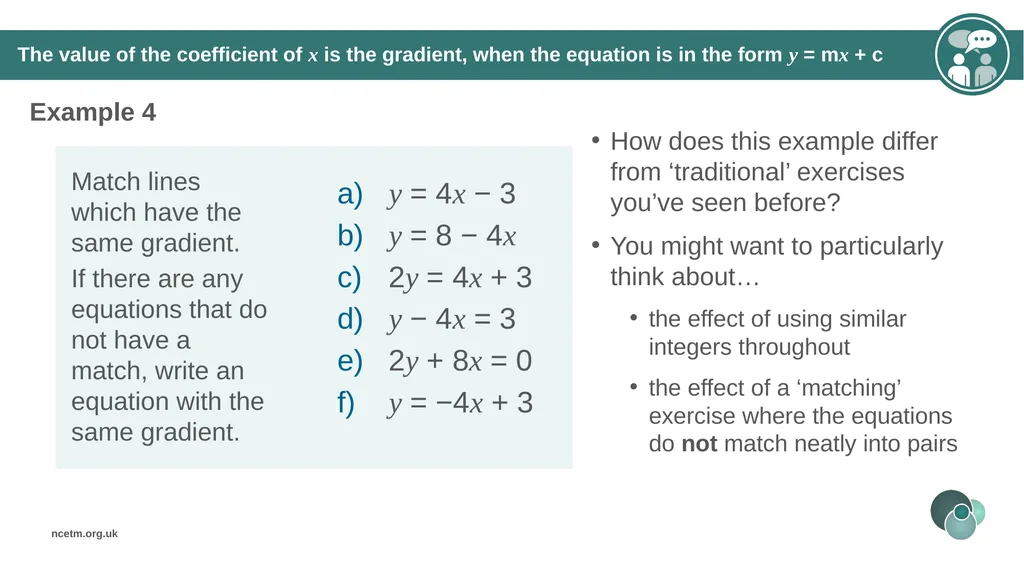
slide22. How does this example differ from ‘traditional’ exercises you’ve seen before?
You might want to particularly think about…
the effect of using similar integers throughout
the effect of a ‘matching’ exercise where the equations do not match neatly into pairs Example 4 The value of the coefficient of x is the gradient, when the equation is in the form y = mx + c<br>
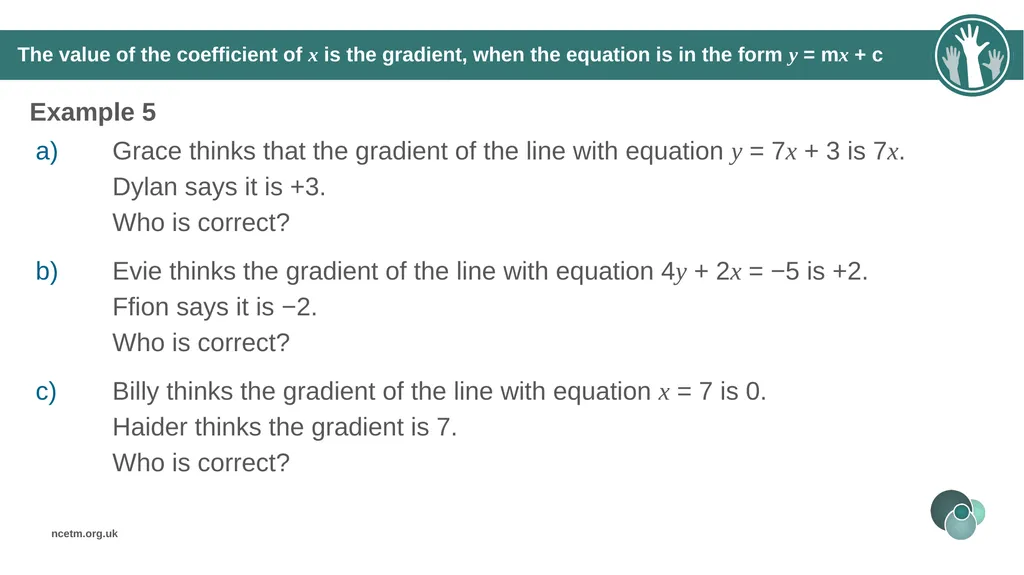
slide23. Example 5 a) Grace thinks that the gradient of the line with equation y = 7x + 3 is 7x.
Dylan says it is +3.
Who is correct?
b) Evie thinks the gradient of the line with equation 4y + 2x = −5 is +2.
Ffion says it is −2.
Who is correct?
c) Billy thinks the gradient of the line with equation x = 7 is 0.
Haider thinks the gradient is 7.
Who is correct? The value of the coefficient of x is the gradient, when the equation is in the form y = mx + c<br>
slide24. What misconceptions are being addressed by each part?
Can you write similar statements to help students discuss other common misconceptions? Example 5 The value of the coefficient of x is the gradient, when the equation is in the form y = mx + c<br>
slide25. Identify the gradient and the y-intercept from equations in various forms Example 6 Complete this table by finding the gradient and the coordinate of the y-intercept for each of the equations given.<br>
slide26. What is the potential value in asking for the coordinate of the y-intercept?
Which of these do you think your students would find most challenging? Why? How can you address these challenges? Example 6 Identify the gradient and the y-intercept from equations in various forms<br>
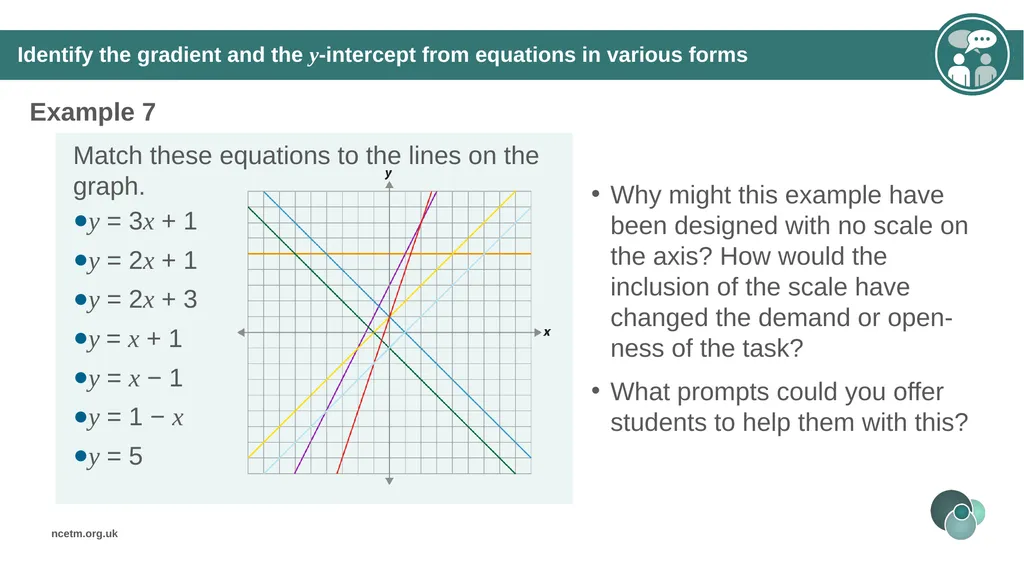
slide27. Identify the gradient and the y-intercept from equations in various forms Example 7 Match these equations to the lines on the graph.
y = 3x + 1
y = 2x + 1
y = 2x + 3
y = x + 1
y = x − 1
y = 1 − x
y = 5<br>
slide28. Why might this example have been designed with no scale on the axis? How would the inclusion of the scale have changed the demand or open-ness of the task?
What prompts could you offer students to help them with this? Example 7 Identify the gradient and the y-intercept from equations in various forms<br>
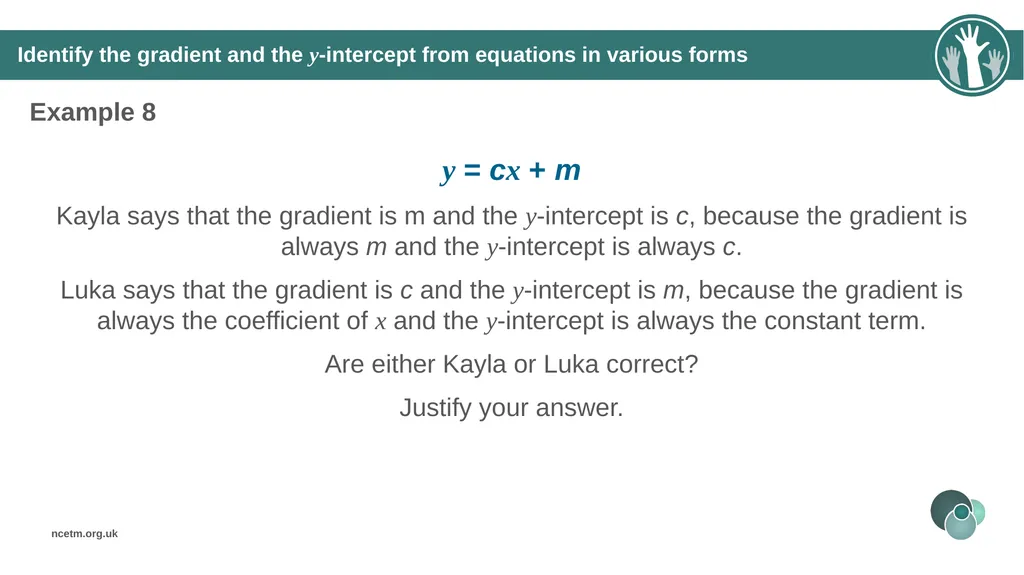
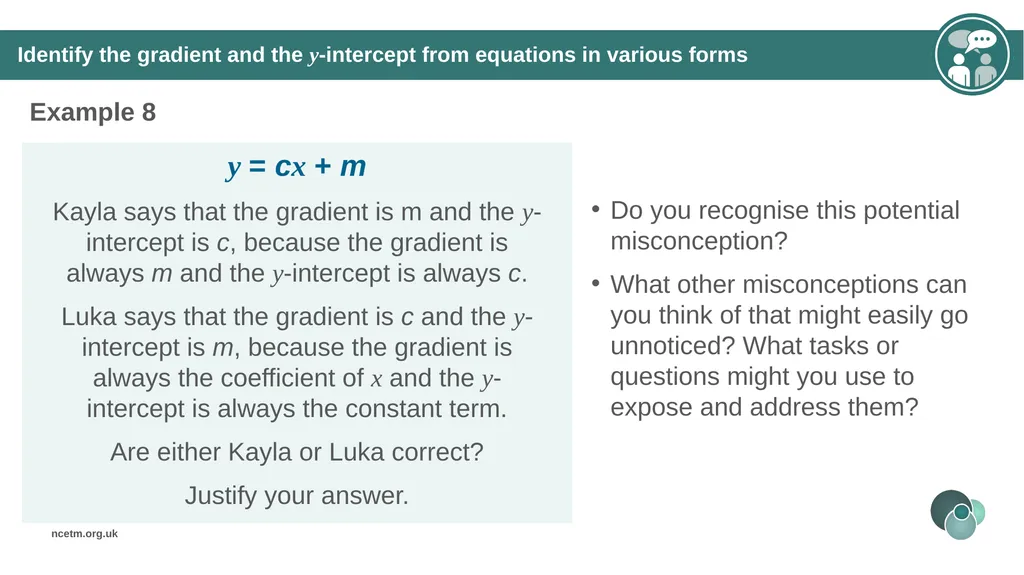
slide29. Identify the gradient and the y-intercept from equations in various forms Example 8 y = cx + m
Kayla says that the gradient is m and the y-intercept is c, because the gradient is always m and the y-intercept is always c.
Luka says that the gradient is c and the y-intercept is m, because the gradient is always the coefficient of x and the y-intercept is always the constant term.
Are either Kayla or Luka correct?
Justify your answer.<br>
slide30. Do you recognise this potential misconception?
What other misconceptions can you think of that might easily go unnoticed? What tasks or questions might you use to expose and address them? Example 8 Identify the gradient and the y-intercept from equations in various forms<br>
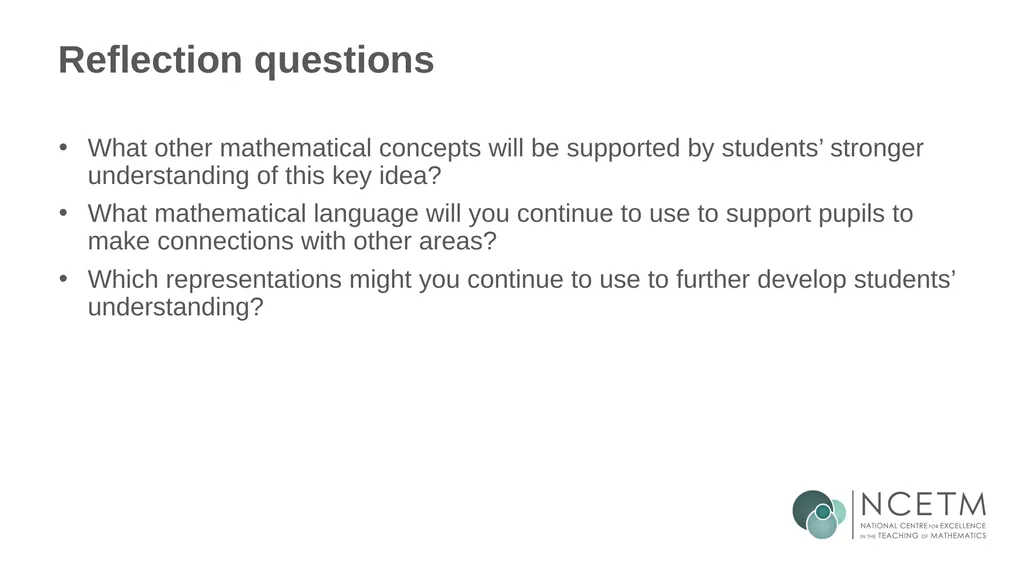
slide31. Reflection questions What other mathematical concepts will be supported by students’ stronger understanding of this key idea?
What mathematical language will you continue to use to support pupils to make connections with other areas?
Which representations might you continue to use to further develop students’ understanding?<br>
slide33. Appendices You may choose to use the following slides when planning or delivering a PD session. They cover:
Key vocabulary
Representations and structure
Previous learning
Future learning
Library of links<br>
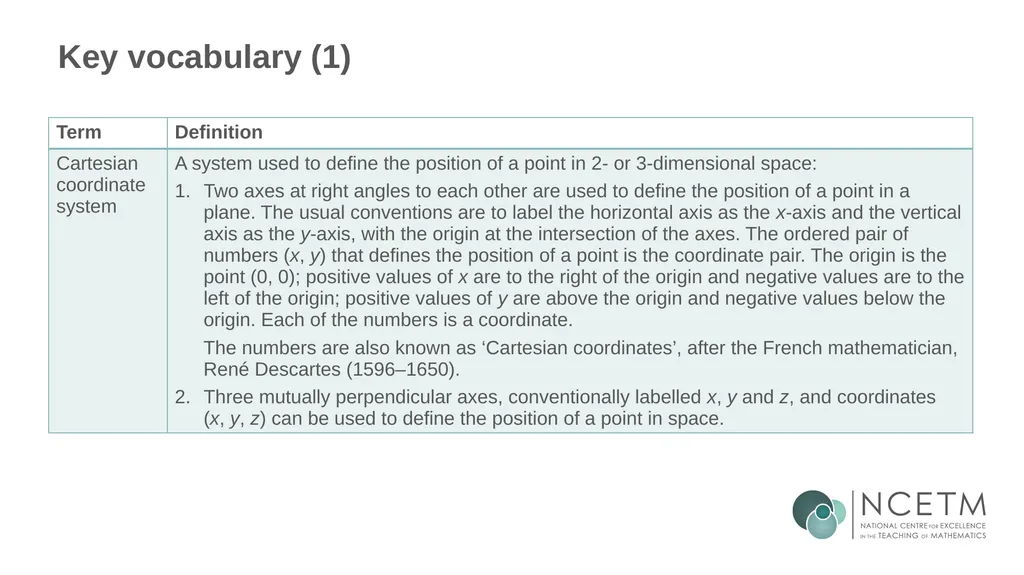
slide34. Key vocabulary (1)<br>
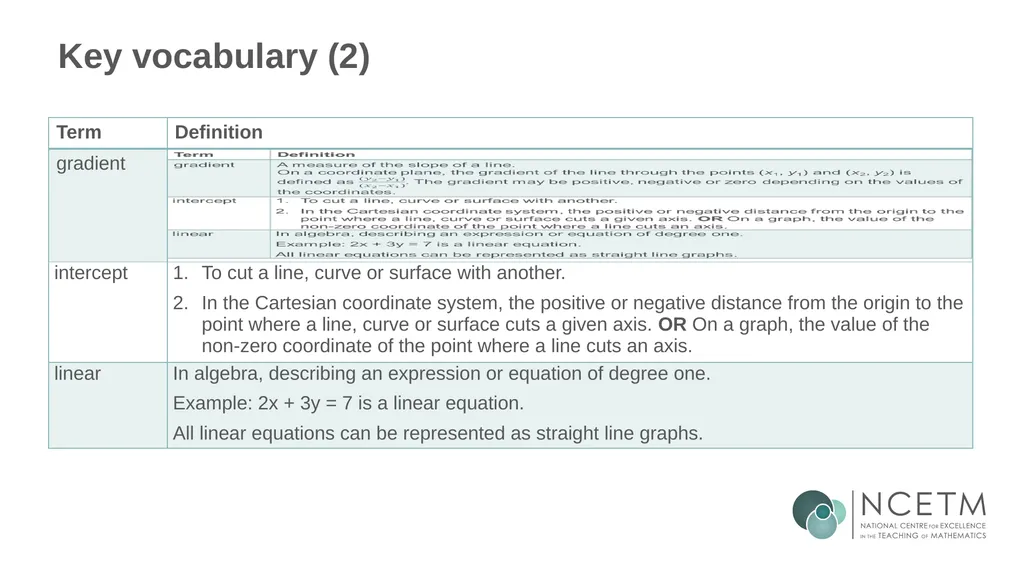
slide35. Key vocabulary (2)<br>
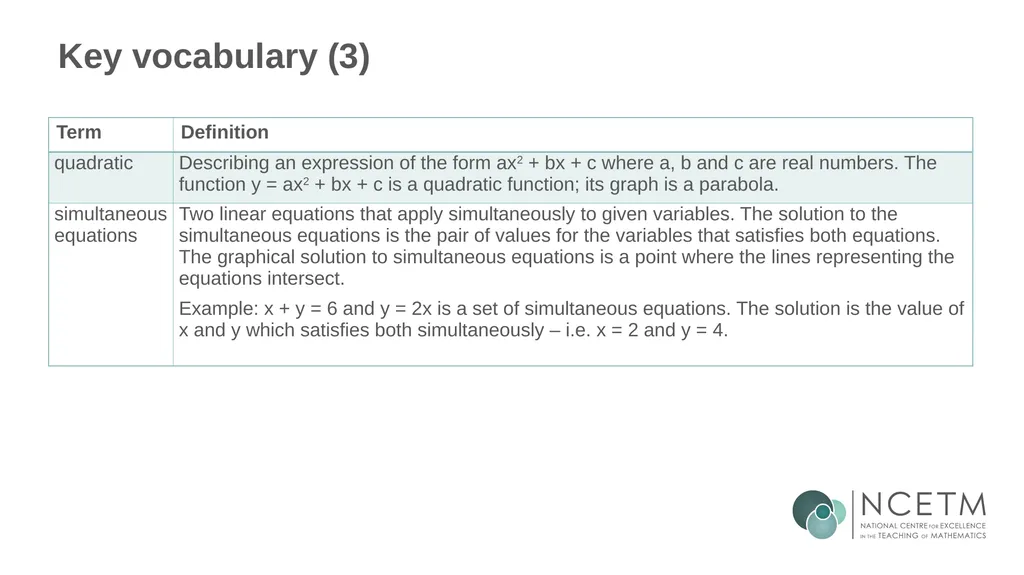
slide36. Key vocabulary (3)<br>
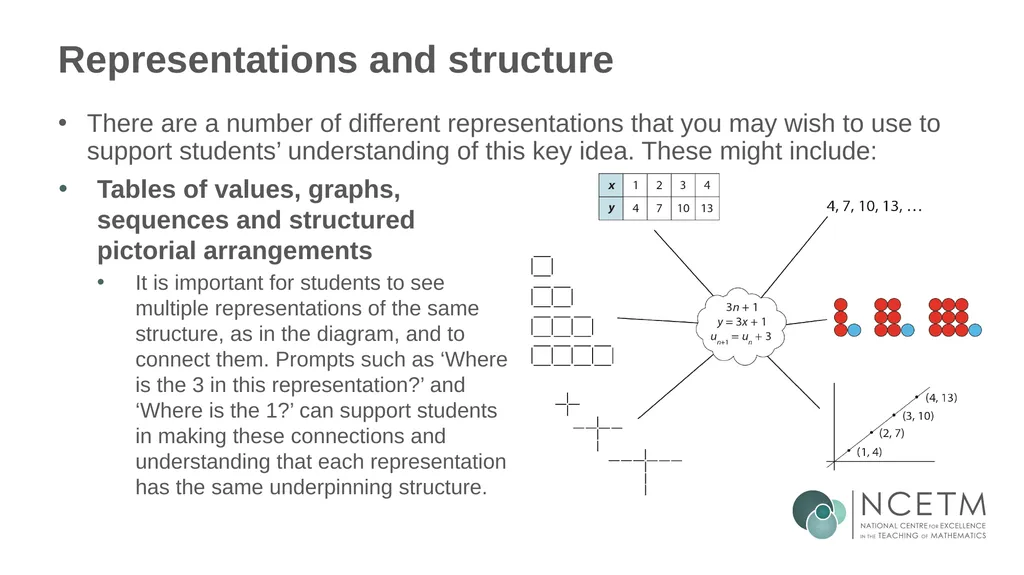
slide37. Representations and structure There are a number of different representations that you may wish to use to support students’ understanding of this key idea. These might include: Tables of values, graphs, sequences and structured pictorial arrangements
It is important for students to see multiple representations of the same structure, as in the diagram, and to connect them. Prompts such as ‘Where is the 3 in this representation?’ and ‘Where is the 1?’ can support students in making these connections and understanding that each representation has the same underpinning structure.<br>
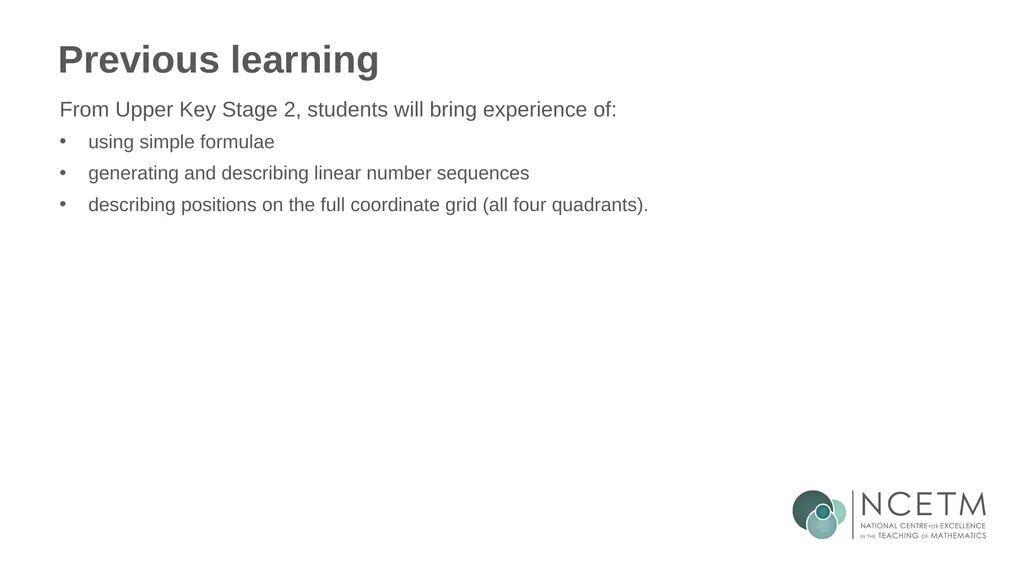
slide38. Previous learning From Upper Key Stage 2, students will bring experience of:
using simple formulae
generating and describing linear number sequences
describing positions on the full coordinate grid (all four quadrants).<br>
slide39. Future learning<br>
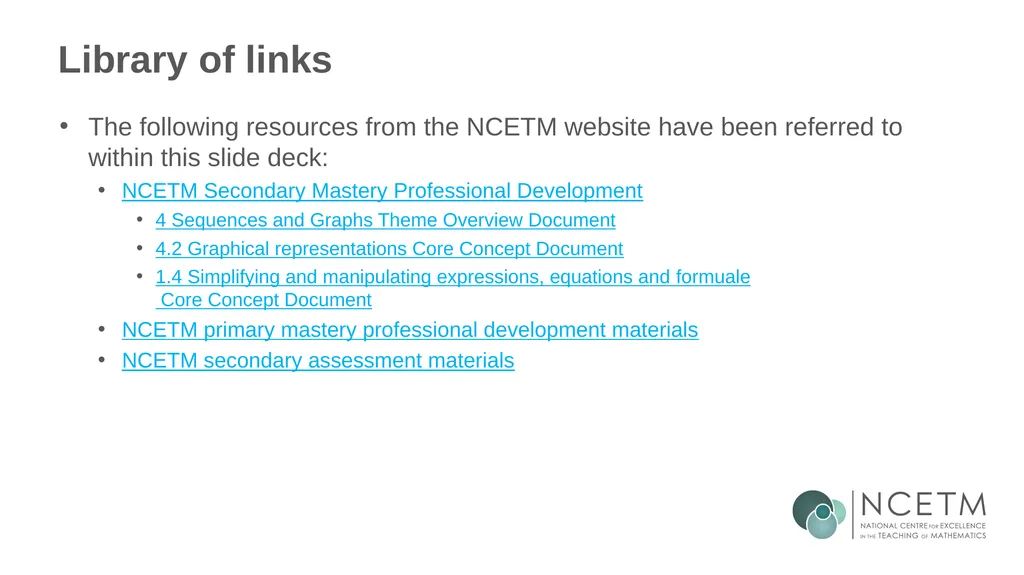
slide40. Library of links The following resources from the NCETM website have been referred to within this slide deck:
NCETM Secondary Mastery Professional Development
4 Sequences and Graphs Theme Overview Document
4.2 Graphical representations Core Concept Document
1.4 Simplifying and manipulating expressions, equations and formuale Core Concept Document
NCETM primary mastery professional development materials
NCETM secondary assessment materials<br>
Materials for use in the classroom or to support professional development discussions Summer 2021<br>
slide2. About this resource These slides are designed to complement the 4.2 Graphical representations Core Concept document and its associated Theme Overview document 4 Sequences and Graphs, both found in the Secondary Mastery Professional Development pages.
These slides re-present the key examples from the Core Concept document so that the examples can be used either directly in the classroom or with a group of teachers. There are prompt questions alongside the examples, and further clarification in the notes.
These slides do not fully replicate the Core Concept document, so should be used alongside it. Reference to specific page numbers, and to other useful NCETM resources, can be found in the notes for each slide.
This slide deck is not designed to be a complete PD session, rather it is a selection of resources that you can adapt and use as needed when planning a session with a group of teachers.<br>
slide3. About this resource The slides are structured as follows:
The big picture:
Where does this fit in?
What do students need to understand?
Why is this key idea important?
Prior learning
Misconceptions
Exemplified key ideas
Reflection questions
Appendices:
Key vocabulary
Representations and structure
Previous and Future learning
Useful links The exemplified key idea slides have the following symbols to indicate how they have been designed to be used: Into the classroom
The examples are presented on these slides so that they could be used in PD, but also directly in the classroom. The notes feature suggested questions and things teachers might consider when using with students. PD discussion prompts
These slides look at the examples in more detail, with question prompts to promote discussion among maths teachers. The notes feature reference to further information and guidance within the Core Concepts document.<br>
slide4. Where does this fit in? The NCETM has identified a set of six ‘mathematical themes’ within Key Stage 3 mathematics that bring together a group of ‘core concepts’.
The fourth of these themes is Sequences and graphs, which covers the following interconnected core concepts:
4.1 Sequences
4.2 Graphical representations<br>
slide5. Where does this fit in? Within this core concept, 4.2 Graphical representations, there are three statements of knowledge, skills and understanding.
These, in turn, are broken down into twelve key ideas. The highlighted key idea is exemplified in this slide deck.<br>
slide6. What do students need to understand? What prior knowledge might your students already have?
What language might they use to describe this key idea?
What questions might you want to ask to assess their prior learning? 4.2.2.3 That writing linear equations in the form y = mx + c helps to reveal the structure
The value of the constant term is the y-intercept when the equation is in the form y = mx + c.
Equations with a y-intercept of zero pass through the origin.
The value of the coefficient of x is the gradient, when the equation is in the form y = mx + c.
Identify the gradient and the y-intercept from equations in various forms.<br>
slide7. Why is this key idea important? Students will have begun to explore simple algebraic relationships and number patterns in Key Stage 2. This is taken further in Key Stage 3, where students will write the relationship between the x- and y-values in a set of coordinates using algebra and recognise when it is a linear relationship.
They should become fluent at plotting and identifying straight line graphs and make connections between the equation of the line and the coordinates of points on the corresponding line. To achieve this, students should be given equations presented in a range of forms and opportunities to think about how many points are required to plot a straight line and to choose appropriately scaled axes.
Students should also be given opportunities to explore the connections between the equation of a line, its gradient and its y-intercept. By looking at the features of particular graphs, the corresponding set of points and the equation of the line, certain key features can be identified and discussed.
When students are confident transitioning between a graph and its corresponding equation written in the standard form y = mx + c, they should be encouraged to do the same when the equation is written in a different form, such as ax + by = c.<br>
slide8. Prior learning What prior knowledge might your students already have?
What language or representations might they use for this key idea?
What questions might you want to ask to assess their prior learning?
How does this fit in with your curriculum progression?<br>
slide9. Checking prior learning The following slides contain questions for checking prior learning.
What representations might students use to support their understanding of these questions?
What variation might you put in place for these questions to fully assess students’ understanding of the concept?
How might changing the language of each question change the difficulty?
Why are these such crucial pre-requisites for this key idea?<br>
slide10. Checking prior learning (1) Which of the following points lie on the line 2x + y = 7:
(1,5) (5,1) (3,1) (4,1) (5,3) (5,-3)?
Can you explain why or why not?
Can you show this with a calculation as well as a drawing? a)<br>
slide11. Checking prior learning (2) Two women, Rose and Violet, are running a 10km road race. Rose is shown in red and Violet is shown in blue.
Who starts off faster? How do you know?
Do they ever run at the same speed? How do you know?
Did one ever overtake the other? When?
Who wins the race?
How far behind her was the loser? b)<br>
slide12. Common difficulties and misconceptions What aspects of this key idea might students find challenging?
What misconceptions might students have? When teaching this topic, you may find students encounter difficulties with…
Assuming the difference between consecutive x co-ordinates can be written into the equation as an addition
The role of the y-intercept and the gradient
More information, and some suggestions for overcoming these challenges, can be found on the following slides.<br>
slide13. Common difficulties and misconceptions (1) When examining a set of coordinates, particularly when offered in a table such as this:
Drawing students’ attention to the relationship between the x- and y-values, and using a graph to illustrate the role that the ‘3’ is playing, will support students in overcoming these difficulties. students may attend to the ‘add 3’ in the sequence of y-values and conclude that the equation of the line is y = x + 3, rather than the correct y = 3x − 2.<br>
slide14. Common difficulties and misconceptions (2) Students should understand the key idea that the gradient is a measure of the rate at which the function is changing (i.e. as x increases by one, how is y increasing – or decreasing?) and that the y-intercept is a fixed point (i.e. the value of y when x is zero). Students should be aware that these two pieces of information uniquely define any straight line.
Another difficulty is the perceived randomness of ‘m’ and ‘c’ to represent the value of the gradient and y-intercept. Why not y = gx + i? Exploring the historical and cultural connections, such as ‘m’ representing the French word ‘monter’ (to climb or ascend) and ‘c’ representing the French word ‘commencer’ (to start), helps students to understand this mathematical convention and make connections with y = ax + b used in statistics.<br>
slide15. The value of the constant term is the y-intercept when the equation is in the form y = mx + c Example 1<br>
slide16. Consider the variation in this example:
What has stayed the same? What is different?
What nuances are being drawn out?
What discussion points might there be for each part? Example 1 The value of the constant term is the y-intercept when the equation is in the form y = mx + c<br>
slide17. Equations with a y-intercept of zero pass through the origin. Example 2 Which of these straight lines pass through the origin? y = 0x + 4
y = 3x + 0
2y = 4
y = −2x
3y + 5x = 0<br>
slide18. What might you do to model or explain this example?
Can you write similar questions with more than one correct answer to help students develop a secure understanding of the concept? Equations with a y-intercept of zero pass through the origin Example 2<br>
slide19. The value of the coefficient of x is the gradient, when the equation is in the form y = mx + c Example 3 Find the gradient for each of these equations. y = 2x + 5
y = x + 3.2
y = −x − 7
y = −2x − 7
y = −5
y = 10 + 0.5x
2x + 5 = y
2y = x + 4<br>
slide20. Consider the variation in this question:
What is each part drawing students’ attention to?
What might you do to ensure that students’ have understood the point being raised?
Which of these do you think will challenge students the most?
What might you do to address these challenges? Example 3 The value of the coefficient of x is the gradient, when the equation is in the form y = mx + c<br>
slide21. Example 4 Match lines which have the same gradient.
If there are any equations that do not have a match, write an equation with the same gradient. y = 4x − 3
y = 8 − 4x
2y = 4x + 3
y − 4x = 3
2y + 8x = 0
y = −4x + 3 The value of the coefficient of x is the gradient, when the equation is in the form y = mx + c<br>
slide22. How does this example differ from ‘traditional’ exercises you’ve seen before?
You might want to particularly think about…
the effect of using similar integers throughout
the effect of a ‘matching’ exercise where the equations do not match neatly into pairs Example 4 The value of the coefficient of x is the gradient, when the equation is in the form y = mx + c<br>
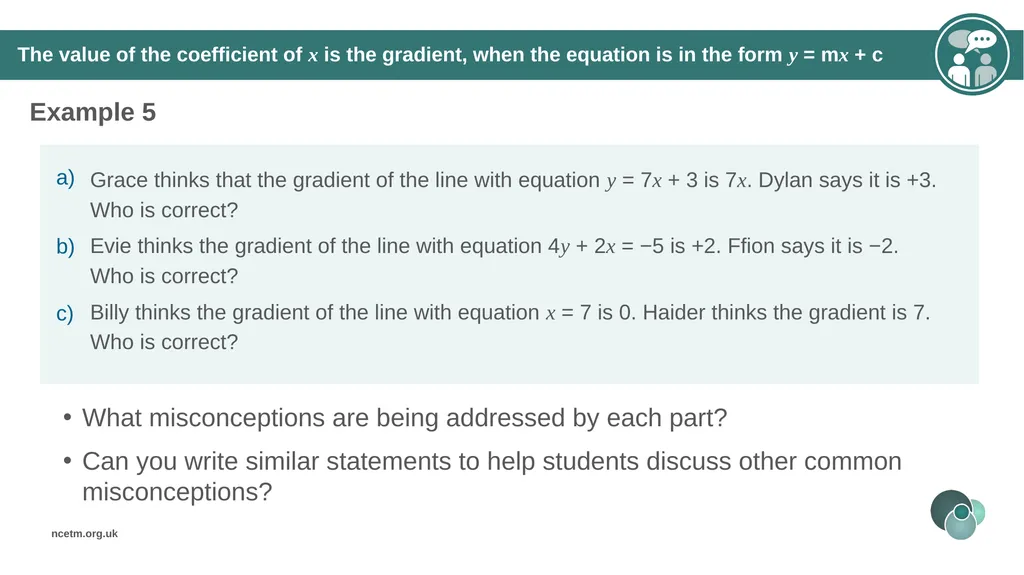
slide23. Example 5 a) Grace thinks that the gradient of the line with equation y = 7x + 3 is 7x.
Dylan says it is +3.
Who is correct?
b) Evie thinks the gradient of the line with equation 4y + 2x = −5 is +2.
Ffion says it is −2.
Who is correct?
c) Billy thinks the gradient of the line with equation x = 7 is 0.
Haider thinks the gradient is 7.
Who is correct? The value of the coefficient of x is the gradient, when the equation is in the form y = mx + c<br>
slide24. What misconceptions are being addressed by each part?
Can you write similar statements to help students discuss other common misconceptions? Example 5 The value of the coefficient of x is the gradient, when the equation is in the form y = mx + c<br>
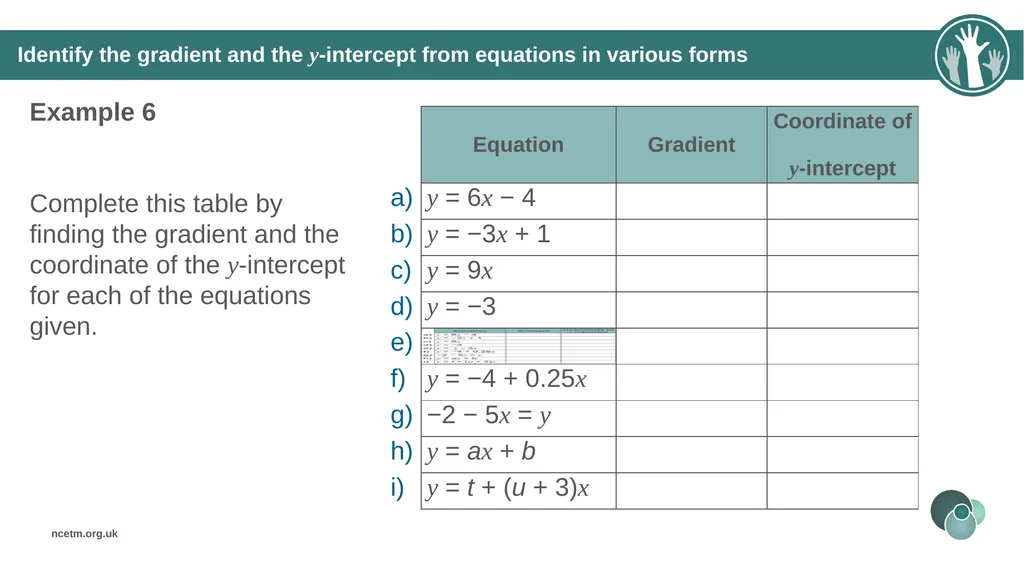
slide25. Identify the gradient and the y-intercept from equations in various forms Example 6 Complete this table by finding the gradient and the coordinate of the y-intercept for each of the equations given.<br>
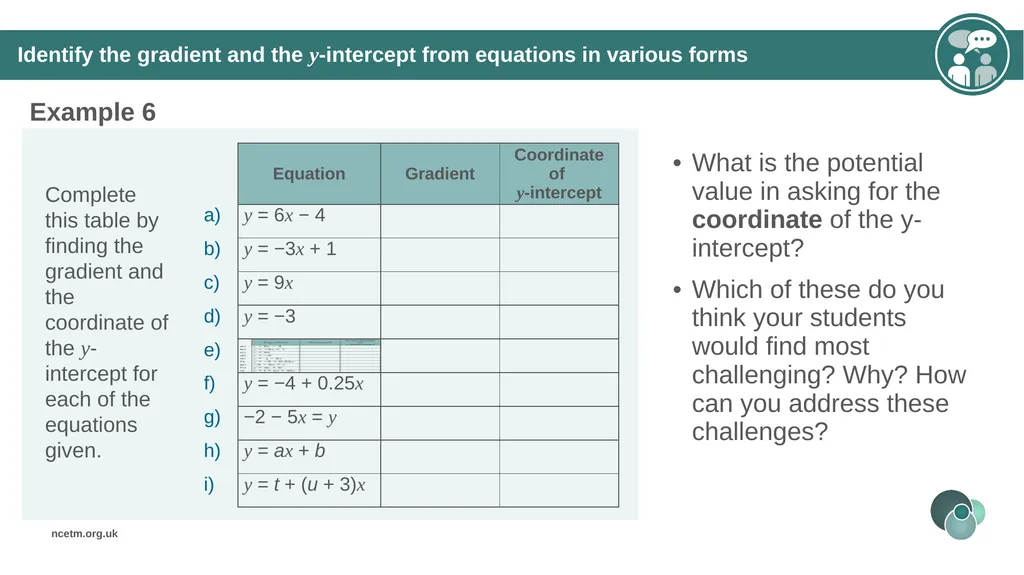
slide26. What is the potential value in asking for the coordinate of the y-intercept?
Which of these do you think your students would find most challenging? Why? How can you address these challenges? Example 6 Identify the gradient and the y-intercept from equations in various forms<br>
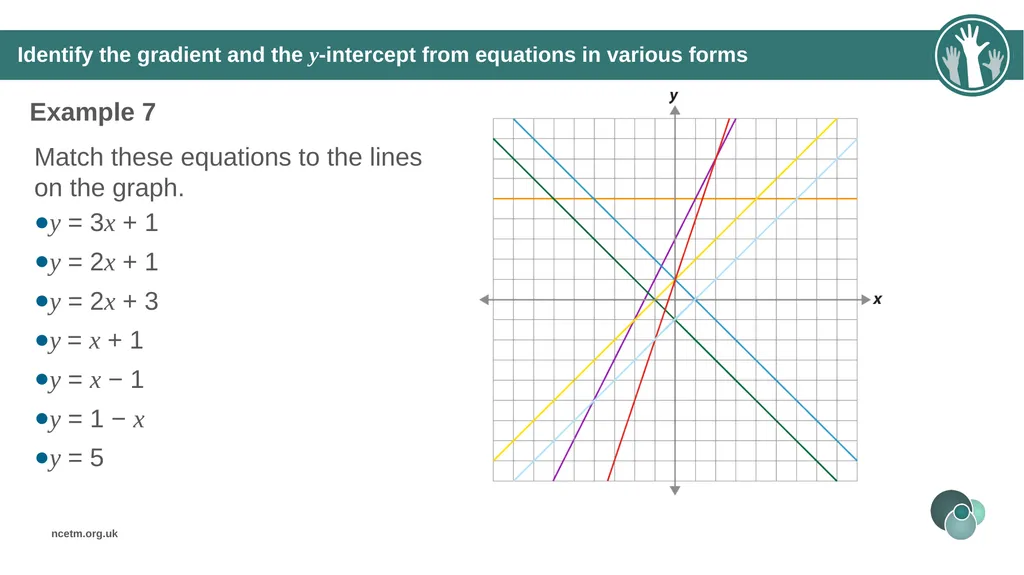
slide27. Identify the gradient and the y-intercept from equations in various forms Example 7 Match these equations to the lines on the graph.
y = 3x + 1
y = 2x + 1
y = 2x + 3
y = x + 1
y = x − 1
y = 1 − x
y = 5<br>
slide28. Why might this example have been designed with no scale on the axis? How would the inclusion of the scale have changed the demand or open-ness of the task?
What prompts could you offer students to help them with this? Example 7 Identify the gradient and the y-intercept from equations in various forms<br>
slide29. Identify the gradient and the y-intercept from equations in various forms Example 8 y = cx + m
Kayla says that the gradient is m and the y-intercept is c, because the gradient is always m and the y-intercept is always c.
Luka says that the gradient is c and the y-intercept is m, because the gradient is always the coefficient of x and the y-intercept is always the constant term.
Are either Kayla or Luka correct?
Justify your answer.<br>
slide30. Do you recognise this potential misconception?
What other misconceptions can you think of that might easily go unnoticed? What tasks or questions might you use to expose and address them? Example 8 Identify the gradient and the y-intercept from equations in various forms<br>
slide31. Reflection questions What other mathematical concepts will be supported by students’ stronger understanding of this key idea?
What mathematical language will you continue to use to support pupils to make connections with other areas?
Which representations might you continue to use to further develop students’ understanding?<br>
slide33. Appendices You may choose to use the following slides when planning or delivering a PD session. They cover:
Key vocabulary
Representations and structure
Previous learning
Future learning
Library of links<br>
slide34. Key vocabulary (1)<br>
slide35. Key vocabulary (2)<br>
slide36. Key vocabulary (3)<br>
slide37. Representations and structure There are a number of different representations that you may wish to use to support students’ understanding of this key idea. These might include: Tables of values, graphs, sequences and structured pictorial arrangements
It is important for students to see multiple representations of the same structure, as in the diagram, and to connect them. Prompts such as ‘Where is the 3 in this representation?’ and ‘Where is the 1?’ can support students in making these connections and understanding that each representation has the same underpinning structure.<br>
slide38. Previous learning From Upper Key Stage 2, students will bring experience of:
using simple formulae
generating and describing linear number sequences
describing positions on the full coordinate grid (all four quadrants).<br>
slide39. Future learning<br>
slide40. Library of links The following resources from the NCETM website have been referred to within this slide deck:
NCETM Secondary Mastery Professional Development
4 Sequences and Graphs Theme Overview Document
4.2 Graphical representations Core Concept Document
1.4 Simplifying and manipulating expressions, equations and formuale Core Concept Document
NCETM primary mastery professional development materials
NCETM secondary assessment materials<br>