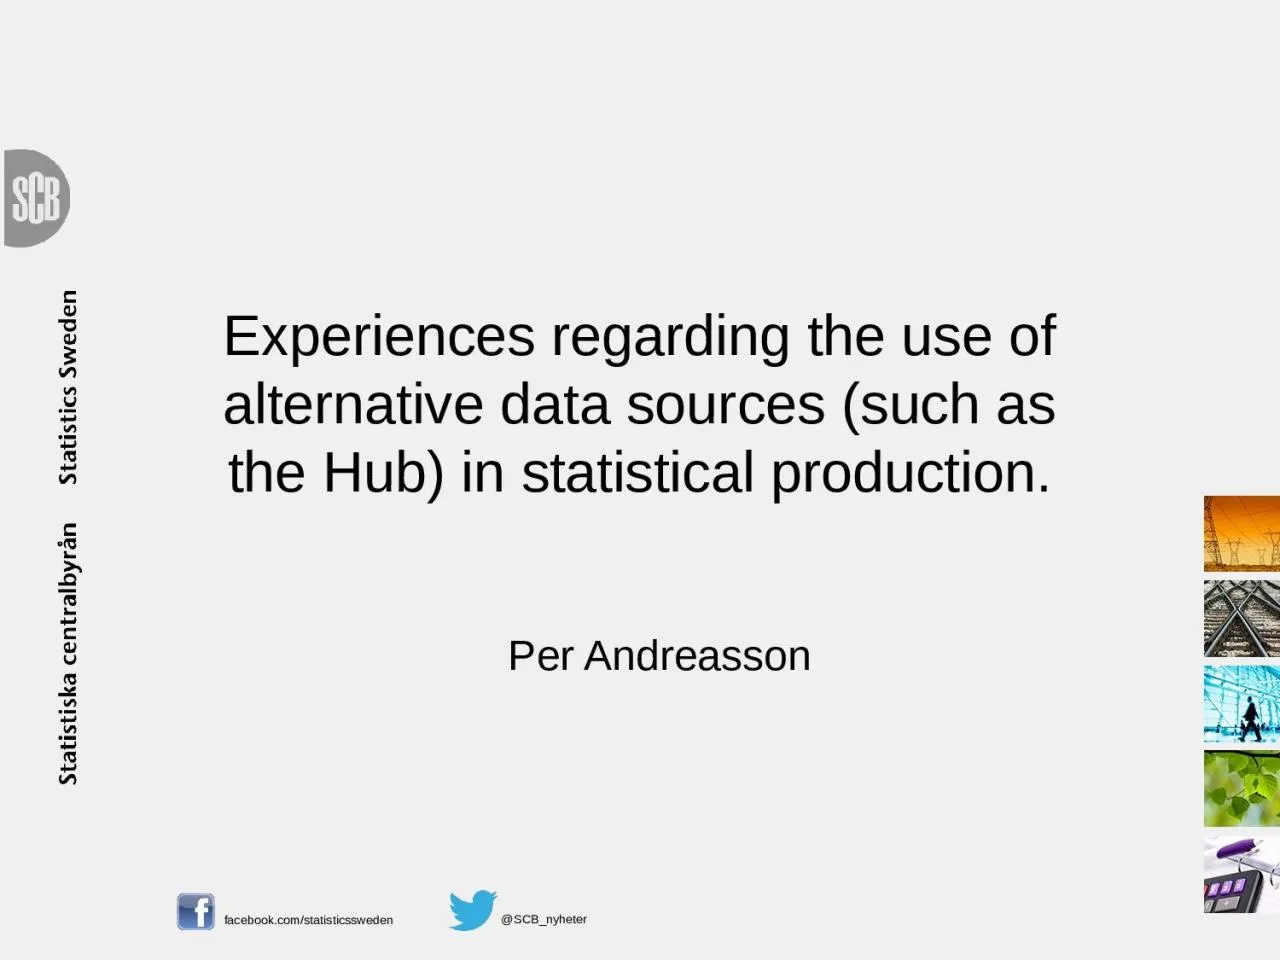
/
Experiences regarding  the use of alternative data sources (such as the Hub) in statistical Experiences regarding  the use of alternative data sources (such as the Hub) in statistical

Experiences regarding the use of alternative data sources (such as the Hub) in statistical - PowerPoint Presentation

walsh
walsh . @walsh
Follow
65 views
Uploaded On 2023-11-21

Experiences regarding the use of alternative data sources (such as the Hub) in statistical - PPT Presentation

Per Andreasson Digitalization in data collection The analog loop of stupidity An unbroken digital chain A stepwise approach to digitalization Halfdigitalized solution Web questionnaires ID: 1033894

data automated surveys solution automated data solution surveys semi machine hub statistical digitalization stefan questionnaires system

Share:

Link:

Embed:

Download Presentation from below link

Download Presentation The PPT/PDF document "Experiences regarding the use of altern..." is the property of its rightful owner. Permission is granted to download and print the materials on this web site for personal, non-commercial use only, and to display it on your personal computer provided you do not modify the materials and that you retain all copyright notices contained in the materials. By downloading content from our website, you accept the terms of this agreement.


Presentation Transcript

1. Experiences regarding the use of alternative data sources (such as the Hub) in statistical production.Per Andreasson

2. Digitalization in data collection

3. The analog loop of stupidity

4. An unbroken digital chain

5. A step-wise approach to digitalization Half-digitalized solution: Web questionnaires.Semi-automated solution: Some data provided from systems, but manually completed. Fully automated solution (Machine-to-machine), where data is sent from a business system or a Hub to an authority automatically, without any manual work needed.

6.

7. The gains for us… Better possibility to combine and reuse sourcesLess time devoted to micro editing and re-contactsBetter consistency in the statistical system

8. 1423SourcesData collectionOutputData WarehouseOutput AOutput CDFOutput COutput EOutput GOutput BOutput DOutput FOutput ACCoordinating questionnaires – The visionMetadata Warehouse

9. Difference in definitions between SurveysEmployedSurvey534 813Moms, LAPS547 242LAPS-NR502 700KS?547 298 KS?548 336FEK, SAMO, IVP, INFI, TFF546 518FEK Regionalt547 531FEK Eurostat548 273NR502 625AKU

10. Company XNumber of employees: 159Monthly surveys:Kortperiodisk sysselsättningsstatistik - MarieIntrastat - MarianneKonjInd – Stefan och YlvaKsju - MarieKonjunkturstatistik över vakanser - JonasKLP - MariePPIQuarterly surveys:Kvartalsvis bränslestatistik - ClaesInvesteringsenkäten - StefanIndustrins lager - StefanUHT - StefanAnnual surveys:SLPBONUS - JonasFEK - YlvaFöretagens utgifter för IT - YlvaISEN - YlvaIVP - StefanUtlandsägda företag - Stefan

11. ConclusionsDigitalization is coming!Both automated and semi-automated necessaryCooperation is a keyNeeds thinking in new ways

12. Hasta la vista!Thank youAny questions?