PPT-Scalable Data Visualization and Social Data Analysis
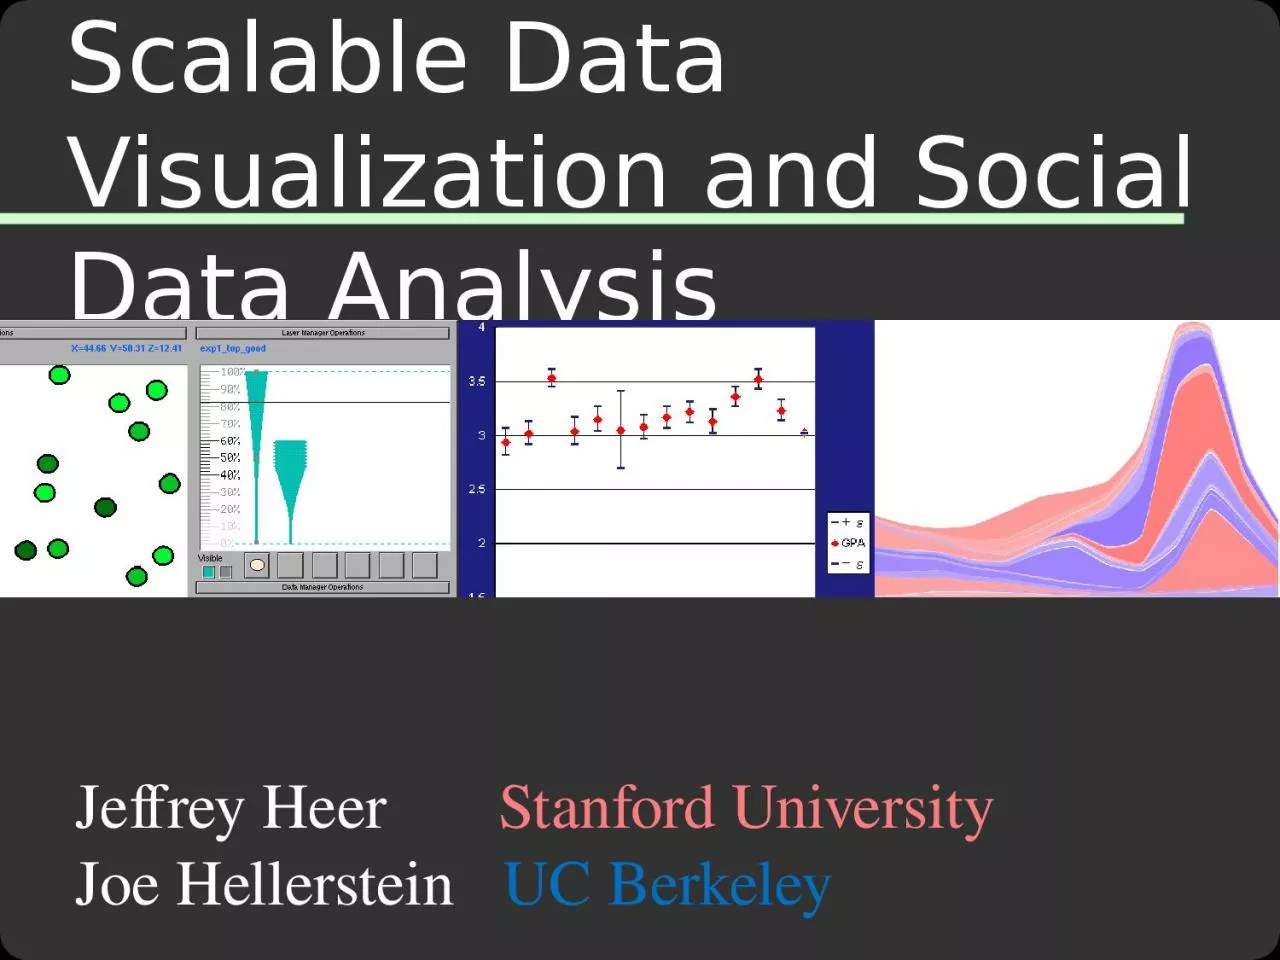
Jeffrey Heer Stanford University Joe Hellerstein UC Berkeley TexPoint fonts used in EMF Read the TexPoint manual before you delete this box A A A Visualization Reference
Download Presentation
"Scalable Data Visualization and Social Data Analysis" is the property of its rightful owner. Permission is granted to download and print materials on this website for personal, non-commercial use only, provided you retain all copyright notices. By downloading content from our website, you accept the terms of this agreement.
Presentation Transcript
Transcript not available.