/
United StatesDepartment ofAgriculture United StatesDepartment ofAgriculture

United StatesDepartment ofAgriculture - PDF document

winnie
winnie . @winnie
Follow
342 views
Uploaded On 2021-07-01

United StatesDepartment ofAgriculture - PPT Presentation

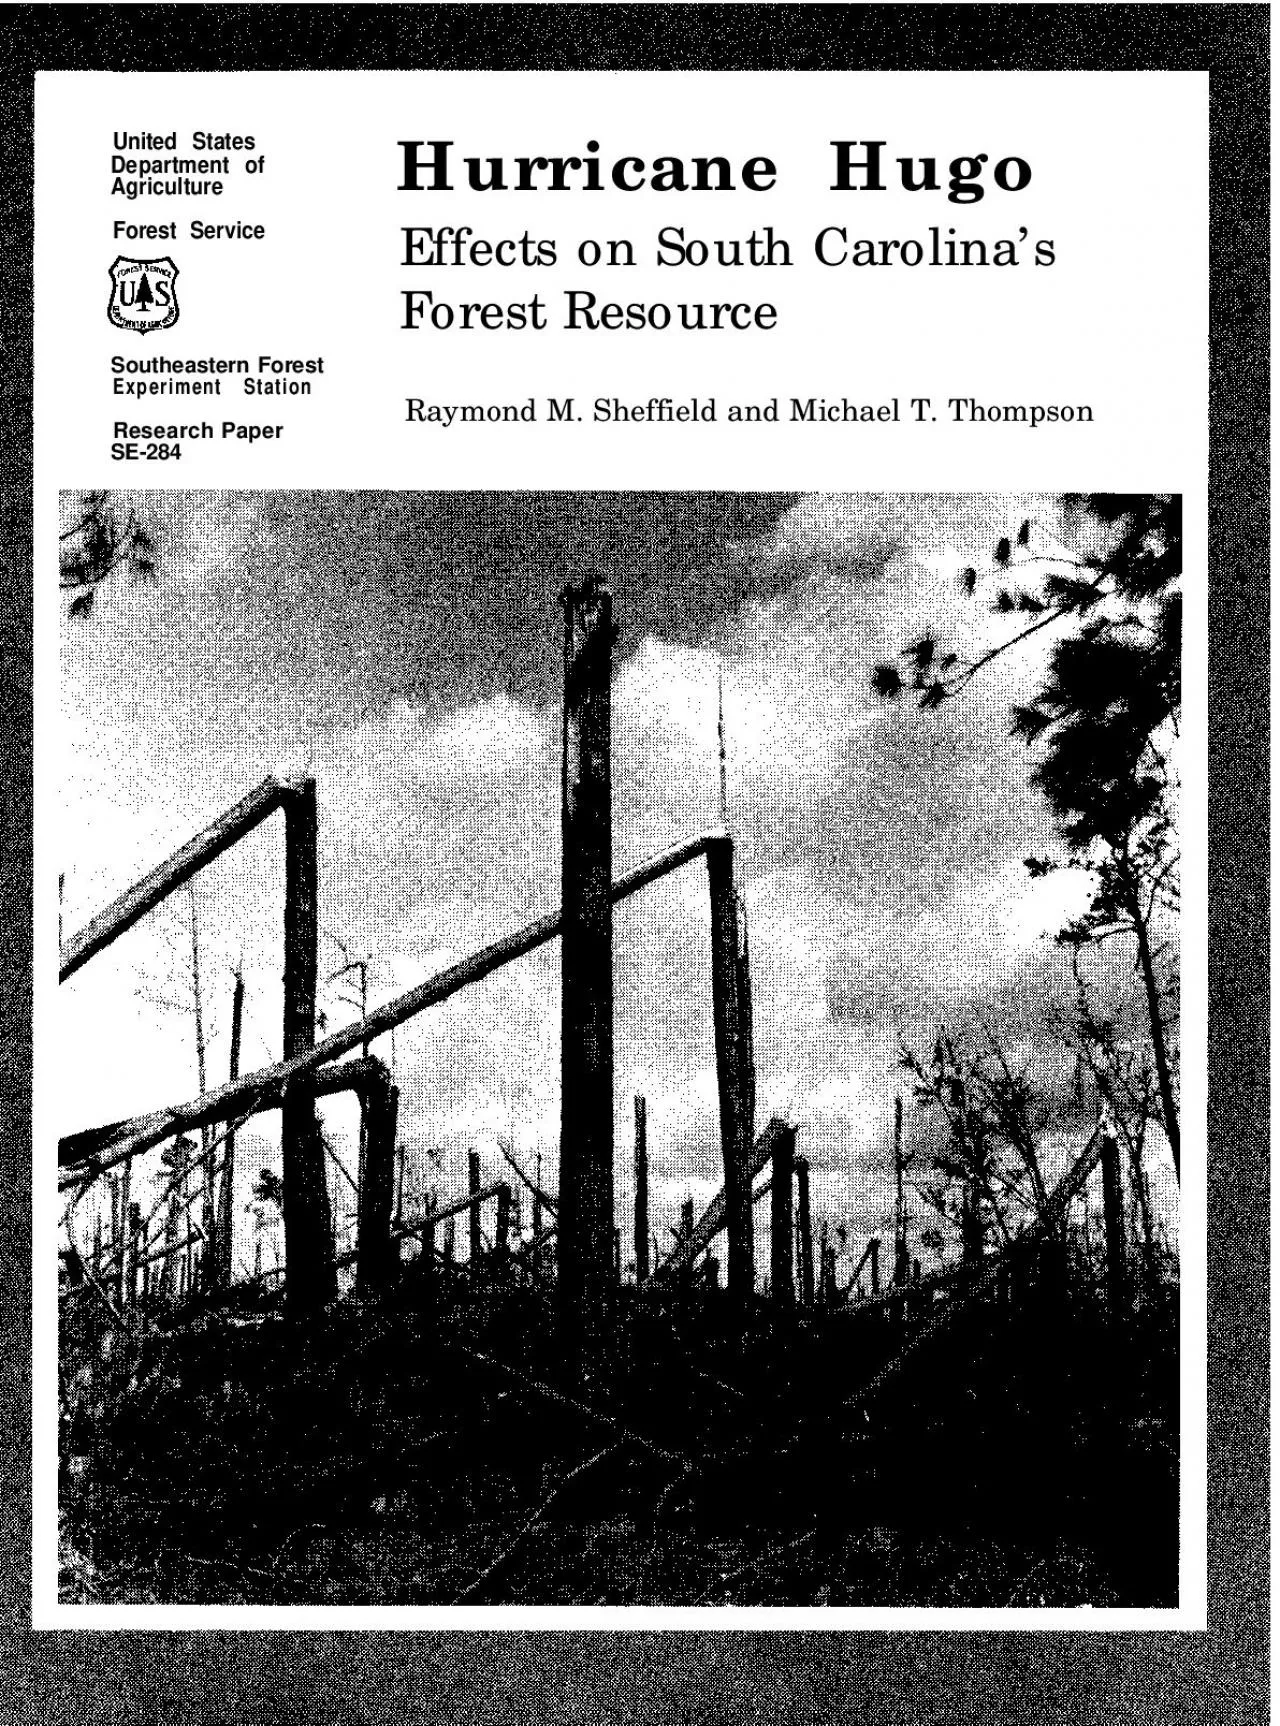
Hurricane Hugo Forest Service cl Effects on South Carolina146sForest ResourceSoutheastern Forest Experiment Station Research PaperSE284Raymond M Sheffield and Michael T Thompson June 1992Southea ID: 850551

inventory damage hugo loss damage inventory loss hugo class percent trees hurricane crown cubic stands feet softwood forest damaged

Share:

Link:

Embed:

Download Presentation from below link

Download Pdf The PPT/PDF document "United StatesDepartment ofAgriculture" is the property of its rightful owner. Permission is granted to download and print the materials on this web site for personal, non-commercial use only, and to display it on your personal computer provided you do not modify the materials and that you retain all copyright notices contained in the materials. By downloading content from our website, you accept the terms of this agreement.


Presentation Transcript

1 United StatesDepartment ofAgriculture Hu
United StatesDepartment ofAgriculture Hurricane Hugo Forest Service cl Effects on South Carolina’sForest ResourceSoutheastern Forest Experiment Station Research PaperSE-284Raymond M. Sheffield and Michael T. Thompson June 1992Southeastern Forest Experiment StationP.O. Box 2680Asheville, North Carolina 28802 Hurricane HugoEffects on South Carolina’sForest ResourceRaymond M. Sheffield, Resource AnalystandMichael T. Thompson, ForesterForest Inventory and AnalysisAsheville, North Carolina Contents Sampling Procedures........... Data Limitations............. Classification of Live-Tree Damages..... Affected Area and Volume......... More Than 4.5 Million Acres Damaged.... Softwood Inventory Reduced by 21 Percent . . 5Further Softwood Mortality Losses Likely. . 8Softwood Damage Summary........ Hardwood Inventory Reduced by 6 Percent . . 10Very Heavy Hardwood Damage....... Hardwood Damage Summary........ Stand Condition Assessment........ Regeneration Needs Soar.......... Future Timber Supplies Altered....... Literature Cited.............. Appendix A: Data-Collection Procedures . 21Appendix B: Procedures and Criteria forAssigning Trees With Hurricane Damageinto Damage

2 Risk Categories...... Appendix C: Detai
Risk Categories...... Appendix C: Detailed Tables....... IntroductionMet hodsOn September 21, 1989, Hurricane Hugo struck thecoast of South Carolina near Charleston with sustainedwinds of 135 miles per hour. The storm movednorthwest toward Rock Hill and exited the State withwinds still at or near hurricane strength. Hugo hassince been widely acknowledged as the greatest singleforest disaster in the State’s history.Aerial and ground surveys conducted by the SouthCarolina Forestry Commission identified 23 countieswith substantial forest damage. Damage estimatesfrom this aerial survey guided the salvage of damagedtimber, the establishment of fire control measures,and initial planning for reforestation. It was evident,however, that more comprehensive and objective dataon the damage to the forest resource were needed toassess changes in wood supply, plan for necessary woodprocurement shifts, and to guide long-term forestresource programs.The Forestry Commission requested that the ForestInventory and Analysis (FIA) Research Work Unit atthe Southeastern Forest Experiment Station conducta special inventory of the forest resource in thedamaged area. The previous full-scale

3 inventory ofSouth Carolina was complete
inventory ofSouth Carolina was completed in 1986 (Tansey andHutchins 1988). During the fall of 1989 and early 1990,objectives were established, field procedures developed,funds secured, and field crews assembled. Theobjectives of the inventory were to: (1) determine thevolume of hurricane-related mortality and damage, (2)assess damage to merchantable and submerchantablepine plantations, and (3) quantify needed standtreatments resulting from the storm.This report presents results, our interpretations, anddocuments the procedures used in the collection andanalysis of the data. Sampling Procedures The sample plots used in the Hugo inventory included2,530 permanent plots established in the 23 countiesduring the sixth survey of South Carolina in 1986(fig. 1). FIA sample plots are based upon a lo-pointcluster design. In most cases, five points are installedin a single forest condition using a basal area factorof 37.5 square feet per acre to sample trees 5.0 inchesd.b.h. and larger. Trees less than 5.0 inches d.b.h. aretallied on l/300-acre fixed plots at each of the pointcenters. More detailed information about standard FIAfield sampling procedures is available (Tansey andHu

4 tchins 1988; USDA Forest Service 1991).
tchins 1988; USDA Forest Service 1991). BetweenFebruary 1990 and June 1990, each of the 2,530 groundsamples was relocated and assessed for hurricane- andnonhurricane-related changes since 1986.In accordance with the objectives, sampling proceduresdiffered for natural and planted stands. In naturalstands, field crews accounted for each tree that was3.0 inches d.b.h. and larger in 1986. This procedureprovided assurance that any tree that had grown largeenough to have merchantable volume (5.0 inches d.b.h.and larger) would be evaluated. Each tree was assignedto one of six categories: (1) live, without hurricanedamage; (2) live, with hurricane damage; (3) dead,hurricane related; (4) dead, not hurricane related; (5)cut, not associated with the salvage of damaged stands;or (6) cut, associated with hurricane salvage or cleanupoperation, regardless of whether the tree was utilizedfor a product. Live trees with hurricane damage wereassessed for volume loss, percentage of crown missing,lean and bend, root damage, degree of damage to thetree bole, and salt burn. Data-collection procedures aredocumented in more detail in appendix A.In planted stands, data-collection procedures diff

5 eredfrom those in natural stands in two
eredfrom those in natural stands in two respects: (1) fieldcrews accounted for all trees that were l.O-inch d.b.h.and larger in 1986; and (2) planted pine trees that hadgrown from less than 1.0 inch d.b.h. to greater than1.0 inch and free-to-grow pine seedlings were tallied onl/300-acre fixed plots around each of the point centers.These data were necessary to assess current stockingand damage levels in young plantations. 1 . . -._.. 1’. Figure l-Distribution of 2,530 timberland sample locationsthat were remeasured and evaluated for hurricane damage.The collection of updated stand descriptive informationwas minimized. Items such as ownership, stand size,forest type, and stand age were not updated orreclassified. The use of these stand descriptors inthis report reflects classifications made in the sixthinventory in 1986. Current stand origin (planted ornatural) was noted. Field crews also recorded thetreatments and/or disturbances, including hurricanedamage, that had occurred in each stand since 1986.Finally, crews assessed treatment opportunities at eachplot-salvage cuts, regeneration, thinning, etc.-along Data Limitations Since procedures were designed to provide

6 datafocused on hurricane damage, many es
datafocused on hurricane damage, many estimates andclassifications were carried forward from the 1986inventory. Estimates of timberland area were notupdated for this inventory; thus, no change intimberland area is factored into the volume changeestimates. Forest type, ownership, stand size, and agewere not reestimated. The reader should be awarethat tables displaying these stand and area descriptorsmay differ somewhat from true conditions in 1990.For example, major land transactions since 1986 thatwould affect the acreage by ownership are not reflectedin tables or illustrations in this report. All displays ofage class or stand type portray 1986 conditions prior to any cutting, treatment, or hurricane disturbance.An exception was made when planting was noted on aplot. Then, the broad stand type was changed to pineplantation and a zero (0) age class was assigned.A complete assessment of current stocking andhurricane damage in very young natural stands washampered because no trees less than 3.0 inches d.b.h.were measured or sampled there in 1990. Field crewsdid assess treatment opportunities in these stands,reflecting the degree of damage inflicted. Classification of Live-

7 Tree Damages The inventory procedures we
Tree Damages The inventory procedures were designed to estimateinventory change in the selected counties and tomeaningfully describe damage to the existing inventory.The new inventory includes all merchantable trees thatwere alive at the time field crews visited each groundlocation. All types of significant damage to sampletrees were recorded to best describe the condition of a.re: Class l-High-risk tree with a high probability of dyingin the near future. Damage and value loss are severeenough that this tree should not be retained in thestand.Class 2-Moderate-risk tree with elevated risk of scenarios. Healthv-No obvious hurricane damage. A tree withhidden or internal damage would be included here.The damage/risk evaluation process placed trees intodiscrete categories. We recognize that, in reality,damaged trees belong on a continuum ranging from“not damaged” to “nearly dead.” Our process was understa.nding Hugo damage and will lead toimprovements in damage estimation techniques in thefuture.Affected Area and VolumeThis chapter summarizes our estimates of the amountand location of timberland that was significantlyaffected by Hurricane Hugo. It also p

8 rovides estimatesof the losses of softwo
rovides estimatesof the losses of softwood and hardwood timbervolumes. Additional data on damage are in appendixC.More Than 4.5 Million Acres DamagedThe reinventory indicates that 4.5 million acres, or Figure 2-A generalized distribution of timberland,in South Carolina damaged by Hurricane Hugo. Note: Not all stands in shaded areas’sustained damage,and damage occurred in unshaded areas. Timberland damage was most widespread near thecoast and on the northeast side of the hurricane’seye as it moved in a northwesterly direction. Figure2 shows the generalized distribution and extent ofhurricane damage in South Carolina. One should notconclude, however, that all stands in the area shownas damaged sustained damage or that damage doesnot exist in the unshaded areas. Representations ofdamaged timberland were created by drawing Thiessenpolygons (Newton and Bower 1990) around eachground location classed as having hurricane damage.Adjacent polygons depicting damage were merged intoa single polygon by deleting interior polygon lines.Undamaged timberland and nonforest plot locations areportrayed as undamaged on the map. Therefore, thehigher incidence of nonforest land in

9 the central portionof the State lends a
the central portionof the State lends an appearance of less damage therethan in the lower coastal plain or in the more heavilyforested areas to the north.Hurricane Hugo damaged more than 90 percent ofthe timberland in six counties-Berkeley, Clarendon,Florence, Lee, Sumter, and Williamsburg. Thedistribution of damage suggests that there probablywas damage in some counties not reinventoried, mostnotably Colleton and Lexington Counties. The damagein these counties was acknowledged prior to the fieldwork; they were omitted because of the limited extentof damage and increased data-collection effort required.4 Substantial hurricane damage was found in all standtypes and broad management types (app. table C.21).Sixty-two percent of the pine plantation acreage wasaffected, compared with 68 percent for natural pine andoak-pine stands, and 64 percent for upland hardwoodstands. Lowland hardwood stands sustained thehighest incidence of damage-77 percent. Lowlandhardwood stands often contain large, shallow-rootedtrees with large crowns, factors associated withincreased susceptibility to wind damage (Barry andothers 1982; Hook and others 1991). Across all standtypes, the damage inci

10 dence rate averaged 76 percentfor stands
dence rate averaged 76 percentfor stands classified as sawtimber size, 67 percent forpoletimber, and 59 percent for sapling-seedling.Timberland in public ownership was the most severelyaffected in terms of acres damaged-79 percent ofthe acreage controlled by public agencies sustainedsome hurricane damage (app. table C.21). Onefactor contributing to the high incidence is the large54 1 Billion cubic feetconcentration of National Forest in the most severelyaffected area near the coast in Berkeley and CharlestonCounties. Another reason for the high rate of damageon public land is that the older stands and larger treescharacteristic of public forests are more susceptible towind damage. Tall, large-diameter trees sustained moredamage than smaller trees. Forest industry land andnonindustrial private forest (NIPF) land were bothequally affected by the hurricane; 68 percent of theacreage in these two classes was affected. Softwood Inventory Reduced by 21 Percent Hurricane Hugo reduced the inventory of softwoodgrowing stock by 21 percent, from an estimated 4.8billion cubic feet that existed prior to the storm to 3.8billion cubic feet (fig. 3 and app. table C.l). Some 376million c

11 ubic feet of Hugo-damaged softwoods were
ubic feet of Hugo-damaged softwoods weresalvaged, and 632 million cubic feet were killed but notsalvaged. The extent and nature of damages to trees1986Regular Regular Pre-HugoHugoHugoinventory growthcutmortality inventory salvage mortality inventoryFigure 3-Change in volume of softwood growing stock, by component of change. that were not killed will be discussed later. Softwoodsawtimber volume declined from an estimated 19 billionboard feet to 14 billion board feet, a drop of more than25 percent (app. table C.3).Not all the volume classed as salvage was utilized forwood products. Our total includes all damaged treesthat were cut after the hurricane. Some of these treeswere cut in cleanup operations in which the stems werenot utilized, and some were cut but not utilized duringsalvage operations. The South Carolina Governor’sForest Disaster Salvage Council tracked actual salvagevolumes removed for product use and can provide finalstatistics.The pre-Hugo estimate of softwood inventory wasdeveloped by adding estimates of gross growth (1billion cubic feet) to the 4.8 billion cubic feet presentin 1986 and subtracting non-Hugo-related softwoodremovals (900 million cubic f

12 eet) and mortality (100million cubic fee
eet) and mortality (100million cubic feet). We are fairly certain that softwoodvolume changed little from 1986 until Hugo struck, butwe acknowledge that errors are associated with thecomputation. For instance, field crews encounteredsome difficulty in determining whether a tree was cutprior to the hurricane or whether it was removedduring a storm-related salvage operation. Also, somegrowth occurred between the time Hugo struck and thedate of plot measurement the next spring; this volumeincrement was assumed to be minimal. In establishingthe pre-Hugo inventory, all growth was assigned tothe period before the storm’s occurrence. To moreaccurately describe storm impacts in the text, all lossesand changes are related to the pre-Hugo inventoryrather than the 1986 inventory. This rule is not strictlyadhered to in the appendix tables, but the valuesreported and their bases for change are well defined inthe tables.Declines in softwood inventory were recorded in all 23counties, but declines were greatest in counties nearthe coast and along the path of the hurricane’s eye(fig. 4). More moderate losses occurred in countiesmore distant from the path. Six counties-Berkeley

13 (49 percent), Charleston (47 percent), C
(49 percent), Charleston (47 percent), Clarendon (45percent), Sumter (44 percent), Lancaster (35 percent),and Lee (34 percent)-lost more than one-third oftheir pre-Hugo softwood inventory. Berkeley andCharleston Counties alone accounted for 43 percent ofthe Hugo-related drop in softwood inventory.Declines in softwood inventory varied considerablyamong the major ownership categories (app. tablesC.7 and C.9). The most severe loss occurred on landcontrolled by public agencies. Volume of softwoodgrowing stock fell 34 percent to 451 million cubic feeton public land. Public land, which accounted foronly 14 percent of the pre-Hugo softwood inventory,sustained 23 percent of the softwood volume loss.More than one-third of the total softwood mortalitycaused by the hurricane occurred on publicly ownedtimberland-about 204 million cubic feet. The locationof National Forest land in the storm’s path and thelarger-than-average size of trees on this land explainthe heavy losses sustained there. The volume ofsoftwood growing stock dropped by only 12 percentto 907 million cubic feet on timberland controlledby forest industry. The percentage reduction wassmallest for this owner catego

14 ry. In this region a highproportion of f
ry. In this region a highproportion of forest industry holdings are in youngpine plantations. Of the 1.6 million acres of forestindustry timberland, about a fourth was in plantedpine stands under 20 years old in 1986. The smalltrees in the planted stands sustained considerablyless damage and mortality than larger trees in olderstands. Hugo-related salvage also was relatively smallon industry land. Forest industry land supplied only11 percent of all Hugo-related softwood growing-stockremovals. Softwood inventory held by NIPF ownerswas reduced by 21 percent from 3.1 to 2.4 billion cubicfeet. Million cubic feet tlal Figure 4-Pre- and post-Hugo softwood growing-stock inventories, by county. Billion cubic feet 2.5 - Pre-Hugo EZB 1990 inventory0 pineFigure 5-Pre- and post-Hugo softwood growing-stock inventories, by species.No yellow pine species was especially resistant tothe hurricane’s winds (fig. 5 and app. tables C.17and C.19). Loblolly pine inventory fell by 22 percentin the wake of Hugo to 2.5 billion cubic feet. By farthe most abundant species in the region, loblolly pineaccounted for 72 percent of the decline in softwoodinventory. Volume of longleaf pine

15 fell by 25 percent to303 million cubic
fell by 25 percent to303 million cubic feet. Slash and pond pine volumesdeclined by 27 and 29 percent to 146 and 180 millioncubic feet, respectively. Shortleaf pine experienced asmaller decline of 13 percent to 205 million cubic feet.However, shortleaf occurrence is concentrated in theareas away from the coast.Cypress survived the hurricane surprisingly well. Theinventory of cypress fell by only 3 percent to 355million cubic feet. Putz and Sharitz (1991) also foundthat cypress was able to withstand the hurricane’swinds better than most species in the CongareeSwamp.Softwood volume declined across the entire range ofdiameter classes (fig. 6 and app. tables C.13 andC.15). Volume declined by 8 percent in the 6-inchclass, by 11 percent in the 8-inch class, and by 16percent in the lo-inch class. Reductions ranging from22 to 32 percent were recorded in the larger diameterclasses. The high losses in the larger size classes showthat large pines were particularly susceptible to bolebreakage, windthrow, and subsequent mortality. Observations of damaged trees not killed by the stormsuggest that substantial additional softwood mortalityis likely in the next few years. Of the 3

16 .8 billion cubicfeet of softwood growing
.8 billion cubicfeet of softwood growing stock classified as live timber(post-Hugo inventory), 29 percent, or nearly 1.1 billioncubic feet, was damaged to some extent (app. tableC.5). Almost half of this damaged volume was in thelowest risk category-class 3. However, nearly 0.6billion cubic feet was in trees classed as moderate orhigh risk. No attempt will be made here to estimatethe additional mortality that is likely to occur. Therate of loss will depend on factors such as weather,insects, disease, and further salvage efforts. However,the potential for additional mortality of severalhundred thousand cubic feet is present.As with mortality, damage to live trees was greateston public forests (app. tables C.ll and C.12). Morethan 36 percent of the 1990 softwood inventory on a Million cubic feet800 1618 (d.b.h.1 class m Pre-Hugo EZEB 1990 inventoryFigure ~--PIT- and post-Hugo softwood growing-stock inventories,by diameter class.public land was damaged to some degree with severeand moderate damage (classes 1 and 2) present on 22percent of the post-Hugo softwood inventory. About36 percent of the post-Hugo softwood inventory onforest industry forests was damaged, but 19

17 percentwas in the class 3 or low-risk g
percentwas in the class 3 or low-risk group. Some 26 percentof the post-Hugo softwood volume on NIPF land wasSoftwood Damage SummaryDamage to softwood growing-stock (using the pre-Hugoinventory as a base) is summarized in figure 7. About8 percent of the pre-Hugo inventory was removedin salvage operations, and another 13 percent (0.6billion cubic feet) was dead at the time of plotdamaged; 6 percent was in the class 1 category, 8remeasurement. Hugo-related mortality will continue topercent in class 2, and 12 percent in class 3.accumulate for a number of years. Some 23 percentSal vaseHealth Class 1 Class 2Pre-Hugo inventory = 4.8 billion cubic feet30%Class 3 Figure 7-Summary of hurricane losses and damage to the pre-Hugo softwood inventory. of the softwood inventory before Hugo is in damagedliving trees. About 2.7 billion cubic feet, or only 56percent of the pre-Hugo inventory, was classed as“healthy,” or having no obvious storm-related damage.Thus, softwood inventory losses to Hurricane Hugorange somewhere between the 21 percent (1.0 billion ha.rdwood growing stock was present prior to Hugo, up from5.0 billion cubic feet in 1986. Ha.rdwood inventoryreducti

18 ons were attributed to 270 million cubic
ons were attributed to 270 million cubic feet ofHugo-related mortality and to only 49 million cubicfeet of salvage. These losses are small in comparisonwith softwood losses for two reasons. First, therewas little hardwood salvage cutting-most of theefforts to salvage dead and damaged timber focusedon pine species. Second, softwood species died morequickly after windthrow, bole breakage, or loss of limbs,whereas hardwood species were generally still alive. tha,t do notwill be degraded badly.Geographically, the distribution of hardwood volumeloss followed essentially the same pattern a.s forsoftwoods (fig. 9).The counties with the most severeBillion cubic feet 65 1 Regular Regular Pre-HugoHugoHugoinventory growth S-Change 10 Million cubicfeet Figure 9-I+- and post-Hugo hardwood growing-stock inventories, by county. declines in hardwood volume are near the coast andalong the path of the hurricane’s eye. Lee Countylost 34 percent of its hardwood inventory, whereasCharleston lost 16 percent, and Berkeley 14 percent.Among ownership classes, public land sustained themost severe reductions in hardwood volume (app.tables C.8 and C.10). The hardwood inventorycontrolle

19 d by public owners declined by 16 percen
d by public owners declined by 16 percentto 237 million cubic feet. That controlled by forestindustry decreased by 5 percent from less than 1.1to about 1.0 billion cubic feet. Hardwood inventoryon NIPF land dropped 6 percent from 3.8 to 3.6billion cubic feet-near the average for all ownership categories. Large hardwoods were the most prone toSeverely damaged hardwoods did not die as quicklyhurricane-related mortality (fig. 10 and app. tablesafter the storm as did softwoods. As a result,C.14 and C.16). The inventory of hardwoods 20 incheshardwood mortality understates the real terrible blowd.b.h. and larger dropped by 9 percent, whereasto the hardwood resource. That blow is expressedreductions were more modest for smaller trees.primarily in the figures for damaged, living trees.Million cubic feetVolumes of all major hardwood species in the regiondecreased (fig. 11 and app. tables C.18 and C.20). Red oaks suffered the most severe drop of 10‘percent to1.0 billion cubic feet. The sweetgum inventory declinedby 6 percent to 1.0 billion cubic feet. Volume of tupeloand blackgum-the predominant hardwood speciesgroup in the region-dropped 3 percent to 1.1 billioncubic

20 feet. Volume of all white oaks dropped
feet. Volume of all white oaks dropped 7 percentto 420 million cubic feet. The small loss of blackgum and tupelo relative to other hardwoods is consistentwith findings of a study in the Congaree Swamp (Putzand Sharitz 1991).Very Heavy Hardwood Damage 12uu 600 8101214 Diameter (d.b.h.1 class m Pre-Hugo B 1990 inventoryFigure lo-Pre- and post-Hugo hardwood growing-stock inventories, 12 Billion cubic feet0.80.60.4 oak Pre-Hugo m 1990 inventory Sweetgum Figure 11-Pre- and post-Hugo hardwood growing-stock inventories, by species. blackgum volume was damaged and most of thisvolume was in class 3 trees. About 304 million cubicfeet, or 29 percent, of the sweetgum volume wasdamaged; 40 percent of yellow-poplar volume wasdamaged; and 42 percent of the soft maple volume wasdamaged. Mortality Pre-Hugo inventory = 5.1 billion cubic feetFigure 12-S- my of hurricane losses and damage to the pre-Hugo hardwood inventory.Hardwood Damage SummaryStand Condition AssessmentThe fate of the pre-Hugo hardwood inventory isoutlined in figure 12. The volume present before thestorm was about 5.1 billion cubic feet. Only 5 percentof the pre-Hugo inventory, or 270 million cubic fe

21 et,was in trees that were killed outrigh
et,was in trees that were killed outright by the storm.Only 1 percent was removed in salvage operations.Almost 577 million cubic feet, or 11 percent, of thepre-Hugo inventory is now in class 1 trees. Another385 million cubic feet, or 8 percent, is in class 2 treesand some 577 million cubic feet is in class 3 trees.After subtracting out all Hugo-related damage, salvage,and mortality, about 3.3 billion cubic feet, or 64percent, of the pre-Hugo hardwood inventory remainsin an undamaged state.By any reasonable standard, the timber damage causedby Hurricane Hugo was catastrophic. But people areresilient, and they know that timber is a renewableresource. The people of South Carolina want to knowwhat must be done to get their forests back to normal.And while their forests are recovering, they wantto know what the effects on the timber industry willbe. Answers to those questions depend on accuratedescriptions of stand conditions before and after thestorm.Although the immediate loss of hardwoods to Hugowas relatively small (0.3 billion cubic feet of mortalityand salvage volume), the potential for additionalhardwood mortality and degrade is very high. Areasonable estimate of tota

22 l hardwood damage isabout 20 percent of
l hardwood damage isabout 20 percent of the pre-Hugo hardwood volume,or 1.0 billion cubic feet. While hardwood mortalitywill not likely escalate to this level, loss estimates ofthis magnitude are justified because of the value lossassociated with many of the wind-related damages.We estimated the stocking of manageable stand (crop)trees just prior to Hurricane Hugo by the methoddescribed below. The term “stocking” as used hererefers to the degree of occupancy of the land by treesas compared with a minimum standard required tofully utilize the growth potential of the land. Valuesused are expressed in percentage of full stocking.(1) Stocking of all tally trees on each plot wassummarized to establish the baseline stocking level ofeach plot at the time of the 1986 inventory. Only trees3.0 inches d.b.h. and larger in natural stands and 1.0inch in planted stands were tallied. Furthermore, onlytrees that were coded as being part of a manageablestand were considered; if a manageable stand did notexist in 1986, stocking of all growing-stock trees wassummarized. (2) Trees that were cut or died after the 1986to retain in the stand until the end of a rotation.inventory but

23 before Hugo were subtracted from theDif
before Hugo were subtracted from theDifferent minimum levels of pre- and post-Hugo1986 baseline stocking to establish the pre-Hugomanageable stand stocking were used for assessments ofcondition or stocking for the stand.regeneration needs and timber supply impacts.Trees killed by the storm or salvaged soon after are noproblem-they must be deducted to estimate currentstocking. Assessment of current stocking, however,requires some conjecture about how many of the treesdamaged by the storm will make satisfactory crop treesthrough the end of the timber rotation. Damage tolive trees ranges from relatively minor to major andlife threatening. Three different assumptions aboutdamaged trees were made: Regeneration Needs Soar 1. All damaged trees (risk classes 1, 2, and 3) areunsatisfactory for future stocking (maximum stockingreduction).2. Only class 1 and class 2 trees are unsatisfactory(average reduction).Previous assessments of regeneration treatmentopportunity have used 60-percent stocking as aminimum for determining whether a manageable standexists (Tansey and Hutchins 1988). In 1986, the23 counties reinventoried contained approximately1.0 million acres of timberland jud

24 ged to be in needof regeneration. In thi
ged to be in needof regeneration. In this analysis, we have used thesame standard for our baseline estimate of addedregeneration treatment opportunity. Stands that movedfrom greater than do-percent stocking with manageablestand trees to less than 60 percent were included in thesummary of additional acres needing regeneration. Pre- and post-Hugo stocking values different from these canalso be used to estimate regeneration needs, and anexample of this flexibility is demonstrated.3. Only class 1 trees are unsatisfactory (minimumreduction).Trees that were classed as acceptable in 1986 and werenot damaged by the storm, plus those trees with lightlevels of damage, were all considered to be acceptableDepending on which live-tree damages wereincluded as stocking reductions, the acreage reduced below a manageable stand using different stocking discomts, by broad management class, for 23 comties in South Carolina, 1986-1990 Broadmanagement areaStocking reduced below manageable levels using:Minimal Average Maximum Thousand acresPine plantation 1,208.7746.7118.5220.2329.7Natural pine 1,773.8 255.5332.9436.1Oak-pine832.4545.467.8105.5 Upland hardwood989.2634.7102.0119.0147.

25 9Lowland hardwood1.731.9 267.1379.5490.5
9Lowland hardwood1.731.9 267.1379.5490.5 All classes 6,536.0 810.9 reduction consists of Hugo mortality, Hugo salvage, and class 1 live-tree damage. b Stocking reduction consists of Hugo mortality, Hugo salvage, and classes 1 and 2 live-tree damage.'Stocking reduction consists of Hugo mortality, Hugo salvage, and classes 1, 2, and 3 live-tree damage. 15 were damaged severely enough to plac‘e them into aregeneration needs category. If all damaged trees areused as discounts (maximum discount), 1.5 millionacres shift into a poorly stocked category. Consideringthis range, the acreage needing regeneration in these 23counties has very likely more than doubled because ofhurricane-related damages.The average discount option probably yields the mostrealistic estimate of regeneration needs. Under themaximum discount, many acres are classed as poorly potental crop trees in these stands as comparedwith natural stands. In general, however, the timberexpectations of the owners of plantations probablyexceed the expectations of the owners of naturalstands.Other minimum levels of stocking for pre-Hugo andpost-Hugo conditions could be used to estimatethe acreages of regene

26 ration opportunities, Manystands that ar
ration opportunities, Manystands that are moderately stocked with acceptabletrees become more fully stocked as the trees growand as natural regeneration becomes established(Baker 1989). We did not attempt to conduct a morecomplete evaluation of regeneration needs. Decisionsabout acceptable stocking are predicated upon manyvariables, among them site quality, forest type,management objectives, rotation age, and the mix ofdamages of various degrees and types. However, we doprovide a detailed summary of acreage by stand typethat displays the pre-Hugo and post-Hugo stockingcategories (app. table C.22). Hugo stocking reductionsin this table are based upon the average discountoption discussed above.An example of how one might use different tilnberland by pre- and post-Hugo stocking percentage for manageable stand trees, for 23 camties in South Carolina, 19861990a Post-Hugo stocking (percent)stocking classeso-1415-2930-3940-4950-5960-6970-8485-99 Thousandacres15-29429.784.6345.130-39356.143.462.6250.140-49418.164.257.052.7244.250-59623.8 72.986.9315.460-69629.556.5 397.485-99716.859.825.524.468.2131.9323.1 1.166.389.545.441.226.2 All classes6,536.0 712.1587.9560.6546.1529.

27 7633.4449.8643.9 on trees 3.0 inches d.
7633.4449.8643.9 on trees 3.0 inches d.b.h. and larger in natural stands;all stems,including new planted stems, inplantations. levels of 60 percent or greater and post-Hugo stockingof less than 60 percent, are those presented in table 1 under average discount. An alternative assessmentof added regeneration opportunity created by Hugodamage is indicated by a summary of acreage below ( 3.0 inches d.b.h.)were not reinventoried and losses of them were not discounted. The extent to which natural regeneration will be ableto rehabilitate damaged stands cannot be assessedusing the Hugo inventory data. Plots were visited toosoon after the storm for natural regeneration to havebecome established. These assessments will be madein a few years during the next full-scale inventory ofSouth Carolina, scheduled for completion by 1993. Future Timber Supplies AlteredWe attempted to roughly assess the effects of theobserved damage to stands on the region’s futuretimber supplies. Our analysis did not include asophisticated projection model. Rather, we assignedeach sample stand to a damage class in a processsimilar to that used for the regeneration analysis.Three damage classes were

28 assigned: no damage, lightdamage, and m
assigned: no damage, lightdamage, and moderate/heavy damage. Stands thatwere harvested since 1986, but before the hurricanestruck, were identified and portrayed as a separatecategory. Magnitude of stocking reduction was theprimary consideration in placing each sample plot inone of the hurricane damage categories. The “nodamage” category was assigned based upon fieldcrew observation on the ground; this classification 5-year class, whereas natural stands were assigned to lo-year age classes. Legend Undamaged m Light 0 Moderate to heavy 0 Harvested (1986-90)More than 261,000 acres out of 1.2 million acres of as moderately to heavily damaged (fig. 13a). On theseareas, Hugo reduced manageable stand stocking by 70percent based on the average stocking-reduction criteriadiscussed previously. These stands were left with anaverage stocking of healthy and class 3 damaged treesof only 28 percent of full stocking. Almost one-third ofthe nonharvested plantations age 15 and above wereclassed as moderately to heavily damaged.Another 475,000 acres (39 percent of all plantations)were classed as lightly damaged. In these stands, Hugoreduced pre-Hugo stocking by an average

29 of 16 percent.However, stocking of healt
of 16 percent.However, stocking of healthy and class 3 damaged treesin these stands averaged 81 percent of full stocking-anadequate amount for long-term development ofacceptable trees. Pine plantations established since1986 (age class 0) and those in age classes 5 and 10account for almost four-fifths of the undamaged pineplantations.About 400,000 acres of stands classed as naturalpine in 1986, and not subsequently harvested, weremoderately to heavily damaged (fig. 13b). Thisacreage represents 25 percent of all nonharvestednatural pine stands. The hurricane reduced manageablestand stocking for this group by 77 percent, leaving 13~). Altogether, some 582,000 acres ofFigure 13-Stand-age profiles for pine plantations,natural pine stands, and oak-pine/hardHood stands,by degree of hurricane damage.(a) Pine plantationsAge class (years) 38+ 28-3223-2718-2213-17 81+ 61-7051-6041-5031-4011-20 300400500600700Thousand acres(c) Oak-pine/hardwoodAge class (years) 81+ 61-7051-6041-5011-20300400500600 Thousand acres hardwood-dominated timberland were so classified.These severely damaged stands were concentrated inthe 41-50 and older age classes. Almost 29 percentof hardwood and oa

30 k-pine stands past age 40 weremoderately
k-pine stands past age 40 weremoderately to heavily damaged. Only 7 percent ofstands less than 40 years old were placed in thatcategory. In moderately to heavily damaged hardwoodand oak-pine stands, Hugo reduced stocking by anaverage 66 percent. The residual stands (comprised ofhealthy and class 3 damaged trees) averaged only 26percent of full stocking.More than one-half (1.8 million acres) of oak-pineand hardwood stands were lightly damaged. Thehurricane reduced manageable stand stocking there by15 percent. The remaining 1.0 million acres did notsustain any hurricane damage. Oak-pine and hardwoodforests that were not damaged or were lightly damagedwere distributed across all age classes, but they weremore highly concentrated in the younger age classes.Geographically, forest stands with moderate to heavydamage were distributed in a similar fashion to thevolume-loss distributions shown earlier (fig. 14).Moderately to heavily damaged stands are concentratednear the coast and to the northeast side of thehurricane’s path.Light damageModerate/heavy damageFigure 14-A generalized distribution of timberland in South Carolinadamaged by Hurricane Hugo, by degree of damage. 1

31 9 From a timber supply standpoint, Hurri
9 From a timber supply standpoint, Hurricane Hugo hadan immediate impact by damaging old, high-volumestands more severely than young, low-volume stands.The age structure of the forests was instantly skewedtoward more younger stands. The hurricane alsoreduced the stocking of residual trees on relatively largeareas to a level that requires the establishment of anew, vigorous stand to restore long-term productivity.Regenerating new stands over large areas throughplanting and natural means will further tilt the age understocked loblolly-shortleafpine stands. Southern Journal of Applied Forestry 13(3): 132-139.Barry, Patrick J.; Anderson, Robert L.; Swain, KennethM. 1982. How to evaluate and manage storm-damagedforest areas. For. Rep. SA-FR 20. Atlanta, GA: U.S.Department of Agriculture, Forest Service, Forest PestManagement. 15 pp.Brewer, Conrad W.; Linnartz, Norwin 2 PP.Hook, Donal D.; Buford, Marilyn A.; Williams, Thomas M. Spec. Issue 8: 291-300.Newton, M.; Bower, Steven T. 1990. Spatialanalysis of forest inventory data. In: LaBau, VernonJ.; Cunia, Tiberius, tech. eds. State-of-the-artmethodology of forest inventory: a symposiumproceedings; 1989 July 30-August

32 5; Syracuse, NY. Gen.Tech. Rep. PNW-GTR
5; Syracuse, NY. Gen.Tech. Rep. PNW-GTR-263. Portland, OR: U.S. Department Appendix A: Data-Collection ProceduresIn the 23 damaged counties, field crews relocated2,530 permanent sample plots that were established intimberland in previous inventories. At each sample,crews recorded information about the condition of thestand, noting any treatments or disturbances thathad occurred since the previous inventory in 1986. Inaddition, each stand was visually assessed for evidenceof hurricane damage of any severity. Land use changes,windthrow orientation, and a description of the potentialfor natural pine regeneration were also recorded. d.b.h. to 1.0 inch or larger and allpine seedlings that were considered part of a manageablestand were tallied on l/300-acre fixed plots at each ofthe five sample point centers. These “new” pine tallytrees were also assessed for hurricane damage.Past disturbance. Any significant natural orhuman-caused disturbance such as disease, insects, orprescribed fire that occurred after the 1986 survey wasidentified (not including hurricane damage).Treatment opportunity. At each sample location, fieldcrews determined what treatments, if any, we

33 re neededto improve existing conditions
re neededto improve existing conditions in the stand. Possiblerecommendations included salvage, harvest, thinning,other stand improvement cuttings, stand conversion, ft2/acre), orstands that did not have an adequate seed source.Nonforest plot (Ontional Item 1). This item identifiedthose samples that were cleared to a nonforest land usesince 1986.Throw orientation (Ontional Item 2). Field crews, usingstandard FIA codes for aspect description, coded thepredominant orientation of down or leaning trees on thesample acre.Tree VariablesStand Condition VariablesThe following items were recorded for each sample:Stand origin. This code identified stands that hadevidence of planting or seeding.Hurricane damage. This code specified whether or not history. Species. A three-digit standard FIA species code wasassigned to each tree tallied. 21 Old d.b.h. The d.b.h. assigned in the 1986 survey wastransferred to the tally sheet used in the Hugo inventory.Tree class. A tree class code was assigned to each livetree tallied using FIA merchantability standards. Treeclass was not changed from that coded in the 1986survey unless it changed as a result of hurricane-inflicteddamage.Cubic-volu

34 me loss. An estimate of the percentage o
me loss. An estimate of the percentage of thetree’s merchantable volume missing because of hurricanedamage.Percentage of crown missing. An estimate ofthe percentage of live-tree crown lost because ofhurricane-related damage. The crown ratio code notedin the 1986 survey was used as a base for making thisdetermination.Terminal leader missing. The absence of the tree’sterminal leader was recorded if the breakage was causedby the storm.Bole condition. Any damage to the bole of the tree wascoded if the damage was caused by the hurricane. On apriority basis, injuries were coded as: (0) no damage, (1)split or twisted bole, (2) debris driven into tree, and (3)tree bole skinned through cambium.Tree lean. The angle of lean was recorded for each livetree. Lean was defined as the degree from which the first 1Zfoot section of the tree varied from the vertical axis.A code of “00” was recorded for a tree with no deviationfrom vertical axis associated with hurricane winds. Acode of “90” was used to describe a live tree lying on theground.Tree bend. Tree bend was coded in the same manner astree lean except it was measured from the ground to thetip of t

35 he tree.Distance to breakage. If the bol
he tree.Distance to breakage. If the bole of a tree was brokendue to wind damage, the distance in feet from the l-footstump to the point of breakage was recorded.Root damage. The field crews looked for any evidencethat the tree’s root system had been damaged by thestorm. Root injuries were recorded as: (1) no rootdamage, (2) roots exposed (root sprung), and (3) rootdamage below ground.Cut-mortaiitv period. For each tree tallied that hadeither died or was cut before the hurricane (tree history6 or 8), a code was assigned to describe when themortality or removal occurred. If the mortality orremoval occurred within the past year, a 1 was recorded;2 years ago, a 2 was recorded.Field crews assigned a code to indicate theSalt burn.presence of crown damage from airborne saltwater spray.The brown or red foliage associated with this damagewas treated as missing crown. 22 HUGO DAMAGE ASSESSMENT SURVEYDecember 1989 Field Notes . &I E DAMA c -4 i :: :: ma s.5 dG k" mo x xxx xxx x xx xx x x POTENTIAL NATUF x xx PINE REGENERATI Adequate existir 2 Pine seed sourceexists (favorabl . 3 Pine seed sourceexists (site prc a Pine seed sourcedoes not exi

36 st TREE HISTORY 2 Pine ingrowth (plant
st TREE HISTORY 2 Pine ingrowth (plantation onl:3 Live tree damage4 - Hurricane mortal 6 Mortality before hurricane Cut not associat with salvage o- Tree removed asresult of storm TERM. LDR. MISS 0 No 1 - Yes BOLE CONDITION 0 No damage 1 Splits and/or tb Debris driven ir: tree 3 Tree skinned thr cambium 0 No root damage 1 Roots exposed 2 Damage below grc CUT/MORT. PERK 1 - 1 year 7 2- 2 years(etc.) 23 24 Appendix B: Procedures and Criteria forAssigning Trees With Hurricane Damageinto Damage Risk CategoriesThe 1990 inventory includes all trees that were aliveat the time field crews visited each sample location.Several kinds of damage were tallied during the Hugoinventory, and they can occur singly or in multiplesin any combination. This appendix documentsthe procedures and criteria used to assign trees tocategories of damage that reflect the tree’s risk of dyingor its present or potential value loss. Damage/Risk Class Definition The damage/risk classes utilized are defined below.The terms “class 1,” “class 2,” and “class 3” are usedinstead of descriptive adjectives such as “severe,”“moderate,&#

37 148; or “light” so that users
148; or “light” so that users will review the 1 High-risk trees with a high probability ofmortality in the near future. Damage is sosevere that retention in the stand until theend of a rotation is not feasible.2Moderate-risk trees with an elevated risk ofdying soon. Death is not as “imminent”as in class 1. Damage significantly degradespresent or potential value, especially forhigh-value uses such as saw logs and veneerlogs. Tree growth is likely to be reduced fora number of years due to damages such asloss of crown or root damage. Retention inthe stand is questionable and depends ontree and stand age, product objectives, etc.3Low-risk trees with a high probabilityof survival. Damage elevates the risk ofmortality, but reduced growth and valuedegrade will probably be minimal.4Trees without obvious hurricane damage. Criteria and Evaluation Procedure Criteria for assigning trees to damage/risk classes are stands- l Saplings (1.0-4.9 inches)l Poletimber (5.0-8.9 inches)l Sawtimber (9.0 inches & larger)Hardwood species in all stands-* Saplings (1.0-4.9 inches)l Poletimber (5.0-10.9 inches)l Sawtimber (11.0 inches & larger)The following procedure was

38 used to make the 25 Table B-l--Danrage
used to make the 25 Table B-l--Danrage/risk class criteria for softwood species in pine plantationsless than 5 years old Damage/riskclassPrimary conditionAssociated condition 4 (healthy) No obvious damage 1 Crown loss L 60 degreesSalt burn presentVolume loss (residual trees) 2 30% Crown loss 40-74%Lean/bend 15-59 degreesSalt burn presentVolume loss (residual trees) l-39%Root damage below groundSkinned bole/other bole damageLean/bend I-14 degreesVolume loss (residual trees) l-9%Crown loss 2 30% 26 Table B-2--Dmage/risk class criteria for softwood species in pine plantations S-20 years old Damage/riskclassPrimary conditionAssociated condition 4 (healthy) No obvious damage Crown loss 2 75%Root sprungSplit/twisted boleLean/bend 145 degreesSalt burn present 2 30%Crown loss 40-74%Lean/bend 15-44 degreesSplit/twisted boleSkinned bole/other bole damageSalt burn present 5-29%Crown loss l-39%Root damage below groundSkinned bole/other bole damageLean/bend 1-14 degreesVolume loss l-4%Crown loss 2 50%Crown loss E 30%Crown loss 50%Crown loss 1 25%Crown loss 30%Crown loss 25% 27 Table B.3--Dmage/risk class criteria for softwood species in pine plantat

39 ionsgreater than 20 years old Damage/r
ionsgreater than 20 years old Damage/riskclassPrimary conditionAssociated condition23Crown loss 40-74%Lean/bend 15-34 degreesSplit/twisted bole Sk bole/other bole damage Sa burn present S-29%Crown loss 2 50%Crown loss 2 30% No obvious damage 1 Crown loss z 75%Root sprungSplit/twisted boleLean/bend 2 35 degreesSalt burn presentVolume loss l-39%Root damage below groundSkinned bole/other bole damageLean/bend 1-14 degreesTerminal leader broken outVolume loss l-4%Crown loss 50%Crown loss 1 25%Crown loss 30%Crown loss 25% 28 Table B-4--Damge/risk class criteria for softwood saplings (1.0-4.9 inches d-b-h.) in natural stands Damage/risk Primary conditionAssociated condition 4 (healthy) No obvious damage 1 loss 2 Crown loss 2 50 % Root sprungSplit/twisted bole Salt burn present Lean/bend 2 45 degrees Crown loss 40-7496 Crown loss 25-49%Split/twisted boleSkinned bole/other bole damage Salt burn present Terminal leader broken out Crown loss l-39% Crown loss Root damage below groundSkinned bole/other bole damageLean/bend 1-14 degrees Dominant/codominant treesIntermediate/suppressed trees Crown loss 2 50%Crown loss 2 Dominant/codominant treesInt

40 ermediate/suppressed treesCrown loss
ermediate/suppressed treesCrown loss 50% Crown loss Crown loss 30% Dominant/codominant treesIntermediate/suppressed trees Crown loss 25% Table B-S--Damage/risk class criteria for softwood pletiRlber (S-O-8.9 inches d.b.h.) in natural stands Damage/riskclassPrimary conditionAssociated condition 2 loss 40-74% loss 25-49% Split/twisted bole Skinned bole/other bole damageLean/bend 15-44 degrees Salt burn presentVolume loss 5-29% Terminal leader broken out3 loss l-39% loss l-25% Root damage below groundSkinned bole/other bole damageLean/bend 1-14 degrees Volume loss l-4% 4 (healthy) No obvious damage 1 Crown loss 2 75%Crown loss 1 50%Root sprungSplit/twisted boleLean/bend 1 45 degreesSalt burn present Volume loss 2 30% Dominant/codominant treesIntermediate/suppressed trees Crown loss 2 50%Crown loss 1 30% Dominant/codominant treesIntermediate/suppressed trees Crown loss 50%Crown loss 1 25%Crown loss c 30% Dominant/codominant treesIntermediate/suppressed trees Crown loss 25% 30 Table B.6--Dmage/risk class criteria for softwood sawtirrber (9.0 inches d.b.h. Damage/risk Primary conditionAssociated condition 4 (healthy) No obvious

41 damage 1 loss 2 75%Crown loss 2 50 %
damage 1 loss 2 75%Crown loss 2 50 % Root sprungSplit/twisted boleLean/bend 135 degreesSalt burn present Volume loss z 30%Crown loss 40-74% loss 25-49% Split/twisted boleSkinned bole/other bole damageLean/bend 15-34 degrees Salt burn present Volume loss 5-29% Crown loss l-39%Crown loss l-25%Root damage below groundSkinned bole/other bole damageLean/bend 1-14 degrees l-496 treesIntermediate/suppressed trees Crown loss 2 50%Crown loss E 30% Dominant/codominant treesIntermediate/suppressed treesCrown loss 50%Crown loss 2 25% Crown loss 30% Dominant/codominant treesIntermediate/suppressed trees Crown loss 25% Table B-7--Dmage/risk class criteria for hardmod d-b-h.) 4 (healthy) No obvious damage 1 loss 1 90% Root sprungSplit/twisted bole Lean/bend 1 75 degrees 2 Lean/bend 2 45 degrees Crown loss 1 75% Crown loss 45-89%Split/twisted boleCrown Loss 75%Skinned bole/other bole damageLean/bend 15-74 degrees Crown loss l-44% Root damage below groundLean/bend 1-14 degreesTerminal leader broken out 32 Table B.8--Damage/risk class criteria for hardwood poleti&er (5.0-10.9 inches d-b-h,) classPrimary conditionAssociated condition 4 (heal t

42 hy) No obvious damage Crown loss 2 90%R
hy) No obvious damage Crown loss 2 90%Root sprungSplit/twisted boleLean/bend 1 60 degreesVolume loss 2 30%Crown loss 45-89%Root sprungSplit/twisted boleSkinned bole/other bole damageLean/bend 15-59 degreesVolume loss 5-29%Lean/bend 2 35 degreesCrown loss 2 75%, orBole breakage in lower 20 ftLean/bend c 35 degreesCrown loss x 75%, l-44%Root damage below groundLean/bend 1-14 degreesTerminal leader broken outVolume loss Table B.9--Damage/risk class criteria for harduood sawtimber (11.0 inches 4b.h. and larger) Damage/risk Primary conditionAssociated condition 4 No obvious damageCrown loss 1 90%Root sprungSplit/twisted boleLean/bend 2 45 degrees Volume loss 2 30% Crown loss 45-89%Root sprungSplit/twisted boleSkinned bole/other bole damageLean/bend 15-44 degrees Volume loss 5-29% 3 loss l-44%Root damage below groundLean/bend 1-14 degreesTerminal leader broken out Volume loss Lean/bend L 25 degrees Crown loss 1. Bole breakage in lower 20 ft Lean/bend 25 degrees Crown loss or Bole breakage above lower 20 ft 34 Appendix C:Detailed TablesTable C-l--Period change in volune of softwood growing stock on timberland, by county and conpo

43 nent of change,for 23 counties in South
nent of change,for 23 counties in South Carolina, 1986-1990 1986GrossRegularHugo HugoNet1990inventorygrowthmortalitymortalitygrowthremovalsremovalschangeinventory BerkeleyCalhounFairfieldFlorenceGeorgetownHorryKershawLancasterLeeMarion SumterTotal542,202119,407305,111223,223206,712138,435102,75996,508226,376286,611242,192285,312185,948158,75885,669158,47392,880211,080161,380146,349271,340109,04022,23543,41458,45150,99020,49215,90331,31690,99542,47954,22367,95842,86416,70727,00638,53835,32726,15749,5816,850 5,9674,6219953882,7814,58511,6135,2085,6944,0643,5195,3086323,262 9,96013,96135,40312,6034,858 1,34036,54541,344-239,128303,074-28,02391,384-141,480163,631-2,666220,557460207,172-61,733 981,50197,002632,089252,410914,705 NG = GG - NC q NG - = I86 + NCPre-Hugo inventory = Table C-Z--Period change in volme of hardwood growing stock on timberland, by and conponent of change,for 23 counties in South Carolins, 1986-1990 1986GrossRegularHugoNetRegularNet1990inventoryHugogrowthmortalitymortalitygrowthremovalsremovalschange BerkeleyCalhounCharlestonChesterChesterfieldClarendonHorryKershawLancasterMarionMarlboro SumterWilliamsburgYorkTotal327,87640,76092,800

44 12,516200,92828,375137,30027,138185,2783
12,516200,92828,375137,30027,138185,27830,261230,43028,114109,08420,115154,59825,581279,75239,117156,52129,059243,87438,520241,57333,970438,32562,908139,30323,356145,24627,42493,00014,129278,06741,113185,82531,881399,40460,739208,57733,048240,32025,611341,21944,9452,1542,76210,945 1,491 8,3499763,6606,473Thousand cubic feet43,800-5,19417,4321,3528,4027,47833,279 24,0256,45718,98623,97323,2171,75636,6085,2239,31411,56082919,56614,03826,98310,01349,8581,56223,94418,9553,57629,70128,42715,79415,60116,1465,57646,38729,4324,81016,7256,8217,06518,86820,10924,936-12,9799063,58529,17935,2781,25523,5507,39625,61327,44267,927 31,80718,5363,41532,79411,16527,30732,3234,507 7892,5326,3041,107 5,0971,78210,144 7,604-27,133300,74392493,724-13,327187,601-3,795133,505-7,519177,759-41,156189,274-3,353105,7315,528160,126-43,013236,7394,989161,510-1,194242,680 16,411454,7364,807144,110-3,023142,223-24,02968,971-6,099271,96816,154201,979-40,485358,919 -30,487209,833-12,620328,599172,96337.5393,4755,75228,31214.848 186,427 NG q GG - NC = = Ig6 + NCPre-Hugo inventory = I86 Table C-3--Period change in volume of softwood sautintw on timberland, by comty and of change,for 23 coun

45 ties in South Carolina, 1986-1990 county
ties in South Carolina, 1986-1990 county GrossRegularHugoNetRegularHugoNet1990inventorygrowthmortalitymortalitygrowthremovalsremovalschangeinventory Berkeley Calhoun467,356Charleston Chester732,457Chesterfield737,529ClarendonDarlingtonFairfieldFlorenceGeorgetownHorryKershawLancasterLeeMarlboroOrangeburg SumterWilliamsburgYorkTotal645,232503,643434,423981,052944,5911‘081,686 599,675460,865329,786738,661284,079821,700 457,920103,953240,403238,739106,84484,72597,447171,850333,560219,601243,088357,104159,297163,45779,405132,876109,509173,864239,31224,755 10,08710,8695,225 12,73638,30212,18917,88719,6914,76315,17717,3478,46714,70116,59811,0464,49917,293Thousand board feet 1,056,557-623,392206,82491,698 52,59822,726114,59458,60531,247 5,610166,000210,728 955,235-135,816331,540-720,319721,51118,590751,047-32,823704,706-328,826316,406-86,328417,31517,432451,855-241,094739,95832,352976,943-324,997756,689-230,080871,509-20,428 -217,534382,141-223,614237,251-112,360217,426-97,714640,94769,325353,404-220,558601,142-62,291551,740-288,389300,913-301,204849,779476,528185,89010,20015,646160,044144.6727,4197,953484.481 307,202 938,784 NG q GG - NC = NC - = I86 + NCPre-Hugo inv

46 entory q I86 Table C.4--Period change
entory q I86 Table C.4--Period change in volune of hardwood sautinber on tintxrland, by comty and cosponent of change,for 23 counties in South Carolina, 1986-1990 County1986GrossRegularHugoNetRegularHugoNet1990inventorygrowthmortalitymortalitygrowthremovalsremovalschangeinventory BerkeleyCalhounCharlestonOarlingtonDillonFairfieldFlorenceGeorgetownHorryLancaster MarlboroOrangeburg SumterWilliamsburgTotal 136,0931,778272,26247,9838,944580,53298,2858,504347,99474,01622,747563,124102,5958,995731,638111,1835,805330,96345,28120,080452,45487,92310,011856,940120,2405,823396,36697,93111,014833,389144,03616,968766,458122,0493,606 230,95837,015386,77674,6871,845316,75160,1012,613287,54840,51211,089910,854148,09728,013520,285108,55926,789 192,05617,905667,731121,9993,913832,963106,0706,869 156,55620,462Thousand board feet148,9196,717135,829 80,82024,2824,606102,6417,50818,62152,25317,7069,65011,51297,25216,0624,69376,142 44,165-14,60462,80732,32210,276-46,0486,56351,26987,83072,853104,54424,558124,59491934,28473,30625,21211,776171,30279,40967,804108,447101,37066,190 24,3184,398 10,2885,80835,931 24,755-95,027923,74922,046294,308-54,970525,562-36,561311,433-38,272524,85

47 2-124,354607,284-37,763293,20048,094500,
2-124,354607,284-37,763293,20048,094500,548-176,580680,36011,605407,971-4,329829,06024,748791,20668,557 37,551424,327-19,533297,218-106,065181,483-29,370881,48441,191561,476-107,596947,096-2,140665,591-105,079727,884-29,182 106,14010,97021,24873,92253,04420,878383,254 291,758 164,023 NG = GG - Mr - Mh NC = NG - = I86 + NCPre-Hugo inventory q I86 + GG - Mr - TRr Table C.5--Distribution of 1990 inventory of graving comty, species grog, and dmage class,for 23 comties in South Carolina CountySoftwoodshardwoodsPercentage of inventory in--Percentage of inventory in--19901990Inventory Healthy Class 3 Class 2 Class 1 Inventory Healthy Class 3 Class 2 Class 1treestreestreestreestreestreestreesBerkeleyCalhounCharlestonFairfieldFlorenceGeorgetownHorryKershawLancasterLeeMarionMarlboro SumterWilliamsburgYorkThousandcubic feet303,07491,384163,631220,55776,70284,70094,657165,549 9797 54739295859328 --24--732721 2--11 79 2 2 cubic feet300,74393,724187,601133,505177,759105,731160,126236,739161,510242,680241,028454,736144,110142,22368,971271,968201,979358,919 21 1717 399 100--155 4 11 1314224 146 Percent Table Lb--Distribution of 1990 inventory of sautintw,

48 by county, species group, and damag
by county, species group, and damage class,for 23 comties in South Carolins SoftwoodsHardwoodsPercentage of inventory in--Percentage of inventory in--19901990 Inventory Healthy Class 3 Class 2 Class 1Inventory Healthy Class 3 Class 2 Class 1 treestreestreestreestreestreestreestreesBerkeleyCalhounCharlestonChesterChesterfield SumterYorkTotalThousandboard feet 955,235 32331,540 98721,511 63751,047 98704,706 69 316,406 , 35 417,315 97 451,855 739,958 72 976,943 756,689 53871,509 60 1,664,517 60382,141 79237,251 78217,426 77640,947 94353,404 94601,142 88551,740 90300,913 47849,779 39 Percent 9-- 22--11 914 22 2122-- 243 11 56 4 12 484.481 86 3 383,254 88 8 72 146 63 13 2 8 8 2 1 10 board feet923,749294,308525,562311,433 424,327297,218181,483881,484561,476 97 905859 4934 17182022 Table C.7--Period change in volme of softwood growing stock on timberland, by coqxment of change and omership class, for 23 comties in South Carolina. 1986-1990 Inventory item All OtherForestFarmerMiscellaneousownershipsforestpublicindustryprivateThousand cubic feet1986 Inventory (I86) 354,368281,936 Gross growth (GG)981,50157,92259,914265,970226,911370,784Regular mortality

49 (M,)97,0026,5096,11819,66228,59036,123H
(M,)97,0026,5096,11819,66228,59036,123Hugo mortality (Mh)632,089167,70736,39587,696131,121209,170Net growth (NG)252,410-116,29417,401158,61267,200125,491Regular removals (TR,)914,70530,36028,844291,625222,433341,443Hugo removals (TRh)375,71311,10715,88140,317107,038201,370Net change (NC) -1,038,008-157,761-27,324-173,330-262,271-417,3221990 Inventory (too) 196,607254,612907,363957,789 NG = GG - NC = NG - = I86 + NCPre-Hugo inventory q Ig6 voluse of hardwood growing stock an timberland, by conpamnt of changeand ounership class, for 23 comties in South Carolina, 1986-1990 Inventory item All OtherForestMiscellaneousownershipsforestpublicindustryFarmerprivateThousand cubic feet1986 Inventory (Ig6) 184,89286,205 Gross growth (GG)756,21924,68915,901151,846238,050325,733Regular mortality (M,)99,9512,9881,71821,17138,82035,254Hugo mortality (Mh)270,36537,2496,31347,49075,647103,666Net growth (NG)385,903-15,5487,87083,185123,583186,813Regular removals (TR,)532,13719,9256,598158,503135,597211,514Hugo removals (TRh)49,002207 23,62320,219Net change (NC)-195,236-35,6801,272-80,271-35,637-44,9201990 Inventory (Igo) 149,21287,477 NC = GG NC = NG - = I86

50 + NCPre-Hugo inventory = Table C.9--Pe
+ NCPre-Hugo inventory = Table C.9--Period change in volme of softwood sautilnber on tin&erlard, by coymnent of change andownership class, for 23 comties in South Carolina, 1986-1990 Inventory item All OtherForestFarmerMiscellaneousownershipsforestpublicindustryprivate1986 Inventory (I86) Gross growth (GG) 266,259 Regular mortality CM,)307,20223,43715,11244,46996,839127,345Hugo mortality (Mh) 918,303161,893333,279640,227 Net growth (NG)938,784-675,48149,348635,807369,250559,860Regular removals (TR,) 132,220 Hugo removals (TRh) 60,70886,005127,903517,632981,488Net change (NC) -4,730,817-868,409-173,212-642,140 1990 Inventory (19G) 755,423 Thousand board feet - NC q NG = Is6 + NC Pre-Hugo inventory = Table C-lo--Period change in volme of hardwod sawtilnber on timberland, by component of change andownership class, for 23 comties in Sauth Carolina, 1986-1990 Inventory item All OtherForestFarmerMiscellaneousownershipsforestpublicindustryprivate1986 Inventory (Is61Gross growth (GG)Regular mortality (M,)Hugo mortality (Mh)Net growth (NG)Regular removals (TR,)Hugo removals (TRh)Net change (NC)1990 Inventory (Igo) 291,758975,019 164,023

51 -692,151 570,27281,6629,873144,847-73,05
-692,151 570,27281,6629,873144,847-73,05878,537-151,595418,677Thousand board feet179,228 28,403572,192785,093 98,878112,62118,178168,079262,298381,61710,225333,727423,917571,76212,030553,137399,157751,840 81,95177,222-1,805-224,260-57,191-257,300177,423 NC = GG - NC = NG - = Ig6 + NC Pre-Hugo inventory = Table C-11--Distribution of 1990 inventory of growing stock, by ownership class, species grog, and damage class, comties in South Carolina SoftwoodsHardwoodsOwnership classPercentage of inventory in--Percentage of inventory in--19901990InventoryHealthyClass HealthyClass treestreestreestreestreestreestreesThousandThousandcubic feetPercentcubic feetPercentNational forest196,607 12 19 Other public254,612 11 Forest industry907,363 6 11 957,789 135 Miscellaneous private1.460.727 8 7 All ownerships 3,777,098 6 Table C-12--Distribution of 1990 inventory of sawtidxx, by ownership class, species group, and darnage class,for 23 counties in South Carolina Ownership classSoftwoodsHardwoodsPercentage of inventory in--Percentage of inventory in--19901990 treestreestreestreestreestreestreestreesThousandboard feetPercentThousandboard feetPercentNational forest755,423

52 20 Other public896,045 176 20 Forest ind
20 Other public896,045 176 20 Forest industry 2,849,952 7 5 Miscellaneous private5.759.512 7 All ownerships 14,278,455 6 Table C-13--Change in volune of softwood growing stock on timberland, by diameter class, for 23 inSouth Carolina, 1986-1990 Diameter class1990 inventory in-- (inches at breast1986 height)InventorychangeInventoryHealthyClass 3Class 2 Class 1 treestreestreestrees5.0-6.97.0-8.99.0-10.911.0-12.913.0-14.921.0 and larger All Thousand cubic feetPercent429,755-65,092364,663 13 -53,320582,697 -138,543612,378 5 -227,552540,822 8 -151,324519,375 7 -154,674391,991 6 -99,269291,039 7 -63,967191,185 6 -84,267282,948 176 6 Table C-14--Change in volune of hardwood growing stock on timberland, by dieter class, for 23 counties inSouth Carolina, 1986-1990 Diameter class1990 inventory in--(inches at breast1986 height)InventorychangeInventoryHealthy Class 3Class 2Class 1 treestreestreestrees5.0-6.97.0-8.911.0-12.913.0-14.921.0 and largerThousand cubic feetPercent473,665-26,509447,156 77 8,979613,023 86 -9,128650,491 89 -66,034645,330 10 -6,502635,646 6 -32,429511,629 7 -27,642404,863 -10,185282,362 -25,786616,527 21 All classes 5,002,263-195,236 Table C-15-

53 -Change in volune of softwood sawtin
-Change in volune of softwood sawtinrber on ti&erland, by dieter class, for 23 comties inSouth Carolina, 1986-1990 Diameter class(inches 1990 inventory in--at breast 1 Y&S6 InventorychangeInventoryHealthyClass 3Class 2Class 1 - =. . - , treestreestreestrees Thousand board feetPercent9.0-10.9 -497,748 5 8 -781,009 7 -861,508 6 -597,629 7 -401,458 6 21.0 and larger2.401.235-566,9791.834.256 176 All classes 19,009,272 6 Table C-16--Change in volune of hardmod sawtilnber on tintserland, by dimeter class, for 23 comties inSouth Carolina, 1986-1990 Diameter class 1990 inventory in--(inches at breast1986 height)InventorychangeInventoryHealthy Class 3Class 2 Class 1 treestreestreestreesThousand board feetPercent11.0-12.9 -214,030 -11,132 -138,623 -131,826 -56,647 21.0 and larger3.747.040-139.8933.607.147 All classes 14,944,495-692,151 Table C.17--Change in volune of softwood growing stock on tiderland, by species, for 23 comties inSouth Carolina, 1986-1990 Species1986Inventory1990inventory in-- Net changeInventoryHealthyClass 3 Class 2 treestreestrees Slash pineShortleaf pineLoblolly pinePond pineVirginia pinePitch pineSpruce pineSand pine

54 Eastern white pineEastern hemlockSpruce
Eastern white pineEastern hemlockSpruce and firBaldcypressPondcypress451,329195,053244,145 277,26054,852 -11,304284,024 -2,45871,711 Thousand cubic feet-148,690302,639 145,814 19 205,120 179,755 51,912 ---- -- 67635 2 --3 34,074-13733,937 All species 4,815,106 146 Table in volune of hardwood growing stock on ti&erland, by species, for 23 comties inSouth Carolina, 1986-1990 Species1986 InventorychangeInventoryThousand cubic feetSelect white oaks272,297Select red oaks92,266Chestnut oak -- Other white oaks159,951Other red oaks997,617Hickory162,474Yellow birch -- Hard maple1,524Soft maple379,354Beech7,159 Tupelo and blackgum Ash168,598Cottonwood34,812Basswood 246,737Bay and magnolia16,306Black cherry9,649Black walnut3,179Sycamore26,500Black locust -- 90,972Other eastern 7158 66 857074 4____68---- 151,855-68,770928,847-12,027 -- 1,7778,598387,952 -44,362 -19,399 -11,422157,176-2,11432,698 -11,649235,088 -- 87,442 1314116IO15--13--54964----114 5__IO__8 85,164-4,57480,590 7 All species 5,002,263-195,236 Table C-19--Change in volune of softwood sawtintnzr an timberland, by species, for 23 cmties inSouth Carolina, 1986-1990 1986Inventory1990inventory in--Net1

55 990changeInventoryHealthyClass 3 Class 2
990changeInventoryHealthyClass 3 Class 2 treestreestreesThousand board feetPercent pine 1,971,710-683,707 47 Slash pine476,183-133,231342,952 8 Shortleaf pine644,400-135,583508,817 Loblolly pine 6 Pond pine 1,095,182-399,830695,352 1513 Virginia pine142,6862,082144,768 2 Pitch pine --------__-- Table Mountain pine ______--__ Spruce pine85,748-15,58670,162 Sand pine __---------- Eastern white pine ---- ---- Eastern hemlock ---- ----__-- Spruce and fir ---- __-- -33,448 256,9911,363258,354 3 54.454-5,15949,295 -- All species 19,009,272 6 Table C-20--Change in volune of hardmod sawtilnber on timberland, by species, for 23 comties inSouth Carolina, 1986-1990 1986Net1990InventorychangeInventoryThousand board feetHealthytrees1990 inventory in--Class 3Class 2Class 1treestreestreesPercentSelect white oaksSelect red oaksChestnut oakOther white oaksOther red oaksHickoryYellow birchHard mapleSoft mapleBeech Tupelo and blackgumAshCottonwoodBay and magnolia -- 318,630505,941-23,157 -306,073504,622-91,285 413,337 471,183136,056 -18,253333-97,4046,144-14,355305 806,17916,726 456,828136,361 15,5656,4375,699 584-1,4451,707-28,433878,36216,1494,9927,40685,931 -10,621192,053

56 54 58 50667762691007512 5--10__ 246108 -
54 58 50667762691007512 5--10__ 246108 --26-- ____4-- 62926 249,570-10.851 5 All species 14,944,495-692,151 Table C-21--Area of tin&et-land, by ownership class, hurricane damsge status, and previous standtype, for 23 comties in South Carolina Ownership class All standdamage status typesPrevious stand typePineNatural UplandLowlandplantationpinepinehardwoodhardwood No damageDamaged112,50326,72151,76212,89510,66710,458420,35859,767198,06351,47221,62789,429Total532,86186,488249,82564,36732,29499,887 Forest industry No damage 516,688266,73376,771 449,281166,86479,13168,046329,453Total1.609.463716,014243,635129.447106,578413,789 Nonindustrial private No damageDamaged 168,493392,336223,836305,259 237,671887,980414,759545,058910,136Total4.393.651406,164 638,595850,3171.218.259 All ownerships No damageDamaged 461,947520,869287,047354,458402,917 746,719 545,362634,731 Total 832,409989,189 Table C.&?--Area of timberland, by broad mmagement class and pre- and post-Hugo stocking percentage for manageablestand trees, for 23 in South Carolina Broad management classAllPost-Hugo stocking (percent)and pre-Hugo stocking(percent) 15-2940-49 Pine plantations o-1415-2930

57 -39 50,54350,54325,4107,15618,254 15,305
-39 50,54350,54325,4107,15618,254 15,305 -- -- 15,30551,701 14,180 --2,460 35,061 54,082 2,336 21,385 65,571 7,107 -- -- 5,04212,99514,5347,955 10,35214,42310,536 9.751 -- 4,6407,798 7,377 30,046 100,515 597.58330.04510.32118.71114.37515.19122.341 48.520 45,099 392.180 1.208.666143.908 59.228 62.74% 83.621 67.721 84.560 160.278 146.414 392.180Natural pine o-1415-29 60-69 85-99 All classes 395,308 395,308 114,515 23,044 91,471 104,21414,936 9,803 79,475 106,979 16,695 27,8542,410 60,012 159,89230,020 21,605 21,631 69,032 18,75912,8369,04415,221 16,763 119,190 254,36444,77112,01216,62220,774 7,494 39,407 113.284238,76137,5693,50313,12815,037 2,410 24,43137,748 104,927 207,93038.16923.5362,4594.79212.82016.36986.9621.773.776 619.271 197.819 152.279 135.134 109.343 187.820 163.852 121.296 06.962 15-2940-49 1 oo+ ALL 229,08999,55514,03668,2679,517 7,127 51,623 76,2589,378 2,460 24,072 40,340 90,742 14,427 -- 64,0064,46516,716 4,635 23,708 107,0877,3434,582 7,228 23,262 50,368 53,347 -- -- 2,3968,280 2,259 11,1065,903 23,403 44‘058 2.679 4.582 -- 6.97a10.708832.409 292,951 120.910 109,445 77.73068.424 58,076 63.249 30.916 10,708 Upland ha&mod 15-29 50-59 1 oo+ All clas

58 ses304,551304,551 9,4617,1320,68056,9368
ses304,551304,551 9,4617,1320,68056,93684,1018,9219,9252,33662.919115,00810,20112,8509,29010,38472,275109,47414,278 2,4705,46921,00025,83045.1632 336 ________ 35.262989.189366,474127.02%89.546 94.59778,557 hardwood o-1415-2940-49 1 oo+ classes 449.712 206,314 173.885 160,518 206,039 120,741 173,019 122.901 118.806All classes 50-59 85-99 345,11359,47563,38353,56225,52245.359 classes 1,294,256 1,294,256356,15443,372418,16064,210623,77989,074629,46056,459901,38591,090716,81159,808 1,072,316712,099250,135 52,674 244,23872,929 86.907 315,394 53,45072,250 95,669 288,241 02,866 65,755 120,885 397,366 34,69849,191 24,360 68,196 131.888 323,140 41.151 26.226 44.938 44.440 104.072 126.706 643.918587,903 560,681 546,124 529,762 633,326 449,846 643.918 51 i- ___----- --------_---- Sheffield, Raymond M.; Thompson, Michael T. 1992. Hurricane Hugo:effects on South Carolina’s forest resource. Res. Pap. SE284. Asheville, NC: U.S.Department of Agriculture, Forest Service, Southeastern Forest Experiment Station. 51 PP.Hurricane Hugo struck South Carolina in September 1989 causing extensive mortalityand damage to forest stands in 23 counties. The Forest Inventory and An

59 alysis WorkUnit at the Southeastern Fore
alysis WorkUnit at the Southeastern Forest Experiment Station conducted a special inventoryof the damaged area in 1990. This Paper presents the results of that inventory anddocuments procedures used in the inventory and analysis. More than 4.5 millionacres of timberland were significantly damaged. Volume of softwood growing stockwas reduced million acres to South Carolina’s backlog of acreage needing regeneration.KEYWORDS: Forest inventory, forest-damage assessments, tree-damageclassifications, wind damage. -- -__--___--- ----- e--w -w-e Raymond M.; Thompson, Michael T. 1992. Hurricane Hugo: I on South Carolina’s forest resource. Res. Pap. SE284. Asheville, NC: U.S. I of Agriculture, Forest Service, Southeastern Forest Experiment Station. I il pp. hurricane Hugo struck South Carolina in September 1989 causing extensive mortality md damage to forest stands in 23 counties. The Forest Inventory and Analysis Work 1 at the Southeastern Forest Experiment Station conducted a special inventory ,f the damaged area in 1990. This Paper presents the results of that inventory and I procedures used in the inventory and analysis. More than 4.5 millionacre

60 s of timberland were significantly damag
s of timberland were significantly damaged. Volume of softwood growing stock was reduced by 21 percent with nearly one-third of the remaining volume damagedto some degree. Hardwoods sustained less immediate loss-6 percent-but one-thirdof the remaining hardwoods was damaged. Hurricane Hugo added more than 1 f million acres to South Carolina’s backlog of acreage needing regeneration. I KEYWORDS: Forest inventory, forest-damage assessments, tree-damage I classifications, wind damage. I The Forest Service, U.S. Department ofAgriculture, is dedicated to the principle ofmultiple use management of the Nation’s forest resourcesfor sustained yields of wood, water, forage, wildlife, andrecreation. Through forestry research, cooperation with theStates and private forest owners, and management of the ’ National Forests and National Grasslands, it strives-asdirected by Congress-to provide increasingly greaterservice to a growing Nation.USDA policy prohibits discrimination because of race,color, national origin, sex, age, religion, or handicappingcondition. Any person who believes he or she has beendiscriminated against in any USDA-related activity shouldimmediately co