/
C.4 Conservation C.4 Conservation

C.4 Conservation - PowerPoint Presentation

yoshiko-marsland
yoshiko-marsland . @yoshiko-marsland
Follow
396 views
Uploaded On 2016-12-10

C.4 Conservation - PPT Presentation

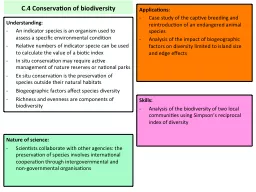
of biodiversity Understanding An indicator species is an organism used to assess a specific environmental condition Relative numbers of indicator specie can be used to calculate the value of a biotic index ID: 499656

habitat species conservation diversity species habitat diversity conservation grass nature individuals situ higher number evenness biodiversity reserves richness indicator

Share:

Link:

Embed:

Download Presentation from below link

Download Presentation The PPT/PDF document "C.4 Conservation" is the property of its rightful owner. Permission is granted to download and print the materials on this web site for personal, non-commercial use only, and to display it on your personal computer provided you do not modify the materials and that you retain all copyright notices contained in the materials. By downloading content from our website, you accept the terms of this agreement.


Presentation Transcript

Slide1

C.4 Conservation of biodiversity

Understanding:An indicator species is an organism used to assess a specific environmental conditionRelative numbers of indicator specie can be used to calculate the value of a biotic indexIn situ conservation may require active management of nature reserves or national parksEx situ conservation is the preservation of species outside their natural habitatsBiogeographic factors affect species diversity Richness and evenness are components of biodiversity

Applications:Case study of the captive breeding and reintroduction of an endangered animal speciesAnalysis of the impact of biogeographic factors on diversity limited to island size and edge effects

Skills:Analysis of the biodiversity of two local communities using Simpson’s reciprocal index of diversity

Nature of science:

Scientists collaborate with other agencies: the preservation of species involves international cooperation through intergovernmental and non-governmental

organisationsSlide2

In situ conservation

Involves endangered species remaining in the habitat to which they are adapted.Allows species to interact with other wild species, conserving more aspects of the organism’s nicheDo not have to reintroduce species back into the habitat againSlide3

Nature reservesSlide4

Nature Reserves

Must manage nature reserves after they are established:Controlled grazingRemoval of shrubs or treesRemoving alien/invasive speciesReintroduce species that have become locally extinctRe-wetting of wetlandsLimiting predatorsControlling poachingFeeding animalsControlling accessSlide5

Ex situ conservation

Involves removing organisms from their natural habitatPlant species grown in botanic gardens Captive breeding of animals, followed by release into their natural habitats. Some zoos involved.Back up for In situ conservation measures, or if organisms cannot remain safely in their natural habitatSlide6

Case study

Research one example of captive breeding and reintroduction of an endangered animal speciesWhy did it become endangered?Why could it not be conserved In situ?What were the steps in the conservation program?How were they released?Was it successful? How do you know?Did the government of that country help?Was the conservation done by an NGO?

Make sure you include evidence and data.Slide7

Nature Reserve features

Can influence biodiversityLarge nature reserves more effective than smaller ones at maintaining biodiversityLarger area = higher population of a certain species that can be supportedCorridors/tunnels between reserves allows them to be largerMaximize size of central area, minimize total length of perimeter Slide8

Indicator species

Organisms that occurs only when specific environmental conditions are presentAssess a specific environmental conditions by their presence or absenceE.G lichens are pollutant intolerant – if they are present it indicates clean airSlide9

Biotic Index

Compares the relative frequency of indicator speciesStream health measured by macroinvertebrate biotic indexSlide10

Macroinvertebrate Biotic Index

Number of individuals of each indicator species in a sample is determinedSlide11

Biodiversity

Two components: richness and evenness Slide12

Species…

RichnessEvenness

Number of individuals within a speciesNumber of species present in the habitatSlide13

Species richness

Number of species in a habitatMore species present = richer habitatDoes not take into account the number of individuals present for each species.Must estimate the evennessSlide14

Species evenness

Abundance of individuals in a speciesEven numbers of animals in each species is more diverse than having one species that outnumbers all the othersMeasure by calculating percentage cover in a quadrat.Slide15

Sample A

Sample BSlide16

Species observed

Field A % coverField B % coverCocksfoot grass5738Timothy grass

3216Meadow buttercup314White clover322Creeping thistle15Dandelion45Total100100What is the species richness of field A and B?Which field has more evenness?Which field therefore is considered more diverse?Slide17

Simpson’s Index of Diversity

Measure of the diversity of the habitat.Uses both species richness and evenness.It ranges from 0-1 and it represents the probability that two individuals randomly selected from a sample will belong to different species. A higher value indicates higher diversity.

n = number of individuals of a particular speciesN = total number of all individuals of all speciesD = 1-Σ(n/N)2Slide18

Species

nn/N(n/N) 2Cocksfoot grass

380.380.1444Timothy grass16Meadow buttercup14White clover22Creeping thistle5Dandelion5

Sum (Σ) 100-1 - Σ--Slide19

Species

nn/N(n/N) 2Cocksfoot grass

380.380.1444Timothy grass160.160.0256Meadow buttercup140.140.0196White clover220.220.0484Creeping thistle50.050.0025Dandelion

50.050.0025Sum (Σ) 100-0.24301 - Σ--0.7570Slide20

Species

nn/N(n/N) 2Cocksfoot grass

570.570.3249Timothy grass320.320.1024Meadow buttercup3White clover3Creeping thistle1Dandelion4

Sum (Σ) 100-1 - Σ--Slide21

Species

nn/N(n/N) 2Cocksfoot grass

570.570.3249Timothy grass320.320.1024Meadow buttercup30.030.0009White clover30.030.0009Creeping thistle10.010.0001Dandelion

40.040.0016Sum (Σ) 100-0.43081 - Σ--0.5692Slide22

Why is a habitat with a higher diversity more stable than one with a lower diversity?

Higher diversityMany different species and many organisms Small change to the environment may affect one species (small proportion of total species)Affect on whole habitat is smallHabitat is able to withstand the changeSlide23

Why is a habitat with a higher diversity more stable than one with a lower diversity?

Lower diversityHabitat dominated by a few speciesSmall change that affects one of these species could destroy the whole habitat