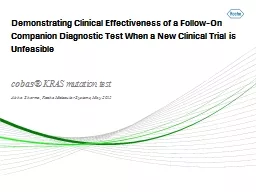
/
Demonstrating  Clinical Effectiveness of a Follow-On Companion Diagnostic Test When a Demonstrating  Clinical Effectiveness of a Follow-On Companion Diagnostic Test When a

Demonstrating Clinical Effectiveness of a Follow-On Companion Diagnostic Test When a - PowerPoint Presentation

yoshiko-marsland
yoshiko-marsland . @yoshiko-marsland
Follow
359 views
Uploaded On 2018-10-02

Demonstrating Clinical Effectiveness of a Follow-On Companion Diagnostic Test When a - PPT Presentation

Abha Sharma Roche Molecular Systems May 2015 cobas KRAS mutation test Overview of the Presentation 2 Background Approach for follow on Diagnostic Test NDMC Assumption Bridge 1 NDMC ID: 683866

kras test cobas mutation test kras mutation cobas study npv ndmc clinical ppv sanger hazard fda approved sequencing diagnostic

Share:

Link:

Embed:

Download Presentation from below link

Download Presentation The PPT/PDF document "Demonstrating Clinical Effectiveness of..." is the property of its rightful owner. Permission is granted to download and print the materials on this web site for personal, non-commercial use only, and to display it on your personal computer provided you do not modify the materials and that you retain all copyright notices contained in the materials. By downloading content from our website, you accept the terms of this agreement.


Presentation Transcript

Slide1

Demonstrating Clinical Effectiveness of a Follow-On Companion Diagnostic Test When a New Clinical Trial is Unfeasible

Abha Sharma, Roche Molecular Systems, May 2015

cobas

® KRAS mutation testSlide2

Overview of the Presentation

2

Background

Approach for follow- on Diagnostic Test

NDMC Assumption

Bridge 1

: NDMC

Criteria for

cobas

Test

Bridge 2

: NDMC

Criterion for FDA-approved

test

Bridge 3: Influence Criteria evaluation

Bridge 4: Covariate assessment

Bridge 5: Sensitivity and Robustness AnalysisSlide3

BackgroundDesign(s) to demonstrate clinical utility of the

first companion diagnostic test Using the final In-Vitro Diagnostic (IVD) version of the test to select patients

Bridging

from Clinical Trial Assay (CTA) or Lab

Developed Test (LDT

) to the

final

IVD Test

Follow on companion diagnostic test : Re-test samples from a previously conducted trial for first companion Diagnostic -samples may not be availableConduct a new prospective trial with the same drug with a placebo arm - unethical to give placebo to patients while an effective approved drug is available.

3Slide4

Approach for Follow on Diagnostic Test and NDMC Assumption

Test Samples from another clinical study cohort by The First companion Diagnostic Test the follow on companion diagnostic test, and the reference method (A sequencing m

ethod)

Calculate agreement between

follow on companion diagnostic

test and the other two tests.

“Transport” Results of drug efficacy from the

pivotal study for the first companion diagnostic test to the follow on companion diagnostic test assuming Non-differential Misclassification (NDMC).4Slide5

Background: Cetuximab for mCRC patients

Pivotal Clinical Study: KRAS Mutation

5

572 Patients with Advanced Colorectal Cancer

Cetuximab

+ BSC

Best Supportive Care (BSC)

Tested by Sanger Sequencing

KRAS Mutation Detected(MD or POS)

KRAS Wild-Type (WT or NEG)

HR- 0.98 (0.70, 1.37)

No Effect of Treatment

HR – 0.55 (0.41,0.74) Treatment Effective

*

Karpetis

et. al. NEJM

2008Slide6

NDMC Assumption: Given the comparator method result, clinical efficacy is assumed not to depend on the cobas

® KRAS Mutation Test result

Sanger Sequencing

cobas

®

KRAS Test

S

= 0 (

Neg)S = 1(Pos)

R = 0 (

Neg

)

δ

00

δ

01

R =

1

(

Pos)

δ10

δ11δ.0

δ.16

Sanger Sequencing

cobas® KRAS TestS = 0 (Neg)S = 1

(Pos)R = 0 (

Neg)δ.0

δ.1R = 1(Pos)

δ.0

δ.1When Clinical outcome is available

Applying NDMC Assumption

δ

r

.

=

δ

r0

(1-

πr ) + δr1 πr = (NDMC) δ.0 (1- πr ) + δ.1 πr Here , π1 = PPV and π0 = 1-NPV; δ1. = Log Hazard Ratio in R=1(Pos); δ0. = Log Hazard Ratio in R=0 (Neg )Slide7

Background: Cetuximab Study and FDA-Approved KRAS Test

7

572 Patients with Advanced Colorectal Cancer

Cetuximab

+ BSC

Best Supportive Care (BSC)

Tested by FDA-Approved KRAS test

KRAS Mutation Detected(MD)

KRAS Wild-Type (WT)

HR- 0.91 (0.67, 1.24)

No Effect of Treatment

HR – 0.63 (0.47,0.84) Treatment EffectiveSlide8

8

XELOXA Samples + supplemental mCRC samples (n=461)

Sanger Sequencing

cobas

®

KRAS Test

Calculate NPV+PPV-1

Calculate NPV+PPV-1

Under NDMC: E(

h|R

=0) –E(

h|R

=1) = [E(

h|S

=0) – E(

h|S

=1)( NPV+PPV-1)

difference in log-hazard ratio for

cobas

test = difference in log-hazard ratio for

Sanger ×(NPV+PPV-1)NDMC Assumption Implication and Analysis (Criterion 1 and 2)NPV+PPV-1 is defined as the “attenuation factor”

FDA Approved Test

cobas

®

KRAS TestSlide9

Attenuation Factor (NPV+ PPV-1) calculations

9

Here,

τ

is the prevalence of

Pr

(S=1) in the Pivotal Study, and Slide10

Comparison of the cobas® KRAS Mutation Test with Comparator Methods for Detection of KRAS Mutations in Codon 12/13

cobas

®

KRAS Mutation Test

Comparator Method

Sanger Sequencing

FDA-approved IVD test

MD

NMD

Invalid

Total

MD

NMD

Invalid

Total

MD

124

34

5

163

139

9

15

163

NMD

4

268

2

274

10

248

16

274

Invalid

0

19

5

24

0

5

19

24

Total

128

321

12

461

149

262

50

461

PPA

(95% CI)

96.9% (92.2%, 98.8%)

93.3% (88.1%, 96.3%)

NPA

(95% CI)

88.7% (84.7%, 91.8%)

96.5% (93.5%, 98.1%)

10Slide11

Attenuation Factor (NPV+ PPV-1) calculations for cobas

® test and FDA Approved Test11

Comparator

PPV

(95% CI)

NPV

(95% CI)

Attenuation Factor (95% CI)

Sanger Sequencing

0.858

(0.811, 0.902)

0.975

(0.946, 0.994)

83.3%

(77.7, 88.3)

Table 1: Attenuation Factors for

cobas

®

KRAS mutation test

Table 2: Attenuation Factor for FDA Approved test

Comparator

PPV

(95% CI)

NPV

(95% CI)Attenuation Factor (95% CI)

Sanger Sequencing

0.840 (0.790, 0.888)

0.956 (0.918, 0.986)

79.5% (73.4, 85.2)

Comparator

PPV

(95% CI)

NPV

(95% CI)

Attenuation Factor (95% CI)

FDA Approved Test

0.957

(0.927, 0.981)

0.945 (0.909, 0.978)90.2%(85.6, 94.4)

Table 3: Attenuation Factor with respect to FDA Approved test Slide12

Five Criteria to Establish Clinical Utility of cobas® KRAS Test

NDMC (Non-Differential Misclassification) criterion for cobas®

Test

NDMC

(Non-Differential Misclassification)

criterion

for

FDA Approved Test

Influence Condition EvaluationCovariate AssessmentSensitivity Analysis12Slide13

Influence Condition Evaluation: (3)

Evaluate Influence Condition: To enable Overall population labeling, the beneficial effect of the drug must not be limited to only the predefined subpopulation Our Objective is to show that for this study overall Population labeling does not apply; Influence condition is false

i.e. 95% CI for the hazard ratio in the Mutation positive subset

includes

1, and

the 95% CI for the hazard ratio in the Mutation Negative subset

excludes

1.

13Slide14

Influence Condition Evaluation:

Log Hazard Ratios for cobas® test can be calculated using following

relationships between hazard ratios based on NDMC assumption

-

For

Mutation Negative subset

δ

0.

= δ00 (1- π0 ) + δ01 π0 = (NDMC) δ.0 (1- π0 ) + δ.1 π0

Here

,

π

0

= 1-NPV

-For Mutation

Positive

subsetδ1. = δ10 (1-

π1 ) + δ11 π1

= (NDMC) δ.0 (1- π1 ) + δ.1

π1 Here , π1 = PPV14Slide15

Influence Condition Evaluation Results

Drug Efficacy

cobas

®

KRAS

Mutation Test

Status

Samples

Tested

(N)

Hazard Ratio (HR)

Estimate

95% CI

Overall Survival (OS)

No

Mutation Detected

272

0.558

(0.422, 0.752)

Mutation Detected

158

0.908

(0.670, 1.209)

Progression Free Survival

(

PFS)

No

Mutation Detected

272

0.413

(0.304, 0.550)

Mutation Detected

158

0.869

(0.670, 1.138)

15Slide16

Covariates Comparison between the two studies: Patient Characteristics (4)

Characteristic

Study Cohort (N=437)

Pivotal

Clinical study

(N=453)

P-value

*

Sex


N

437

453


Female

204 (46.7%)

153 (33.8%)

P

1

<0.0001

Male

233 (53.3%)

300 (66.2%) Race


N437

453 

White391 (89.5%)414 (91.4%)

P1=0.151

Non-White

46 (10.5%)

39 (8.6%)


Baseline ECOG


  N

421453 

0

285 (67.7%)

110 (24.3%)

P

1

<0.0001

1

125 (29.7%)

245 (54.1%)


2

11 (2.6%)

98 (21.6%)


Age


N

437

453


Median

61.0

63.2

P

2

=0.004

Min - Max

26.0 - 89.0

28.6 – 88.1


BSA


N

361

453


Median

1.9

1.8

P

2

<0.0001

Min - Max

1.3 - 2.8

1.3 – 2.5


*

 P

1

=p-value from Chi-Square Goodness-of-Fit Test; P

2

=p-value from 2-sided one sample Sign Test.

Note: ECOG=Eastern Cooperative Oncology Group; BSA= Body surface area BSA=[(height in cm*weight in Kg)/3600]

1/2

16Slide17

Covariates Comparison between the two studiesDisease Characteristics (4)

Disease Characteristics


Study Cohort (N=437)

Therascreen (N=453)

P-value

a

Disease Stage


Duke’s Stage Total

430

59


A

0 (0.0%)

1 (1.7%)

P

1

<0.0001

B

0 (0.0%)

16 (27.1%)

  C

363 (84.4%)

38 (64.4%)

  D67 (15.6%)

4 (6.8%) 

Tumor Type 


N

432

448


Primary

420 (97.2%)

410 (91.5%)

P1<0.0001

Metastatic12 (2.8%)38 (8.5%)


a

; P

1

=p-value from Chi-Square Goodness-of-Fit Test.

17Slide18

Covariates Comparison between the two studiesSample Characteristics (4)


Study Cohort (N=437)

Pivotal Clinical study

(N=453)

P-value

a

Tumor Content in Sample


N

437

453


Median

35.00

47.25

P

2

<0.0001

Min - Max

5.0 - 90.0

1.0 – 100.0

 Macro Dissection of Samples


N437453

  Tumor Content ≤20

98 (22.4%)39 (8.6%)

P1<0.0001

Tumor Content >20

339 (77.6%)

414 (91.4%)


Necrosis Score Within Tumor Area


  N437

453 

0 - < 10%

304 (69.6%)

346 (76.4%)

P

1

<0.0001

10 - 50%

131 (30.0%)

86 (19.0%)


>50%

2 (0.5%)

21 (4.6%)


KRAS Mutation Type


N

149

208


12ALA

12 (8.1%)

14 (6.7%)

P

1

=0.317

12ARG

2 (1.3%)

2 (0.9%)


12ASP

42 (28.2%)

71 (34.1%)


12CYS

15 (10.1%)

16 (7.7%)


12SER

13 (8.7%)

11 (5.3%)


12VAL

35 (23.5%)

54 (25.9%)


13ASP

30 (20.1%)

40 (19.2%)


a

; P

1

=p-value from Chi-Square Goodness-of-Fit Test; P

2

=p-value from 2-sided one sample Sign Test..

18Slide19

Hazard ratio Estimates for Significant CovariatesIf the covariate distribution was similar to observed in the original study

19


Hazard Ratio (HR)


Wild Type

Mutation Detected

Covariates

Drug Efficacy

Estimate

95% CI

Estimate

95% CI

Age

OS

0.554

(0.426,0.730)

0.907

(0.667,1.207)

PFS

0.413

(0.308,0.555)

0.872

(0.660,1.156)

BSA

OS

0.563

(0.416,0.760)

0.902

(0.681,1.202)

PFS

0.416

(0.313,0.560)

0.874

(0.667,1.142)

Duke’s

Stage (<=C, >C)

OS

0.559

(0.422,0.757)

0.903

(0.678,1.217)

PFS

0.412

(0.311,0.552)

0.866

(0.656,1.131)

Baseline ECOG

OS

0.563

(0.414,0.771)

0.904

(0.675,1.214)

PFS

0.407

(0.302,0.551)

0.860

(0.646,1.137)

Necrosis

(0 - <10%, 10 – 50%, >50%)

OS

0.562

(0.420,0.753)

0.890

(0.686,1.180)

PFS

0.408

(0.303,0.545)

0.844

(0.659,1.117)

Sex

OS

0.552

(0.428,0.734)

0.898

(0.662,1.195)

PFS

0.408

(0.311,0.545)

0.867

(0.662,1.141)

Tumor Type

OS

0.549

(0.419,0.726)

0.980

(0.699,1.335)

PFS

0.401

(0.299,0.531)

0.972

(0.726,1.326)

Tumor content (<=20 or >20)

OS

0.563

(0.425,0.755)

0.912

(0.677,1.214)

PFS

0.416

(0.308,0.554)

0.889

(0.665,1.187)

Tumor content (Num)

OS

0.556

(0.405,0.734)

0.901

(0.673,1.221)

PFS

0.408

(0.306,0.541)

0.877

(0.668,1.149)Slide20

Sensitivity Analysis* (5)

Sensitivity analysis was conducted to consider the robustness of the study results to the assumptions by simulating how many agreements between cobas

®

test

and Sanger sequencing would have to be changed to disagreements before the study fails to show clinical effectiveness.

20

Sanger Sequencing

cobas

®

KRAS Test

Pos

Neg

Pos

a

b

Neg

c

d

k

k

‘k’ patients will be randomly selected from ‘a’ cell and their status will be changed to Sanger

Pos

,

cobas

test Negative, similarly k’ patients will be randomly selected from ‘d’ cell and their status will be changed to Sanger Negative cobas test Positive. Estimate of Log Hazard ratio calculated for each value of ‘k

’.The highest value of k at which the hazard ratio is still statistically significant will be determined.

*Denne, Pennello et al. 2014, Statistics in Biopharmaceutical ResearchSlide21

OS (HR) Changes by KRAS Status as Determined by the cobas® KRAS Mutation Test by Moving Subjects from Concordance to

Discordance (Criterion 5)21

when

k

= 45, which corresponds to 21% more discordance between the

cobas

®

KRAS Mutation Test and Sanger

sequencing for Mutation Positive subsetSlide22

PFS (HR) Changes by KRAS Status as Determined by the cobas® KRAS Mutation Test by Moving Subjects from Concordance to Discordance (5)

when k = 27, which corresponds to 12.6% more discordance between the

cobas

®

KRAS Mutation Test and Sanger

sequencing

in Mutation Positive subsetSlide23

Five Bridges to Demonstrate Clinical Utility

23

XELOXA

+

Supplemental samples

Cetuximab

CO.17

Trial results

NPV+PPV-1

for

cobas

®

test >83%

NPV+PPV-1 for

cobas

®

test >

NPV+PPV-1 for FDA Approved Test

Influence condition is false

Covariate Assessment

Sensitivity AnalysisSlide24

AcknowledgementsInteractions with FDA

John Palma, Lesley Farrington, Allison Gannon, Tori Brophy, Sung LeeClinical Study Coordination , conduct, Karen Yu, Melody Chee, Sim

Truong

Clinical Study decisions, CSR and research

Sid

Scudder

Statistical Analysis

Guili Zhang, Shagufta Aslam, Ranga Yerram and SAS programming teamCOBAS is a trademark of Roche. 24Slide25

Doing now what patients need next

25