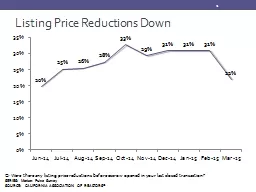
/
Emission reductions needed to meet proposed ozone standard and their effect on particulate Emission reductions needed to meet proposed ozone standard and their effect on particulate

Emission reductions needed to meet proposed ozone standard and their effect on particulate - PowerPoint Presentation

yoshiko-marsland
yoshiko-marsland . @yoshiko-marsland
Follow
383 views
Uploaded On 2018-11-17

Emission reductions needed to meet proposed ozone standard and their effect on particulate - PPT Presentation

matter Daniel Cohan and Beata Czader Department of Civil and Environmental Engineering Rice University Background EPA sets National Ambient Air Quality Standards NAAQS to protect health States tasked with attainment ID: 730244

ppb ozone epa nox ozone ppb nox epa 2011 reductions emissions july 2013 needed simon sensitivity high model amp

Share:

Link:

Embed:

Download Presentation from below link

Download Presentation The PPT/PDF document "Emission reductions needed to meet propo..." is the property of its rightful owner. Permission is granted to download and print the materials on this web site for personal, non-commercial use only, and to display it on your personal computer provided you do not modify the materials and that you retain all copyright notices contained in the materials. By downloading content from our website, you accept the terms of this agreement.


Presentation Transcript

Slide1

Emission reductions needed to meet proposed ozone standard and their effect on particulate matter

Daniel Cohan and Beata Czader

Department of Civil and Environmental Engineering

Rice UniversitySlide2

Background

EPA sets National Ambient

Air Quality

Standards (NAAQS) to protect healthStates tasked with attainmentNAAQS for O3 reduced from 84 ppb to 75 ppb and now 70 ppb Standard based on annual 4th highest 8-h O3, averaged over three yearsFocus: How much reduction in NOx and/or VOC is needed to attain?Slide3

Performance of SIP model predictions for 84 ppb ozone standard

3

Pegues et al., JA&WMA 2012

False Alarms

False NegativesSlide4

High-order Direct Decoupled Method (HDDM)


Sensitivity coefficients:

Innovative techniques introduced by ENVIRON (

Yarwood

2013) and EPA (Simon 2013) to more accurately predict ∆O

3

for large ∆E

Source:

Yarwood

GMD 2013

Source: Simon EST 2013Slide5

Performance of Simon HDDM approach

5

Simon et al., ES&T 2013Slide6

EPA REA estimates of emissions reductions needed to meet NAAQS

6Slide7

Goal of this work

Assess emission

reductions needed to meet

8-hour ozone standardUpdate to 2011 National Emissions InventoryInitial REA used 2008 inventoryCompare responses on low ozone and high ozone daysHow do controls targeted at peak O

3

affect O

3

at other times

PM impacts from NO

x

and VOC controlsEPA’s RIA for O3

NAAQS shows most health benefits from PM reductions

Compare results using two advanced HDDM methodsSlide8

12US2

12NE1

Model Set Up

Columns Rows Layers

12US1 396 246

25

12NE1 120 145 25

CMAQ 5.0.2:

CB05 chem. mech., aero6 module, chemistry in clouds, ammonia bidirectional flux

Emissions:

Anthropogenic emissions: 2011 NEI for U.S, 2006 EI for Canada, 2008 EI for Mexico

Biogenic emissions: estimated with BEIS v3.14 implemented in CMAQ (in-line option)

Domain

Configuration:

Grid resolution: 12km

Modeling period:

July – August 2011

Monitoring data available at EPA's AirData website http://www.epa.gov/airdata/

487 stations in the domain(1 did not have data for our modeling time period)Slide9

Model performance for 8-hr ozone

Metric

8-hr daily

maximum

ozone

Number of data points

29 533

Mean Observed (ppb)

50.4

Mean Simulated (ppb)

53.7

Mean Bias (ppb)

3.3

Mean Error (ppb)

8.2

Normalized Mean Bias (%)

7.4

Normalized Mean Error (%)

16.8

(Evaluated at 487 stations)Slide10

Sensitivities to -10% NOx: DDM (S(1)) vs

Brute Force

(*10)

Ozone

PM

nitrate

PM sulfateSlide11

Ozone sensitivity to NO

x

varies strongly with ozone concentrations (July 2011)Slide12

Ozone sensitivity to

VOC

varies little with ozone concentrations (July 2011)Slide13

8-hr ozone sensitivity to NOx

(top) and VOCs (bottom)

Low ozone day

High ozone day

Monthly averageSlide14

NOx

cuts reduce MDA8 O

3

on peak days but increase it on clean days 14

US EPA Health REA for ozoneSlide15

Will NOx controls continue the bifurcated ozone trends??

Simon et al., ES&T, 2015Slide16

Impacts of ozone on mortality may extend nearly linearly to low concentrations

16

Bell et al., EHP 2006Slide17

Influence of ozone temporal metric on health impacts of emission controls

17

Digar et al., ES&T 2011Slide18

Aerosol nitrate sensitivity to emissions of NOx

Monthly average

for July 2011

Daily average for

July 15

Daily average for

July 22Slide19

Summary

HDDM effective for probing model response of ozone to NO

x

and VOCsNot reliable for PM responses to NOx, which dominate impacts of new ozone standardNOx cuts yield greatest O3 reductions on high O3 daysMean O3 may continue to decline far less than peakVarious approaches concur that large NOx reductions are needed for attainment of peak standards

Feasible, affordable, and timely??

Impact on non-peak ozone, including winter??Slide20

Acknowledgments

NASA Air Quality Applied Sciences Team

Pat Dolwick, U.S. EPA

Andrew Pegues20