/
Introduction to RECLAIM Introduction to RECLAIM

Introduction to RECLAIM - PDF document

yoshiko-marsland
yoshiko-marsland . @yoshiko-marsland
Follow
405 views
Uploaded On 2016-07-19

Introduction to RECLAIM - PPT Presentation

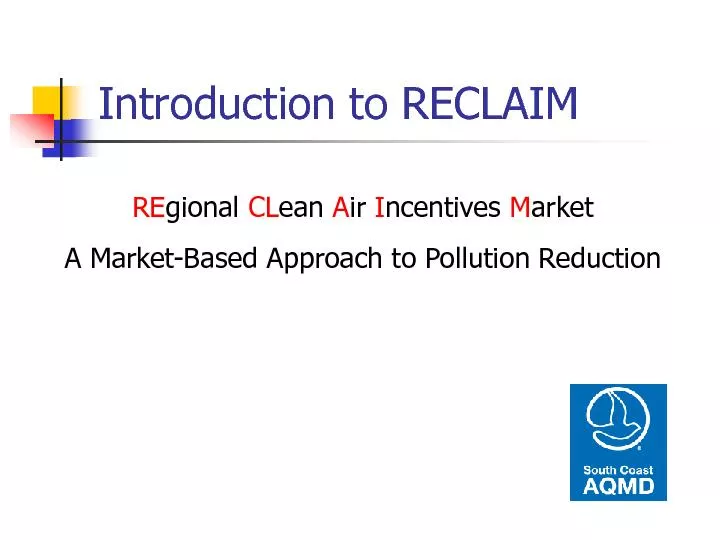
RE gional CL ean A ir I ncentives M arket A Market Based Approach to Pollution Reduction Agenda Morning Session xF06E Introduction xF06E Program Overview xF06E RECLAIM Participants Pleas ID: 411314

RE gional CL ean A ir I ncentives M arket A Market - Based Approach

Share:

Link:

Embed:

Download Presentation from below link

Download Pdf The PPT/PDF document "Introduction to RECLAIM" is the property of its rightful owner. Permission is granted to download and print the materials on this web site for personal, non-commercial use only, and to display it on your personal computer provided you do not modify the materials and that you retain all copyright notices contained in the materials. By downloading content from our website, you accept the terms of this agreement.


Presentation Transcript

Introduction to RECLAIM RE gional CL ean A ir I ncentives M arket A Market - Based Approach to Pollution Reduction Agenda Morning Session  Introduction  Program Overview  RECLAIM Participants (Please Schedule Separate Meeting for a Detailed Discussion About An Individual Facility)  Facility Permit  Natural Gas Usage Calculations  Monitoring, Reporting, and Recordkeeping for non - major sources  RTC Trade and Reconciliation Afternoon Session  MRR for Major sources PROGRAM OVERVIEW Brett Kimberly RECLAIM History  Need to reduce emissions of NOx & SOx.  Existing method was Command & Control (C&C) regulations.  End result of C&C would have been multiple rules for different equipment and different industries with changing compliance dates. Sign of the Times  Economic recession in early 1990’s  High abatement cost for C&C rules  SCAQMD time & resources for adopting each C&C Rule  Alternative compliance strategy options:  Emission Taxes/Fees or  Emission Trading Program Objectives  Same Level of Emission Reductions  Same or Lower Cost  Higher Compliance Confidence Emission Reductions – C&C NOx Measures Boilers - 7/1/94 IC Engines - 12/31/94 IC Engines - 12/31/99 Gas Turbines & Refinery Boilers - 12/31/95 Tier II Measures C&C Level 1994 1995 1996 1997 1999 2000 2001 2002 2003 Emissions Program Benefits  For Facilities  Maximum Flexibility  Clear Emission Reduction goals  Lower Compliance Costs Through Credit Trading  Replaced 30+ Adopted and 12 Potential Rules  For Environment  Certainty in Emissions Reductions  Higher Accuracy in Emission Data through Enhanced Monitoring Primary differences between C&C and RECLAIM  Individual device permits replaced by facility permit.  C&C rules pertaining to NOx or SOx emission limits do not apply.  RECLAIM includes substantial monitoring and reporting requirements.  RECLAIM provides compliance flexibility in terms of managing emissions and implementation of controls. Cap and Trade  RECLAIM imposes overall mass emission limits (or emission cap)  Emission reduction target set by decreasing level of allocations  Each pound of emission is represented by one pound of RECLAIM Trading Credits (RTCs)  Facility must have adequate RTCs to reconcile (offset) its quarterly and annual emissions  Facility may choose to either install emission controls or buy additional RTCs to increase its allocation Allocations Issued by SCAQMD An annual allocation is the number of RECLAIM Trading Credits (RTC) a facility holds for a compliance year.  Allocations issued are mainly based on highest production level from 1989 to 1992 (pre - recession).  Any emission offsets previously provided for permits may be re - issued as RTCs  Facilities new since October 1993 issued Allocations based only on offsets provided RECLAIM Trading Credits  Initial allocation starts in 1994 and is reduced each year until 2003 when a steady - state was achieved .  Allocations reduced periodically to implement Best Available Retrofit Technology as required by federal law (“Allocation shaves”).  One NOx shave and one SOx shave adopted to date; second NOx shave currently under development. NOx Progress 0 5,000 10,000 15,000 20,000 25,000 30,000 35,000 40,000 45,000 1994 1995 1996 1997 1998 1999 2000 2001 2002 2003 2004 2005 2006 2007 2008 2009 2010 2011 2012 2013 2014 2015 Compliance Year NOx (tons) Original RTC Supply NOx Progress 0 5,000 10,000 15,000 20,000 25,000 30,000 35,000 40,000 45,000 1994 1995 1996 1997 1998 1999 2000 2001 2002 2003 2004 2005 2006 2007 2008 2009 2010 2011 2012 2013 2014 2015 Compliance Year NOx (tons) Original RTC Supply RTC Supply (post - shave) Cycles Facilities divided into two Cycles: Cycle 1 Compliance Year – January 1 to December 31, RTCs for applicable year expire on 12/31. Cycle 2 Compliance Year – July 1 to June 30 of following year, RTCs for applicable year expire on 6/30. Compliance year is named for the year the cycle begins in. Examples: 2013 Cycle 1 – starts 1/1/13, RTCs expire 12/31/13 2013 Cycle 2 – starts 7/1/13, RTCs expire 6/30/14 Cycles Timeline 1/1 1/1 7/1 7/1 7/1 CYCLE 1 (current yr.) CYCLE 2 (prev. yr.) CYCLE 2 (current yr.) RECLAIM PARTICIPANTS Brett Kimberly Facilities in RECLAIM Facilities that reported 4 tons or more of NOx or SOx emitted in 1990 or any later year, not including emissions from:  Rule 219 equipment  rental equipment  on - site mobile sources  ships Excluded Facilities Prohibited from initial inclusion and cannot enter Examples:  dry cleaners  landfill gas operations  police facilities  public transit facilities Not Included Facilities but Allowed to Opt - in Prohibited from initial inclusion but may opt to enter RECLAIM Examples:  hospitals  prisons  schools and universities  ski resorts FACILITY PERMIT Brett Kimberly RECLAIM Facility Permit  Section A – Facility information (address, telephone, contact names, cycle, NOx/ SOx , zone)  Section B – Allocations – listing of year - by - year allocation as of permit issue date  Section C – Plot Plan – never used RECLAIM Facility Permit Section D (designed as a table)  Device description  Device ID # (e.g. D5, D12, C25)  Connection to basic or control device  RECLAIM category (as applicable)  Emission limits (RECLAIM, BACT, different fuels)  Operation conditions RECLAIM Facility Permit Section D permit conditions are annotated as condition numbers, which are fully described at the end of Section D. Example: Condition number - P10.1 Condition description – “This device shall not consume more than 7.2 mmscf of natural gas per month.” RECLAIM Facility Permit  Section E – Administrative Conditions  Section F – Monitoring & Source Testing Requirements  Section G – Recordkeeping & Reporting Requirements RECLAIM Facility Permit  Section H – has the same format as Section D but includes devices under a Permit to Construct or a modification to the existing permit  Construction of devices in Section H may not have been completed or even started yet.  Conditions in Section H apply after construction is completed. RECLAIM Facility Permit  Section I – Plans and Schedules Examples may include:  Only applicable to a facility with a final Title V Permit  Rule 1407 – Non - ferrous metal melting  Rule 1132 – VOC emissions from high - emitting spray booths  Section J – Air Toxics May include requirements from NESHAP or Federal CFR RECLAIM Facility Permit  Section K – Title V Administration Only applicable to a facility with a final Title V Permit  Shows deadlines for Semi - Annual and Annual Compliance Reports  Includes a Table of applicable regulations  Appendix A – Exempt Equipment Lists Rule 219 - exempt NOx and SOx emitting equipment RECLAIM Facility Permit  How to provide input into the permit.  REVIEW CAREFULLY  Contact SCAQMD permitting engineer  Administrative change  Permit appeal process  Rule 216 – 30 days from receipt of notification by SCAQMD QUESTIONS? Natural Gas as Fuel  Natural gas is the most common fuel  All emission calculations are based on standard conditions  RECLAIM set standard conditions as 68 o F and 1 atmospheric pressure  All fuel meters measure at actual fuel condition and must be adjusted to standard conditions Abbreviations - Gas Volumes cf = cubic feet d = dry (absence of all water vapor) s = standard conditions (for RECLAIM, 1 atmosphere of pressure and 68  F. c = hundred m = thousand mm = million h = per hour Abbreviations - Examples ccf = hundred cubic feet mcf = thousand cubic feet mmscf = million standard cubic feet dscf = dry standard cubic feet Other terminology  Btu – British Thermal Unit, amount of heat needed to raise the temperature of 1 pound of water by 1 degree Fahrenheit. (how much heat a fuel will generate)  therm – 100,000 btu or 0.1 mmbtu  Higher Heating Value (HHV) – maximum amount of heat released by fuel combustion, has units of btu /unit of volume  bhp – brake horsepower Other terminology  btu – British Thermal Unit, amount of heat needed to raise the temperature of 1 pound of water by 1 degree Fahrenheit. (how much heat a fuel will generate)  therm – 100,000 btu or 0.1 mmbtu  Higher Heating Value (HHV) – maximum amount of heat released by fuel combustion, has units of btu /unit of volume  CEMS – continuous emission monitoring system Natural gas fuel meter at standard conditions  Option 1 – use automatic electronic pressure & temperature compensator  $$  Very accurate  May involve battery replacement  Option 2 – use manually - calculated pressure & temperature adjustment charts. Must install temperature gauge and pressure gauge (typically psi) on meter side of any pressure regulator  “Do the math” Example Pressure Adjustment Chart PSIG Factor 1 1.045 2 1.113 3 1.181 4 1.249 5 1.317 6 1.385 7 1.453 Factor varies based on altitude of the facility. Chart shown represents approx. 500 ft. altitude. Example Pressure Adjustment Calculation Beginning meter reading a Ending meter reading b Unadjusted fuel usage ( cf ) c=b - a 5 psi adjustment factor d Adjusted fuel usage ( scf ) e=c*d 345000 456000 111000 1.317 146187 Example Temperature Adjustment Chart Degrees F. Factor 66 1.0038 67 1.0019 68 1.0000 69 0.9981 70 0.9962 71 0.9944 72 0.9925 73 0.9906 74 0.9888 75 0.9869 Example Temperature Adjustment Calculation Beginning meter reading a Ending meter reading b Unadjusted fuel usage ( cf ) c=b - a 75 degree F adjustment factor d Adjusted fuel usage ( scf ) e=c*d 345000 456000 111000 0.9869 109546 Combined Temperature/Pressure Adjustment Calculation Beginning meter reading a Ending meter reading b Unadjusted fuel usage ( cf ) c=b - a 5 psi adjustment factor d 75 degree F adjustment factor e Adjusted fuel usage ( scf ) f=c*d*e 345000 456000 111000 1.317 0.9869 144272 MONITORING, REPORTING, AND RECORDKEEPING FOR NON - MAJOR SOURCES Shannon Lee  Rule 219 - Exempt Equipment – equipment not otherwise required to have a permit  Process units  Large sources  Other/misc.  Major sources RECLAIM Device Classifications Monitoring and Reporting Large Source Minor Source* DAILY MONTHLY Major Source QUARTERLY Monitored by CEMS *Process Units and Rule 219 - Exempt Equipment Device Classifications Rule 219 - Exempt Equipment Equipment exempt from requirement to obtain a permit due to very low emission potential. Examples :  External combustion device with max. capacity ≤ 2 mmbtu /hr  Residential - type water heaters  Internal combustion engine ≤ 50 bhp Refer to Rule 219 for complete list Rule 219 Equipment Monitoring, Reporting, & Recordkeeping (MRR)  Monitored by fuel meter, timer, or main gas bill minus other metered equipment  Based on emission factors ( lb/ mmscf or lb/ mgal )  Quarterly meter/timer readings.  Emissions calculated by multiplying emission factor by fuel usage  Quarterly electronic reporting to SCAQMD Rule 219 Equipment Calculations The default emission factor for Rule 219 external combustion equipment fired by natural gas is 130 lbs NOx/ mmscf . 0.5 mmscf x 130 lbs/ mmscf = 65 lbs NOx Device Classifications Process Units Process Units – devices with lower emission potential. Examples :  External combustion device with max. capacity between 10 & 40 mmbtu /hr and annual heat input ≤23 billion btu  External combustion device with max. capacity �2 but mmbtu /hr  Internal combustion engine between 200 & 1000 bhp and operated less than 2,190 hrs/year  Internal combustion engine between 50 and 200 bhp Process Unit MRR  Monitored by fuel meter or timer (or rarely by stack flow monitor)  Based on emission factor (lb/ mmcf or lb/ mgal ) or a concentration limit ( ppmv )  Quarterly meter/timer readings. Quarterly electronic reporting to SCAQMD.  Annual tune - up  For devices with conc. limit, source test every 5 year window of time. Process Unit Calculations For devices with emission factor: Multiply emission factor by fuel usage. 3 mmscf x 100 lbs/ mmscf = 300 lbs NOx For devices with concentration limit: Use same equation as Large Sources with concentration limit, discussed later. Process Unit Calculations - Engines Most smaller engines are monitored by timers. Fuel use increases as load increases. Since it is not possible to continually monitor load, fuel usage determined by manufacturer specified maximum fuel consumption rate. Process Unit Calculations - Engines Example calculation – diesel engine, 469 lb NOx/ mgal emission factor, 30 gal/hr maximum usage rate Starting timer (hr) Ending timer (hr) Hours operated Gallons used mgal used Lbs NOx 15 19 4 120 0.12 56.28 End minus start Hours x max. rate Gallons/1000 mgal x emis . fact. Engine Calculation Alternative If maximum fuel usage rate is unknown, an alternative method is found in Rule 2012, Appendix A, Chapter 4, equation 28. This equation determines heat input based on engine bhp and an assumed efficiency factor. Engine Calculation Alternative If the engine is required by permit condition to have a fuel meter, use fuel meter readings to determine fuel use. Device Classifications Large Sources Large Sources – devices with moderate emission potential. Examples :  External combustion device with max. capacity ≥ 40 mmbtu /hr and annual heat input ≤ 90 billion btu  External combustion device with max. capacity between 10 & 40 mmbtu /hr and annual heat input �23 billion btu  Internal combustion engine ≥ 1000 bhp and operated less than 2,190 hrs/year  Internal combustion engine between 200 & 1000 bhp and operated more than 2,190 hrs/year Large Source MRR  Monitored by fuel meter or stack flow monitor (or rarely by CEMS)  Has concentration limit ( ppmv ) or, in fewer cases, an emission rate (lb/ mmcf or lb/mgal)  Monthly fuel meter readings  Monthly electronic reporting to SCAQMD  Semi - annual tune - up  For devices with conc. limit, source test every 3 year window of time. Large Source Calculations For devices with emission rate: fuel usage x emission rate For devices with concentration limit: Use equation based on mass per volume of stack flow. Concentration Limit Calculations MASS = CONC. x VOLUME For systems with Stack Flow Monitor: lbs. NOx = (NOx ppmv ) x (Stack Flow) x 1.195 x 10 - 7 For systems with Fuel Flow Monitor: lbs. NOx = (NOx ppmv ) x (Fuel Flow) x [20.9/(20.9 - b)] x F d x V x 1.195x10 - 7 Concentration Limit Calculations (Stack flow monitor) e = a x c x 1.195x10 - 7 e = mass of NOx (lbs) a = NOx conc. limit ( ppmv ) c = stack volumetric flow ( scf ) Example: a = 40 ppmv c = 150,000 scf e = 0.72 lbs Large Source concentration limit - Equation 17, Rule 2012, App. A, Chap. 3 For system with Fuel Flow Monitor: E = (NOx ppmv ) x (Fuel flow) x [20.9/(20.9 - b)] x F d x V x 1.195x10 - 7 E = mass of NOx (lbs) NOx ppmv = conc. limit in permit Fuel Flow = mmscf /month or mgal /month b = standard oxygen % for device (3% for external combustion , 15% for engines and turbines) F d = oxygen - based dry F factor for fuel ( dscf / mmbtu ) V = higher heating value of fuel ( mmbtu / mmscf or mmbtu / mgal ) Equation 17, Rule 2012, App. A, Chap. 3 Example: Oven permitted at 45 ppmv burning 10 mmscf of natural gas in a month E = (NOx ppmv ) x (Fuel flow) x [20.9/(20.9 - b)] x F d x V x 1.195x10 - 7 NOx ppmv = 45 Fuel flow = 10 mmscf /month b = 3 F d = 8,710 dscf / mmbtu (for natural gas) V = default value of 1,050 mmbtu / mmscf E = 45 x 10 x [20.9/(20.9 - 3)] x 8,710 x 1,050 x 1.195x10 - 7 E = 574.22 lbs NOx Implications of 3 - year source test for Large source and 5 - year source test for Process unit  Example 1 – concentration limit is 30 ppm NOx. Test result = 25 ppm. Report emissions using 30 ppm. (Test conc. limit, report conc. limit)  Example 2 – concentration limit is 30 ppm NOx. Test result = 35 ppm. Report emissions using 35 ppm until next source test . (Test � conc. limit, report test result until date of passing test) Test res�ult concentration limit is a violation of a permit condition Limitations On Fuel Meter Sharing (Non - Major Sources)  The emission factor or concentration limit or emission rate must be the same, and  The device(s) must have the same reporting frequency (i.e. monthly or quarterly) [Rule 2012(g)(6)] Meter sharing examples Gas Company meter Process Unit 130 lb/ mmscf Process Unit 130 lb/ mmscf Rule 219 130 lb/ mmscf Proportion fuel using any logical means ( e.g. hours used or btu input) Meter sharing examples Gas Company meter Process Unit 130 lb/ mmscf Process Unit 130 lb/ mmscf Large Source 20 ppm Not allowed (monthly and quarterly reporting frequency on same meter and/or different calculation basis) Meter sharing examples Gas Company meter Process Unit 130 lb/ mmscf Process Unit 130 lb/ mmscf Large Source 20 ppm An option to fix the meter - sharing problem Add a dedicated meter Device Classifications Other/Misc.  Various Locations equipment owned by & used at the facility  Rental equipment used at the facility � 72 hours/quarter  Equipment not possessing a valid permit Emissions calculated as if equipment had a permit. Device Classifications Other/Misc. Do not report emissions from:  Rental equipment or Equipment Operated by a Contractor that is operated r.  Equipment operated by a contractor that does not contribute to the manufacturing process.  Mobile equipment (forklift & similar vehicles whose engine drives its wheels). Missing Data Facility recordkeeping and monitoring will not always be perfect. RECLAIM provides for Missing Data Procedures ( MDP ) to substitute a value for an inaccurate or unknown value.  Dependent on device classification  Becomes more punitive as missing duration increases Application of MDP for Non - Major Sources  Rule 2011, App. A, Chapter 3, Par. G  Rule 2012, App. A, Chapter 3, Par. I  Rule 2012, App. A, Chapter 4, Par. G Each has two sub - paragraphs  Alternative, Equivalent Monitoring Device w/in ± 2% Accuracy (i.e. Gas Co. Meter)  MDP based on duration of missing data period Application of MDP for Non - Major Sources Process Unit or Rule 219  If missing data is 1 quarter* - use source's average quarterly fuel usage for the previous 4 quarters.  If missing data is � 1 quarter use source's highest quarterly fuel usage for the previous 4 quarters.  If no records are available – assume source is operating 24 hours a day at maximum rated capacity at an uncontrolled emission factor for each quarter of missing data. (NOx – Rule 2012, App. A, Chap. 4, subpart G) (SOx – Rule 2011, App. A, Chap. 3, subpart G) *If any portion of a quarter is missing MDP applies to the entire quarter. Application of MDP for Non - Major Sources Large Source (NOx – Rule 2012, App. A, Chap. 3, subpart I)  If missing data is 1 month* - use source's average monthly fuel usage for the previous 12 months.  If missing data is � 1 month use source's highest monthly fuel usage for the previous 12 months.  If missing data is � 2 months or no records are available – assume source is operating 24 hours a day at maximum rated capacity at an uncontrolled emission factor for each month of missing data. *If any portion of a month is missing MDP applies to the entire month. Reporting (Interim) From the date your RECLAIM permit is first issued, you have 12 months to install, operate, and implement all monitoring, recordkeeping, and reporting systems. During that time:  Large source – submit a monthly paper emission report to SCAQMD, due by the 15 th of the month following the emission month  Process units & Rule 219 – submit a quarterly paper emission report to SCAQMD, to be included with the QCER (described later) Reporting (Final) No later than 12 months from RECLAIM permit issuance, a facility must fully implement all reporting procedures.  Electronic reporting  Paper certification reporting Electronic Reporting Remember this name! George Haddad SCAQMD Systems Analyst 909 - 396 - 2650 ghaddad@aqmd.gov Contact Mr. Haddad to arrange for your initial password into the electronic reporting system and for information on any problems you may be having. Electronic Reporting 2 reporting options for non - major sources  Using a modem and communication software. Contact Mr. Haddad for details.  Recommended option – over the Internet. The public interface with SCAQMD is known as WATERS (Web Access to Emissions Reporting System).  www.aqmd.gov/waters Electronic Reporting Rule 2012, App. A, Chap.7 Electronic reporting codes, up to 4 columns: 1 st column – transmission identifier 1 – original record, 2 – updated a record, 3 – to delete a record 2 nd column – pollutant type N = NOx, S = SOx 3 rd column – RECLAIM category M = major, L= large, P= process, R = Rule 219 4 th column – reporting frequency or reporting description M = monthly, Q = quarterly, F = by fuel type Electronic Reporting Frequency  Large source – monthly, report due by the 15 th day of the following month. Report for each individual device by device ID and the monthly total for all Large sources (NLM code) ( ***see next slide )  Process unit – quarterly, report due by the 30 th day after the end of the first 3 quarters, 60 th day after the last quarter Report for each individual device by device ID and the quarterly total for all Process units (NPQ code)  Rule 219 – quarterly, report due by the 30 th day after the end of the first 3 quarters, 60 th day after the last quarter Report total aggregate emissions for each fuel type Example – NRF for natural gas or NRF for diesel Electronic Reporting Frequency *** At the quarterly level, also report quarterly emissions for Large sources and Major sources as applicable  Quarterly aggregate emissions for all Large sources – NLQ  Quarterly aggregate emissions for all Major sources - NMQ Paper Certification Reporting Quarters 1, 2, and 3 of Compliance Year (including the interim year) Submit the Quarterly Certification of Emissions Report (QCER)  One page document  Blank form can be found at: http://www.aqmd.gov/permit/Formspdf/RECLAIM/AQMDFormQCER.pdf  Due 30 days after the end of the quarter  You will NOT be reminded to submit this!! Paper Certification Reporting Final quarter of Compliance Year (including interim year) Submit the Annual Permit Emissions Program report (APEP).  SCAQMD will mail you the official APEP forms on colored paper  You must return the colored papers with a “wet” signature by the responsible official  Due by the 60 th day after the end of the last quarter  Other than receiving your paper APEP copy, you will NOT receive any other reminder! QUESTIONS? RTC TRADE AND RECONCILIATION Susan Tsai RTC Accounts  Allocation Account  Used for compliance determination  Used for reported/audited emission deductions  Certificate Account  Used for holding excess RTCs  Used for RTCs for trading purpose only  Coastal facility holding non - usable Inland RTCs Buy into or Sell from Both Accounts Trade Account Registration Form 2007 - 1  Trader Info  RTC Data  Emission Data Submit Trade Negotiate Trade Trading Process Signed Trade Registration Data Entry/System Checks Trade Confirmation Approved Negotiated Trade  Trading Partners  Other RECLAIM facilities  Individual RTC Holders  Brokers  Agree Upon Price & Quantity  Future RTC Trading Allowed Trade Registration Form 2007 - 2 Submit Trades  Joint Registration Signed by both Parties  Quantity and Type of RTC  Relevant Data (Price, Generation, Use)  Report to AQMD within 5 business days Trade Approval  Registered Representatives  RTC Availability (balance, emissions)  Multiple Approval Levels  Update Buyer and Seller Accounts  Buyer and Seller Confirmation Letters Approved Trade Confirmation Letter Trade Posting on AQMD Website ftp://ftp.aqmd.gov/pub/rtc/rtc_listing.xls  All Trades Submitted Last 90 - Days  Check Recent RTC Trading Prices  Check Trade Registration Status QUESTIONS? What is Reconciliation? * Be careful with “cross - cycle” RTCs! RECLAIM emissions RTCs in facility’s Allocation Account usable for the same period*  96 Reconciliation Schedule  Reconcile quarterly emissions within 30 days after the ends of quarters 1, 2, and 3;  Reconcile year - to - date emissions within 30 days after the ends of quarters 1, 2, and 3;  Reconcile quarterly emissions within 60 days after the end of quarter 4; and  Reconcile annual emissions within 60 days after the end of quarter 4. 97 Reconciliation Steps  Review records and verify emissions reports  Submit quarterly electronic emissions reports  Submit applicable paper report (QCER or APEP)  Compare emissions to usable RTCs in Allocation Account  Acquire RTCs through trading if RTCs held ns  May sell excess RTCs if RTCs held � emissions  Many facilities choose to maintain precautionary compliance margin of 10 - 20% Reconciliation Example 4/1 10/1 1/1/2014 7/1 1/1/2015 Emissions: 1,000 lb Holdings: 1,000 lb 1,000 lb 1,000 lb Cycle 1 Facility Cycle 2 2013 (Expire 6/2014) Cycle 1 2014 (Expire 12/2014) Cycle 2 2014 (Expire 6/2015) 0 4,000 0 2,000 0 2,000 1,000 2,000 1,000 3,000 1,000 0 QUESTIONS? MRR FOR MAJOR SOURCES Don Nguyen Device Classifications Major Sources Major Sources – devices with greatest emission potential. Examples:  External combustion device with max. capacity ≥ 40 mmbtu /hr and annual heat �input 90 billion btu  External combustion device with max. capacity ≥ 500 mmbtu /hr  Internal combustion engine ≥ 1000 bhp and operated more than 2,190 hrs/year Major Source Interim Reporting  Applicability  Applicable for facilities entering RECLAIM with major sources, and  Facilities in RECLAIM adding major sources  Calculation  Mass = Permitted Emission factor x fuel usage  Reporting  Monthly emissions by device  Hard copy reports due 15 days after end of each month  No later than 12 months after entry for facility entering RECLAIM  No later than 12 months after start - up of new major source at RECLAIM facility Major Source MRR  Monitored by Continuous Emission Monitoring System (CEMS)  Daily automatic electronic reporting  Data archiving 15 - min. data = min. 48 hrs ≥ 15 - min. data = 3 yrs (5 yrs, if Title V)  Daily calibration and semi - annual or annual Relative Accuracy Test Audits ( RATAs)  Back - up paper strip chart recorder or electronic data logger CEMS Configuration NOx Analyzer O2 Analyzer Fuel Meter Data Acquisition Device RTU Modem To SCAQMD Sampling Probe Heat Trace Line (umbilical) CEMS shed Sample Conditioning System Instrument Panel Typical Analyzer Calibration (Span) Gases Stack Flow Measuring Device Type S pitot tube CEMS Application  Before installing CEMS or modifying existing CEMS, submit an application to SCAQMD Source Testing group.  Receive Provisional Certification  Complete installation and testing  Receive Final Certification  Start this process early Work with Source Testing engineer to resolve questions/concerns Daily Calibrations  Concentration ≤ 5% span range,  O 2 ≤ 1%, or  Flow ≤ 6% span range  Test Period On each day during which the unit combusts any fuel or processes any material (“unit operating day”) RATA Testing Concentration (ppm) limit: ≤ 20% Flow Rate limit: ≤ 15% Mass Emission Rate limit: ≤ 20% If all 3 standards are ≤ 7.5%, subsequent test may be conducted annually (within 12 months of the end of the calendar quarter in which the CEMS was last tested). If any standard is � 7.5%, subsequent test must be conducted semi - annually (within 6 months of the end of the calendar quarter in which the CEMS was last tested). RATA Testing (Bias Adjustment Factors) RATA will calculate bias adjustment factors (BAFs) for concentration, stack flow, and mass emissions. You are required to include BAF in emission calculations using 1 of 2 options: Emission rate BAF alone or Concentration and stack flow BAFs together Precise but not Accurate Precise and Accurate Bias Factor Reasoning Other Major source testing and maintenance  As prescribed by QA/QC plan  Filter & diaphragm replacement  NOx converter efficiency check  As applicable to other regulations  Rule 218 CO calibrations and CGAs  Federal CFR CGAs or linearity  Orifice plate fuel meters must be calibrated annually Major Source Calculations Must be autonomous MASS = CONC. x VOLUME For CEMS with Stack NOx Concentration Analyzer & Stack Flow Monitor: NOx = (NOx ppmv ) x (Stack Flow Rate) x 1.195 x 10 - 7 Equation 1, Rule 2012, App. A, Chap. 2 e = a x c x 1.195x10 - 7 e = mass of NOx (lb/hr) a = stack conc. of NOx (ppmv) c = stack volumetric flow rate (scfh) Example: a = 40 ppmv c = 150,000 scfh e = 0.72 lb/hr Major Source Calculations MASS = CONC. x VOLUME For CEMS with Stack NOx Conc. Analyzer, Oxygen Analyzer, & Fuel Flow Monitor: For systems with Fuel Flow Monitor: lbs. NOx = (NOx ppmv ) x (Fuel Flow) x [20.9/(20.9 - b)] x F d x V x 1.195x10 - 7 Equation 2, Rule 2012, App. A, Chap. 2 e = (NOx ppmv ) x (Fuel flow) x [20.9/(20.9 - b)] x F d x V x 1.195x10 - 7 e = mass of NOx (lb/hr) NOx ppmv = measured stack conc. of NOx ( ppmv ) Fuel flow = mmdscfh b = stack conc. of oxygen (%) F d = oxygen - based dry F factor for fuel ( dscf / mmbtu ) V = higher heating value of fuel ( mmbtu / mmscf ) [1050 or As measured by contin . analyzer] Equation 2, Rule 2012, App. A, Chap. 2 e = (NOx ppmv ) x (Fuel flow) x [20.9/(20.9 - b)] x F d x V x 1.195x10 - 7 e = mass of NOx (lb/hr) NOx ppmv = 40 ppmv Fuel flow = 0.05 mmdscfh b = 3.5 % F d = 8,710 dscf / mmbtu (for natural gas) V = 1,050 mmbtu / mmscf (default value for natural gas) e = 40 x 0.05 x [20.9/(20.9 - 3.5)] x 8710 x 1,050 x 1.195x10 - 7 e = 2.63 lb/hr Major Source CEMS Calculations PPM FLOW MASS Sub - 15 min CEMS CEMS 15 - min Avg. valid Sub - 15 min Avg. valid Sub - 15 min 15 - min ppm x 15 - min flow Hourly Avg. valid 15 - min ppm Avg. valid 15 - min flow Avg. of valid 15 - min mass Daily ∑ Hourly MDP for Major Sources  Dependent on historical availability of analyzers and duration of missing period  Procedures for Missing NOx/SOx Concentration Data  Procedures for Missing Stack Exhaust Gas Flow Rate Data  Procedures for Missing both NOx/SOx Concentration and Stack Exhaust Gas Flow Rate Data Availability of Concentration or Stack Flow Monitors W=Y/Z x 100 %, where:  W= the percent annual monitor availability (W can be � 100 % if equipment is operated less than 24 hours per day, 7 days per week)  Y = the total operating hours for which the monitor provided quality - assured data during the period from the date the NOx pollutant concentration/flow monitoring analyzer was provisionally certified or 365 days prior to the current date (not counting the current day), whichever date is later, to the day previous to the current date.  Z = the total operating hours of the affected piece of equipment during the period from the date the NOx pollutant concentration/flow monitoring analyzer was provisionally certified or 365 days prior to the current date (not counting the current day), whichever date is later, to the day previous to the current date. Missing NOx Concentration Data Missing Data Time Period (x) CEMS Availability (w) x ≤ 3 hrs 3 hrs < x ≤ 24 hrs x� 24 hrs w ≥ 95% 1N Procedure Attachment A Max. hourly recorded conc. for prev. 30 days 90% ≤ w < 95% avg. recorded conc. of hr. before and after Max. hourly recorded conc. for prev. 30 days Max. hourly recorded conc. for prev. 365 days w 90% Lifetime Max. recorded hourly conc. of CEMS Missing Stack Exhaust Gas Flow Rate Data Missing Data Time Period (x) CEMS Availability (w) x ≤ 3 hrs 3 hrs < x ≤ 24 hrs x� 24 hrs w ≥ 95% 1N Procedure Attachment A Max. hourly recorded flow for prev. 30 days 90% ≤ w < 95% avg. recorded flow of hr. before and after Max. hourly recorded flow for prev. 30 days Max. hourly recorded flow for prev. 365 days w 90% Lifetime Max. recorded hourly flow of CEMS MDP for Mass (Apply when both Concentration & Flow are Missing) z = Lower of concentration or flow availability Missing Data Time Period (x) CEMS Availability (z) x ≤ 3 hrs 3 hrs < x ≤ 24 hrs x� 24 hrs z ≥ 95% 1N Procedure Attachment A Max. hourly valid mass for prev. 30 days 90% ≤ z < 95% avg. valid mass of hr. before and after Max. hourly valid mass for prev. 30 days Max. hourly valid mass for prev. 365 days z 90% Lifetime Max. valid hourly mass of CEMS Tiers of Major Source MDP Tiers 1N Procedures per Attachment A Avg. valid hr before and after Max. valid hourly recorded value for prev. 30 days Max. valid hourly recorded value for prev. 365 days Lifetime Max. valid hourly recorded value of CEMS Max. Rated Capacity, 100% Uptime, & Uncontrolled Emission Factors Major Source Electronic Reports  Daily transmission via modem, due by 5 p.m. of following day. Must happen automatically.  Emissions and Status Codes  Qualitative Report of CEMS Operation for the Day  Does not necessarily represent the whole day Major Source Status Codes  Status Flags Table [1=True, 0=False] Field Description Valid Data If valid data was obtained for the entire reporting period Calibration If the monitoring system was calibrated during the reporting period Off - line If the monitoring system was off - line at anytime during the reporting period Alternative Data Acquisition If alternative data acquisition was used during the reporting period Out of Control If the CEMS was out of control during the reporting period Fuel Switch If more than one fuel type was used during the reporting period 10% Range If concentration was reported at 10% valid range when concentration value was below 10% Lower than 10% Range If concentration was reported at an actual value less than 10% valid range Non - operational If the RECLAIM source being monitored is non - operational for entire day Major Source Reported Values record type device id amt rpt date transmt date valid data calib. offline alt data out of ctrl fuel switch range 10p low range non op reference_nbr NM 41 7.63 8/25/2006 0:00 8/26/2006 10:09 1 1 0 0 0 0 0 0 0 Cabc106238100928 NM 41 7.43 8/26/2006 0:00 8/27/2006 10:09 1 1 0 0 0 0 0 0 0 Cabc106239100930 NM 41 0 8/27/2006 0:00 8/28/2006 10:09 1 1 0 0 0 0 0 0 1 Cabc106240100935 NM 41 7.13 8/28/2006 0:00 8/29/2006 10:09 1 1 0 0 0 0 0 0 0 Cabc106241100938 NM 41 9.55 8/29/2006 0:00 8/30/2006 10:09 0 1 0 0 0 0 0 0 0 Cabc106242100938 Major Source Electronic Reports  Must also send monthly aggregate of all major sources ( e.g. NMM for NOx) and quarterly aggregate of all major sources ( e.g. NMQ for NOx).  Transmitted automatically by the Data Acquisition System (DAS). QUESTIONS? Contacts RECLAIM Hotline (909) 396 - 3119 George Haddad (Questions concerning Username/Password Setup for Electronic Reporting of Emissions) (909) 396 - 2650