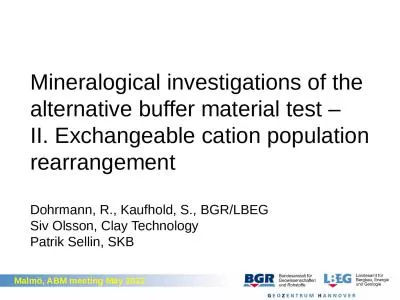
II Exchangeable cation population rearrangement Dohrmann R Kaufhold S BGRLBEG Siv Olsson Clay Technology Patrik Sellin SKB Motivation and questions Large differences of initial and final exchangeable cation population of 10 blocks reported during 2010 meeting ID: 277391
Download Presentation The PPT/PDF document "Mineralogical investigations of the alte..." is the property of its rightful owner. Permission is granted to download and print the materials on this web site for personal, non-commercial use only, and to display it on your personal computer provided you do not modify the materials and that you retain all copyright notices contained in the materials. By downloading content from our website, you accept the terms of this agreement.
Slide1
Mineralogical investigations of the alternative buffer material test –
II. Exchangeable cation population rearrangement
Dohrmann, R., Kaufhold, S.,
BGR/LBEG
Siv Olsson, Clay Technology
Patrik Sellin, SKBSlide2
Motivation and questions
Large differences of initial and final exchangeable cation population of 10 blocks reported during 2010 meeting
Open questions:
- confirm this trend for more blocks
- vertical profiles
- Ca
2+
dominating in the top region?
- influence of cement at the top
- combination of all data sets availableSlide3
BGR samplingSlide4
Available blocksSlide5
I. horizontal variationSlide6
values of JNB-17 can be averaged
contact
xx xx
possibly
clinoptilolite
dissolution?Slide7
Typical lateral variation
Ca
2+
Na
+Slide8
No horizontal variation found for non-contact samples.
This trend was confirmed for the other blocks.
-> avarge values of reacted blocks were calculated and compared with initial compositionSlide9
values of reference blocks
All values were measured, some were corrected:
CEC%EC ‘MX80 granulate + quartz’ = MX80 x 0.7 according to a quartz content of 30 wt.%.
Na
+
(Ca
2+
) values of blocks 9 and 25 were corrected to give Na
+
=100‑K
+
‑Mg2+-Ca2+
Ca2+ values of block 22 were corrected to give Ca2+=100‑Na+‑K+
‑Mg2+. Slide10
values of reacted blocks
Ca
2+
values of blocks 9, 22, and 25 were corrected to give Ca
2+
=100‑Na
+
‑K
+
‑Mg
2+
. Ethanolic NH4Cl-EC values of such samples were recalculated using the measured reference CEC to avoid largely inflated Ca
2+ percentages and accordingly diminished percentages for Na+, K+, and Mg2+.
Slide11Slide12
initially after exp. difference
EC %Slide13
initially after exp. difference
EC meq/100 gSlide14
chloride transport
Figures taken from ABM status reportSlide15
lesson learned I
horizontal variation of ECs and Cl
-
was small
CEC was lowered (5 %)
Na
+
: 48% initially,
39
% after exp.
(
36->26)Mg2+: 18% initially, 15 % after exp.
(13->10)Ca2+: 32% initially, 45
% after exp. (24->34)K+
: 3% initially, no changes (2) (values in meq/100 g)
8 non-examined Na
+
blocks: 6MX80, IKO, JNB
plus COXSlide16
lesson learned II
Ca
2+
gain pronounced in upper 7 blocks
Blocks 24-30:
- Na
+
: 63% initially,
33
% after exp.
- Ca
2+: 20% initially, 53 % after exp.The smallest absolute redistribution of all bentonites was found in MX80 at position 2 (14 meq/100 g). For the same material also up to 46 meq/100 g were recorded at the other end of the test parcel.
Slide17
lesson learned III
No correlation of the extent of the redistribution of the exchangeable cation population with the peak temperatures could be identified
The total amounts of redistributed cations do not correlate with the CEC (R²=0.01)
Slide18
gaines and losses
of individual blocksSlide19
influence of neighbouring blocks
A
n+
>>B
n+
,C
n+
A
n+
≈
B
n+ ≈ Cn+(not for ASHA)Slide20
lesson learned IV
The influence of neighbouring blocks on cation redistribution during the ABM experiment was low
Obviously not only the material composition of the adjacent blocks was important for the adsorption behaviour but the position within the test parcel
Slide21
vertical exchangeable
cation profileSlide22
% / CEC
meq/100 g
CEC of IKO is approximately 15-20% larger than MX80
Slide23
lesson learned V
In vertical exchangeable cation profiles of the two adjacent blocks MX80 (No. 11) and IKO (No. 10) all exchangeable cations show bi-modal concentration distributions with gaps of
2% / 5% / 7% for
Mg
2+
/ Ca
2+
/ Na
+
-> different selectivities?
Mg2+ was transported from IKO into MX80 but not into FRISlide24
influence of the cement plug on top of the parcelSlide25Slide26
Vertical trend was confirmed (less samples)
Horizontally no changes but ≈ 5-10 % less Ca
2+
in the outer parts (closer to the rock)Slide27
lesson learned VI
The so-called top blocks (No. 29 and 30) showed the opposite behaviour than expected.
Ca
2+
and Mg
2+
increased downwards from the outer part of block 30 to the lower part of block 29 while Na
+
decreased. Mg
2+
increased from 6 to 14 %.
Horizontally no changes but ≈ 5-10 % less Ca2+
in the outer parts (closer to the rock), however MX80 contains soluble Ca-minerals which could have overprinted Ca2+.This vertical process is still unclear because overall Ca
2+ was enriched in the upper parcel region, so what was the driving force (temperature ?)?Slide28
Ca
2+
sources
Ca
2+
increased while Na
+
and Mg
2+
decreased
ÄSPÖ water:
≈ 2500 mg/L Na+ and Ca2+ each, ≈ 8500 mg/L Cl-
, and ≈ 500 mg/L SO42-; Mg2+, Br-
, and K+ (all < 100 mg/L)
Carbonates: high TIC in Dep.CAN, IBE but didn’t change in bulk blocksSulfates: high total S in Dep.CAN, FRI but didn’t change largely in bulk blocksSlide29
Thank you