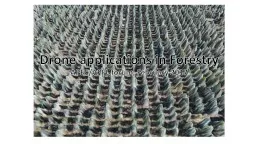
Forest Inventory Systems and Lidar Operationalizing Lidar in Forest Inventory Tod Haren 1252016 Olympia WA Introductions Overview of ODF State Forests Inventory Tool Chain Stand Level Inventory ID: 592070
Download Presentation The PPT/PDF document "Oregon Department of Forestry" is the property of its rightful owner. Permission is granted to download and print the materials on this web site for personal, non-commercial use only, and to display it on your personal computer provided you do not modify the materials and that you retain all copyright notices contained in the materials. By downloading content from our website, you accept the terms of this agreement.
Slide1
Oregon Department of ForestryForest Inventory Systems and Lidar
Operationalizing Lidar in Forest Inventory
Tod Haren
1/25/2016 – Olympia, WASlide2
IntroductionsOverview of ODF (State Forests)Inventory Tool Chain
Stand Level Inventory
Data ManagementStand Level ImputationLidar ProcessingLandsat ProcessingRandomForests ImputationWhat is being inventoriedWho is being servedWhat outputs are producedHow are species handledHow are outputs integrated with existing systemsHighest priorities for improvementSlide3
ODF Staff PresentJeff Firman – Forest Inventory SpecialistMike Wilson – GIS and Information Specialist
Sephe Fox –
GIS and Information SpecialistJosh Clark – Modeling Lead, Forest PlanningTod Haren – Forest Resource AnalystSlide4
ODF – State Forests800,000+ acres under management
3% of Oregon’s forested land
Operations funded by timber sale revenueNine management districtsSix state forestsSlide5
Common School LandEvery 16th and 36th section granted at statehood
Forested parcels managed by ODF under agreement with DSL
Net timber sale revenue contributed to the Common School FundODF is reimbursed for management costsElliott State Forests~84,000 acres resulting from a series of land tradesSlide6
Board of Forestry LandAcquired from counties following tax foreclosure
Tillamook burn
1933, 1939, 1945, 1951350,000+ acresPlanting and rehab continued into the 1970’sManaged for “Greatest Permanent Value”63.75% of timber sale revenue distributed to the county in which harvest occursSlide7
Stand Level InventoryFBRI - Forest Projection System (v6.4+)
Designed for traditional double sampling
Stands delineated on dominant vegetationStratification using the FPS veg_lbl methodDominant species; size class; stocking levelInitiated in ~2000 to support reporting needs anticipated for the then new forest management plans.Additional fields and tables addedMS Access front-end developed with significant VBA codeIn-house developed field data collection software using DataPlusSlide8
Stand Level InventoryOriginally promoted decentralized i
nventory to give more local control
Local control quickly became burdensomeAttrition, burnout, inadequate training, etc.Standards were not being enforcedReporting and analysis was inconsistent and cumbersomeSalem is now taking a more active rollMost annual updates funneled through the inventory specialistMore communication and coordinationMigration to a central database - SQL Server and ArcGIS/SDEImproved access to current and historic data
Ready access to pertinent information for all staff
Better systems integration
Annual updates and “ROOTS” still require individual Access databasesSlide9
Stand Level InventoryInitial goal was to maintain 50% of stands
as recently cruised
In 2008 Tillamook undertook a significant re-typingMany cruised stands were split, invalidating plot designRetained plots are questionable due to reconfiguration of standsSampling curtailed due to budget cuts in 2009Reinitiated in 2015NW Planning area inventory status (2014)Slide10
Stand Level InventoryProportional sample allocation by strata
Some input from field based on operational priorities
Plots located along lines to represent typical cover, crossing topographic features and elevation gradientTypically 16-24 plots per standSlide11
Stand Level InventoryNested plot design
Large tree variable radius
Small trees, snags, understory fixed radiusDown wood line transectSpecies, DBH, Damage for all treesHeights subsampled by speciesSite trees selected from dominant & codominant canopyNo radial incrementNo upper stem measurement (form)Plots not geo-located, mapped points are preliminarySlide12
Stand Level InventoryConverted from strata expansion to imputation in 2008Better representation of variability across the landscape
Forester “best guess” assignment of cruised to non-cruised stands
No formal validation processTillamook – 6000+ stands, only 20% cruised (fewer in 2008)Less confidence in imputation as inventory agedMaintenance became burdensomeSlide13
Tillamook ImputationRoughly 70%
lidar
coverage by 2011Central swath covered in 2012NE corner partially flown in 2015Slide14
Tillamook Imputation2012 Cooperative agreement with RMRS, Moscow, ID to develop imputation methods using
lidar
and landsatHudak, Andrew T.; Haren, A. Tod; Crookston, Nicholas L.; Liebermann, Robert J.; Ohmann, Janet L. 2014. Imputing forest structure attributes from stand inventory and remotely sensed data in western Oregon, USA. Forest Science. 60(2): 253-269.All stands projected to each of the lidar flight yearsTested multiple imputation methods, MSN, GNN, RandomForestsTested imputation of stand signatures onto pixelsSelected RandomForests stand level imputationDependent variables included: TPA; BAA; SDI; CCF; HT; QMD; Tot VPA;
Merch
VPA; Tot Carbon
Nine independent variables selected based on scaled importance
Lidar: Top
Ht
; Return density in vertical strata; 25
th
pct
ht
Landsat: Brightness; Greenness; Wetness; Topographic variables
Evaluated plot level imputation, but results were very poor due to lack of geo-locationSlide15
Tillamook ImputationLidar imputation:
Observed vs. Imputed
Stand level vs. Pixel levelA&B – Stand to standC&D – Stand to pixelLandsat pixel level is even more skewed toward meanSlide16
Tillamook ImputationComparison with 402 stands cruised in 2010
Plot compares difference between imputed and cruised VPA
Landsat and lidar compare observed values with nearest neighbor402 stands cruised in 2009 compared with the previous imputation assignmentsStrata Exp compares against strata averageSlide17
Tillamook Imputation – 2014 UpdateAdditional cruised stands
Central swath
lidar data, ~90% total coverageAll stands grown to 2012Included additional dependent variablesReduced the precision for any one variableBetter(?) representation of key structure variablesIntegrated landsat and lidar, top 40 variables in final modelLidar variables most important for basic stand attributesLandsat variable became important as species and structure attributes were added.Slide18
Tillamook Imputation – 2014 Update
2014 Observed vs Imputed
TotalCubic VPA; Scribner VPA; TPA >=8”; SDI >=8”; Top Ht; Top QMD; BAA Std DevConiferScribner VPA; SDI >=8”; TPA >= 8”DF; WH; RAScribner VPA; Top HtSlide19
Imputation ToolsPython
PyODBC
- SQL Server and MS Access data managementLiblas - Catalog lidar (laz) datasets OGR - Tiling lidar catalogs, post processing pixel level dataParallel Python - Asynchronous execution of Fusion callsSQLite - Aggregation of tiled Fusion metrics
Need to evaluate the
SciKit
-Learn package
RandomForest
implementation as well as many other machine learning algorithms
R
YaImpute
-
RandomForest
model development and evaluation
GGPlot2
-
PlottingSlide20
ODF Forest InventoryWho is being served
Field foresters – Annual operational planning; T&E assessment
DSL & Counties – Annual reportingBOF, Stakeholders, Managers – Long-range planning; harvest modeling; growth and yield analysisWhat outputs are producedStatic reports – Cruise stats; stand tablesGeoPlanner – GIS overlays, SQL stored procedures generate dynamic stand summaries and prescription analysisYield tables – SQLite database integrated with Patchworks harvest scheduling software.Slide21
ODF Forest InventoryHow are species handled
Stand level imputation is single nearest neighbor
Target stand assumes all plot attributes of the source standSpecies level stand attributes are included in the imputation modelLandsat multispectral variables, tasseled cap, band rations, veg. indices improved species level response in the imputation modelIntegrating with existing systemsImputation assignments stored in the [ADMIN] database table and used as a foreign key to the cruise tablesSlide22
ODF Forest InventoryHighest priorities for improvementEvaluation of small area estimation and pixel based methods
What efficiencies can be gained – Fewer field samples, lower cost
What is the potential for increased information (precision and accuracy)Need more working examples of alternative inventory methodsWhat are the costs; what is to be gainedHow do the results compare with stand based samplingExamples of integration with growth and yield, eg. tree list generation
If we ultimately stick with stand based inventory
Does our sampling design adequately represent within stand variation
Could we use a multiple neighbor approach
What about separate imputation models for subsets of stand attributes
Data management becomes tricky with anything beyond single neighbor