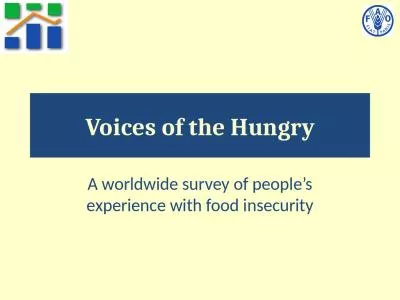
/
Voices of the Hungry Voices of the Hungry

Voices of the Hungry - PowerPoint Presentation

yoshiko-marsland
yoshiko-marsland . @yoshiko-marsland
Follow
388 views
Uploaded On 2015-09-24

Voices of the Hungry - PPT Presentation

A worldwide survey of peoples experience with food insecurity Background amp Motivation FAO has the mandate to monitor progress towards the achievement of the hunger target of MDG 1 and the WFS target ID: 139559

insecurity food eat fies food insecurity fies eat security severity household ate indicators hunger monitoring hungry scale experiences national data worried seguridad

Share:

Link:

Embed:

Download Presentation from below link

Download Presentation The PPT/PDF document "Voices of the Hungry" is the property of its rightful owner. Permission is granted to download and print the materials on this web site for personal, non-commercial use only, and to display it on your personal computer provided you do not modify the materials and that you retain all copyright notices contained in the materials. By downloading content from our website, you accept the terms of this agreement.


Presentation Transcript

Slide1

Voices of the Hungry

A worldwide survey of people’s experience with food insecuritySlide2

Background & Motivation

FAO has the mandate to monitor progress towards the achievement of the hunger target of MDG 1 and the WFS target

Prevalence of Undernourishment (

PoU

) as a measure of the extent of chronic food deprivation (Official MDG Ind. 1.9)

FAO

food

security

monitoring

: a long

history

...

World

Food

Surveys

(1946, 1952, 1963, 1977, 1987, 1996)

The State

of

Food

Insecurity

in the World (1999 - 2013)

...

always

debated

FAO International Symposium 2002

CFS Round

Table

2011

Yet

another

FAO International Symposium 2012Slide3

Background & Motivation

Monitoring food security worldwide is a challenge:

Food security is a multidimensional phenomenon: multiple indicators required

Lack of a global standard: over 200 indicators proposed

Trade off between “best” operational definition of food insecurity and feasibility/sustainability of the data collection

Global monitoring:

need for comparable data across countries on an annual basis with limited time lag

National monitoring:

need for disaggregated data to identify vulnerable groups and vulnerable areas as well as possible determinants in order to support policy interventions (annual monitoring not needed and too costly)Slide4

MDG

1.9 = Proportion of population below minimum level of dietary energy consumption

Probabilistic model referred to a representative consumer

:

Probability that a randomly selected individual regularly consumes an amount of calories insufficient for conducting an active and healthy life

Main limitations:

very complex to calculate; narrow concept of inadequate food access (calories); not measuring short-term crises; only available at national levelNot based on a headcount as the poverty rate: individual energy requirements are virtually unobservableMistakenly described as an indicator of food supply only: combining information on food availability and food access at the macro and micro level

The Prevalence of Undernourishment (

PoU

)Slide5

Background & Motivation

Other indicators are also problematic:

Children underweight/stunted

Multiple causes, not only food insecurity (e.g. diseases and infections)

South East Asia paradox (prevalence higher than in SS Africa)

Information only on one segment of the population

Similar problems of timelinessAdditional problems of coverageIFPRI Global Hunger Index:It is plagued by the same problems of the individual indicators on which it is based (PoU, Child underweight, Child mortality) Aggregates different indicators with no clear rationale for the aggregation functionSlide6

Background & Motivation

Need to improve our ability to monitor food insecurity at the global and national level

Food security and nutrition has taken center stage in the

Post 2015 development agenda

The UN S.G. launched already the “Zero Hunger” challenge (5 targets)

FAO response

Revise its methodology for estimating the PoUDevelop a suite of indicators to monitor the 4 dimensions of food security (availability, access, utilization, stability) => CFS mandate The Voices of the Hungry project: a new metric system for monitoring food access, one of the dimensions of food security for which indicators are largely missingSlide7

Measure the

inability to access adequate food

in terms of quantity and quality (and the associated “welfare”)

Identify

various degrees of food insecurity

experiences (mild, moderate, or severe);

Assess food insecurity experiences at the individual level, thus allowing proper analysis of gender related food insecurity disparities;Indicator based on sound methodology (Item-Response Theory) Ensure timely monitoring of the prevalence of people experiencing food insecurity for all developing countries in the world on an annual basisA leading indicator of potential malnutrition outcomes (link to the SUN initiative)

VoH

project:

Main BenefitsSlide8

A new approach started in the 1990s

Dr. Kathy L.

Radimer’s

Ph.D. dissertation: “Understanding Hunger and Developing Indicators to Assess It”, Cornell University, August 1990

“The lack of an operational definition for hunger has been frequently cited as a barrier to progress in addressing the problem.”

“Three scales, one each for household, women’s, and children’s hunger, emerged and were found to be valid and reliable indicators for measuring hunger directly

”(Radimer et al., 1992)Establishes the concept of food insecurity as an experiential constructSlide9

Quite a history since….Slide10

The food insecurity

experience scale (FIES)

The

severity of the constraints

in accessing food is reflected in

typical experiences:

People start being worried about how to get food and thinking of giving up other expenses; Then limit the variety/quality; Then will start reducing quantities (cutting portions, skipping meals)Eventually will reach the point of being exposed to hungerDifferent levels of severity have different consequences:Mild food security - > welfare reduction due to reduction of other consumption (education, health insurance,

etc

)

Moderate food insecurity - > bad quality of food, unbalanced diets, various forms of malnutrition, including obesity and other NCD

Severe food insecurity - > undernourishment and hungerSlide11

The

food insecurity

experience scale (FIES)

Food

security

Food insecurity

mild

moderate

severe

consequences

Undernutrition

(stunting, wasting)

Welfare reduction

(Psychological costs, reduction of other essential expenses)

Malnutrition

(obesity,

micronutrient deficiencies,

reduced work capacity)

Starvation

Wellbeing

The FIES: a set of questions spanning the range of experiences

Worries

Compromising food

quality and variety

Hunger

Compromising

food quantity

experiencesSlide12

The (current version of the) FIES

“During

the last 12 months, was there a time when, because of lack of money or other resources

:

You

were worried you could not get enough food to eat? You were unable to eat healthy and nutritious food? You ate only a few kinds of foods?

You

had to skip a

meal?

You

ate less than you thought you

should?

Your

household

ran out of food?

You

were

hungry

but did not

eat?

You

went without eating for a whole day

?”Slide13

The (current version of the) FIES

“During

the last 12 months, was there a time when,

because of lack of money or other resources

:

You were worried you could not get enough food to eat? You were unable to eat healthy and nutritious food? You ate only a few kinds of foods?

You

had to skip a

meal?

You

ate less than you thought you

should?

Your

household

ran out of food?

You

were

hungry

but did not

eat?

You

went without eating for a whole day

?”

The qualifier is important, to make sure

experiences refer to food insecurity and

not to other possible reasons

(health, culture, normal seasonality, etc.)Slide14

The (current version of the) FIES

“During

the last 12 months

,

was there a time when, because of lack of money or other resources

:

You were worried you could not get enough food to eat? You were unable to eat healthy and nutritious food? You ate only a few kinds of foods?

You

had to skip a

meal?

You

ate less than you thought you

should?

Your

household

ran out of food?

You

were

hungry

but did not

eat?

You

went without eating for a whole day

?”

Can be adapted to shorter reference periods, when the survey is repeated over different seasons/periods to explore shorter term dynamics in food insecurity. Slide15

The (current version of the) FIES

“During

the last 12 months, was there a time when, because of lack of money or other resources

:

You

were worried you could not get enough food to eat? You were unable to eat healthy and nutritious food? You ate only a few kinds of foods?

You

had to skip a

meal?

You

ate less than you thought you

should?

Your

household

ran out of food?

You

were

hungry

but did not

eat?

You

went without eating for a whole day?”

When households are sampled, instead of individuals, it can be adapted to refer to the household (ex. “you or any other member of your household”).

Care should be given to select the most appropriate respondent.Slide16

The (current version of the) FIES

“During

the last 12 months, was there a time when, because of lack of money or other resources

:

You

were worried you could not get enough food to eat? You were unable to eat healthy and nutritious food? You ate only a few kinds of foods?

You

had to skip a

meal?

You

ate less than

you thought you

should

?

Your

household

ran out of food?

You

were

hungry

but did not

eat?

You

went without eating for a whole day?”

Even though some of the questions include possibly subjective elements, the scale aims at constructing an

objective measure of the severity of the constraints faced in accessing food.Slide17

The tool

It is based on the concepts that:

Experiences can be ranked in terms of

severity

from the least severe (just being worried) to the most severe (suffering from hunger)

The more food insecure one is, the more likely it is that he or she will report having suffered from the “worst” experiences

It uses a long established probabilistic model (the Rasch measurement model) to estimate the severity of the situation revealed by each experience, and by each respondentThe individual measure of severity depends on the entire pattern of responses (not on any single answer considered in isolation!)Slide18

The analytics

Given a set of responses (Yes = 1, No = 0) to the eight questions, the

item severity parameters

and the

person parameters can be estimated

by Maximum Likelihood procedures.

The person parameters are then used to classify respondents into one of three classes: food secure, moderately food insecure and severely food insecureThe relative frequency of each class in the sample is used as an estimator of the prevalence of that class of food insecurity severity in the populationWhen data are available from different countries or different samples, the scores can be standardized to ensure comparability of the measurement Slide19

Empirical testing of the results

The theory allows for testing whether or not each of the question is contributing to the measurement

Once items are ranked by increasing severity, expected patterns are of the form {1,..,1, 0, …, 0} (affirming one item implies affirming also all the less severe ones)

By comparing

the probability associated with each observed pattern

with

the expected probability of the theoretically consistent pattern for the same raw score, an ‘error’ or ‘residual’ can be estimatedMethods developed in the educational testing practice allow to map the scores obtained with different tests (sets of items) on the same, common underlying scale of severityMeasures of severity obtained in different countries can be made comparable even if not all items have the same associated severity in each countrySolution to the problem found by Coates et al. for the HFIASSlide20

VoH

: the implementation

Pilot tested in Angola, Ethiopia, Malawi and Niger in 2013

Validate the feasibility of the data collection tool

Evaluate the robustness of the scale items and refine some of them

Defining

the analytic protocol for scale calibration and equalization and to set the thresholdsFIES included as a module in the Gallup World Poll (GWP) starting from 2014, during a calendar covering March – NovemberThe GWP is a worldwide survey of nationally representative samples of the adult population (15+) conducted annually in 150+ countries

The

first set of results will be available in August, allowing us to define the global standard reference for scale calibration and to set the thresholds for classification

Micro

data from the FIES questionnaire will be made publicly available, together with a number of socio-demographic covariates

Licenses to the entire GWP dataset will be awarded to partner research institution to conduct research on Food Security against many other social and political conditions in the

countriesSlide21

VoH

: Objectives

To establish a worldwide valid standard for measuring the severity of food insecurity

To estimate the prevalence of moderate and of severe food insecurity in 150+ countries in 2014 and 2015, to set a benchmark against which to monitor progress at national level

To make available to any interested user linguistically and culturally adapted versions of the questionnaire in more than 200 languages

To promote adoption of the FIES in national food security monitoring systems (inclusion of the module in national household surveys)Slide22

VoH

: Current partnership

Resource partners

DfID

, Government of Belgium

Scientific Advisory group

Angus Deaton, Lawrence Haddad, Romulo Paes de Sousa, Mark Nord, Hugo Melgar-QuinonezESS TeamPietro Gennari, Carlo Cafiero, Terri Ballard, Mauro Del Grossi, Anne Kepple, Sara Viviani, Aymeric Songy, Verena WilkeFriends/CollaboratorsAna Maria Segal-Correa, Rafael Perez-Escamilla, Jennifer CoatesSlide23

VoH

: possible partnerships

Collaborating with professionals from all over the world to conduct linguistic and cultural adaptation of the FIES

Collaboration with National Statistical

Offices to promote use of the FIES in any survey that covers households or individuals in the country

Introduction of the FIES into any national and international Food Security Information System

Explore synergies with other existing food security monitoring toolsELCSA, EBIA, CSI Promote the use of the FIES as a tool for impact analysis of policies that are intended to promote food security and nutritionPromote use of FAO’s VoH indicators in the Post 2015 Development Agenda new monitoring frameworkSlide24

Need for further support

Current plan is to collect data through the GWP for five years

Overall budget of about 18 million USD. Resources have been mobilized to cover the first two years

Need to mobilize additional funding to cover 2016-2018

Complete the project’s staffing

Deploying the capacity development activity to promote wide use of the toolSlide25

Selected references

Michelle Hackett, Hugo

Melgar-Quiñonez

, Christopher A. Taylor, Martha Cecilia

Álvarez

Uribe. Factors associated with household food security of participants of the MANA food supplement program in Colombia. Archivos latinoamericanos de nutrición 2010; 6(1) 42-47Hackett M, Melgar-Quiñonez H, Álvarez MC. Household food insecurity associated with stunting and underweight among preschool children in Antioquia, Colombia. Rev Panam

Salud

Pública

. 2009;25(6):506-510.

Álvarez

, MC, Estrada Alejandro.

Seguridad

alimentaria

de los

hogares

colombianos

según

localización

geográfica

y

algunas

condiciones sociodemográficos

. Revista Perspectiva de Nutrición Humana. 2008:10(1):37-50

Hackett M, Melgar-Quinonez H, Alvares

MC. Internal validity of a household security scale es consistent among diverse populations participating in a food supplement program in Colombia. BMC Public Health. 2008, 8:175Pérez-Escamilla, R, Melgar-Quiñonez

, H, Nord, M, Álvarez, MC, Segall-Correa, AM. Análisis comparativo entre ítems de

las escalas de seguridad alimentaria usadas en Brasil (PNAD 2004) y Colombia (ENSIN 2005).Perspectivas de Nutrición

Humana. Separata Memorias de la 1 Conferencia en

América Latina y el Caribe sobre la medición de la seguridad

alimentaria. 2007: 103-12.

Álvarez, MC. La experiencia colombiana

en la adaptación y validación de la Escala

de Seguridad Alimentaria. Perspectivas

de Nutrición Humana. Separata Memorias de la 1

Conferencia en América Latina y el Caribe

sobre la medición de la seguridad

alimentaria. 2007: 77-87.Álvarez, MC. Seguridad

Alimentaria en los hogares colombianos

. En: Encuesta nacional sobre la situación

nutricional en Colombia. Bogotá 2007:319-335. ISBN 978-958-623-087-2.

Álvarez, MC, Estrada Alejandro, Melgar-Quiñonez

. Validación de escala de seguridad

alimentaria doméstica en Antioquia, Colombia. Rev Salud Pública de México. 2006;48:474-481.Slide26

“Voices of the Hungry”

Thank you for your attention!

Pietro

Gennari

, ESS

Voices-of-the-Hungry@FAO.org