/
WWW.COLLIERS.COM/RESEARCH   |    P. 1 WWW.COLLIERS.COM/RESEARCH   |    P. 1

WWW.COLLIERS.COM/RESEARCH | P. 1 - PDF document

yoshiko-marsland
yoshiko-marsland . @yoshiko-marsland
Follow
395 views
Uploaded On 2016-10-13

WWW.COLLIERS.COM/RESEARCH | P. 1 - PPT Presentation

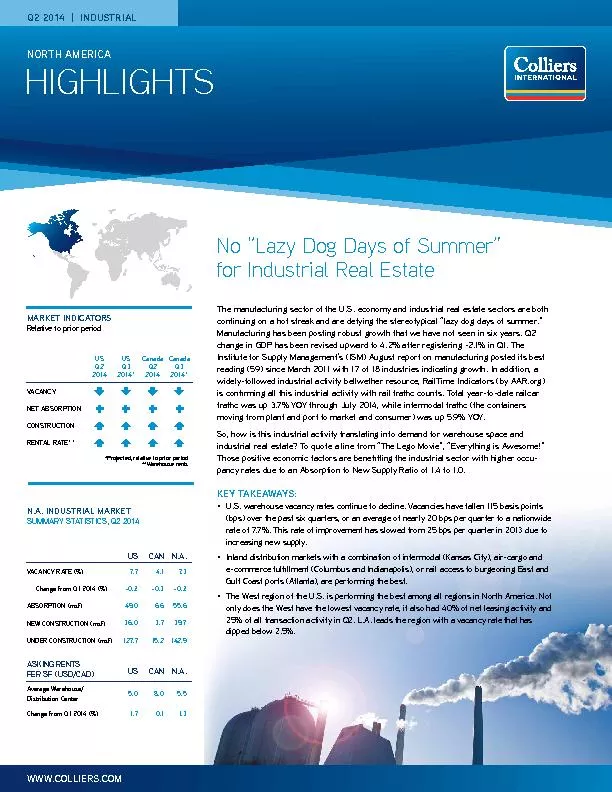
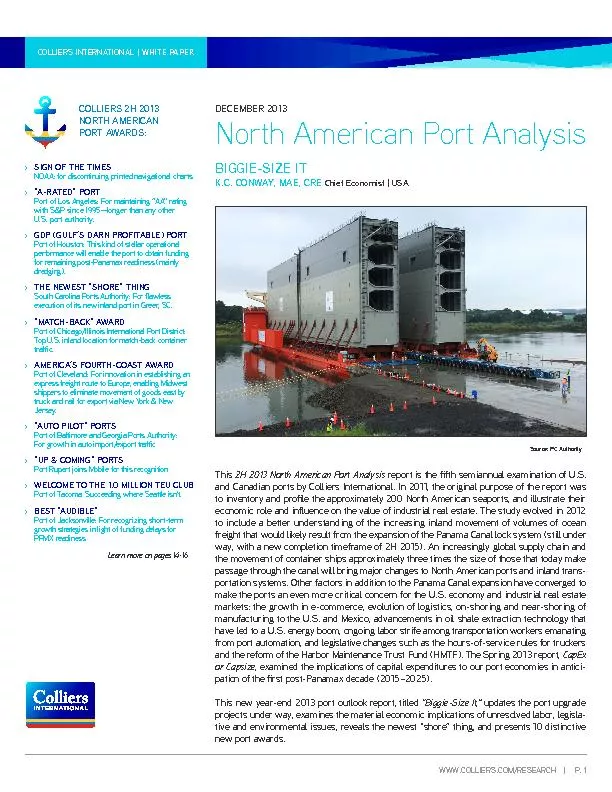
COLLIERS INTERNATIONAL WHITE PAPER This 2H 2013 North American Port Analysis report is the fth semiannual examination of US and Canadian ports by Colliers International In 2011 the original ID: 475011

COLLIERS INTERNATIONAL WHITE PAPER This

Share:

Link:

Embed:

Download Presentation from below link

Download Pdf The PPT/PDF document "WWW.COLLIERS.COM/RESEARCH | P. 1" is the property of its rightful owner. Permission is granted to download and print the materials on this web site for personal, non-commercial use only, and to display it on your personal computer provided you do not modify the materials and that you retain all copyright notices contained in the materials. By downloading content from our website, you accept the terms of this agreement.


Presentation Transcript

WWW.COLLIERS.COM/RESEARCH | P. 1 COLLIERS INTERNATIONAL | WHITE PAPER This 2H 2013 North American Port Analysis report is the fth semiannual examination of U.S. and Canadian ports by Colliers International. In 2011, the original purpose of the report was to inventory and prole the approximately 200 North American seaports, and illustrate their economic role and inuence on the value of industrial real estate. The study evolved in 2012 to include a better understanding of the increasing inland movement of volumes of ocean freight that would likely result from the expansion of the Panama Canal lock system (still under way, with a new completion timeframe of 2H 2015). An increasingly global supply chain and the movement of container ships approximately three times the size of those that today make passage through the canal will bring major changes to North American ports and inland trans - make the ports an even more critical concern for the U.S. economy and industrial real estate markets: the growth in e-commerce, evolution of logistics, on-shoring and near-shoring of manufacturing to the U.S. and Mexico, advancements in oil shale extraction technology that have led to a U.S. energy boom, ongoing labor strife among transportation workers emanating from port automation, and legislative changes such as the hours-of-service rules for truckers and the reform of the Harbor Maintenance Trust Fund (HMTF). The Spring 2013 report, CapEx or Capsize , examined the implications of capital expenditures to our port economies in antici - pation of the rst post-Panamax decade (2015–2025). This new year-end 2013 port outlook report, titled “Biggie-Size It,” updates the port upgrade projects under way, examines the material economic implications of unresolved labor, legisla - tive and environmental issues, reveals the newest “shore” thing, and presents 10 distinctive new port awards. DECEMBER 2013 BIGGIE-SIZE IT K.C. CONWAY, MAE, CRE Chief Economist | USA COLLIERS 2H 2013 NORTH AMERICAN PORT AWARDS: › SIGN OF THE TIMES NOAA: for discontinuing printed navigational charts. › “A-RATED” PORT Port of Los Angeles: For maintaining “AA” rating with S&P since 1995—longer than any other U.S. port authority. › GDP (GULF’S DARN PROFITABLE) PORT Port of Houston: This kind of stellar operational performance will enable the port to obtain funding for remaining post-Panamax readiness (mainly dredging). › South Carolina Ports Authority: For awless execution of its new inland port in Greer, SC. › “MATCH-BACK” AWARD Port of Chicago/Illinois International Port District: Top U.S. inland location for match-back container trac. › AMERICA’S FOURTH-COAST AWARD Port of Cleveland: For innovation in establishing an express freight route to Europe, enabling Midwest shippers to eliminate movement of goods east by truck and rail for export via New York & New Jersey. › “AUTO PILOT” PORTS Port of Baltimore and Georgia Ports Authority: For growth in auto import/export trac › “UP & COMING” PORTS Port Rupert joins Mobile for this recognition › Port of Tacoma: Succeeding where Seattle isn’t. › BEST “AUDIBLE” Port of Jacksonville: For recognizing short-term growth strategies in light of funding delays for PPMX readiness. Learn more on pages 14-16 NORTH AMERICAN PORT ANALYSIS | WHITE PAPER | DECEMBER 2013 DAILY ACTIVITIES REPORTPanama Canal Expansion Program Contract No. CMC 221427Atlantic Locks Second SPMT getting in the Sun Rise Ship 22.08.2013 Source: PC Authority WWW.COLLIERS.COM/RESEARCH | P. 2 We also denitively answer the most debated East Coast vs. West Coast question regarding the Panama Canal expansion: Is the Panama Canal really a big deal for North American ports? Sometimes it just takes a single picture or statistic to reveal what thousands of words struggle to say. The following should be sucient to persuade those that doubt the Panama Canal is a BFD (big nancial deal). › Biggie-Size It statistic: The ports of Los Angeles and Long Beach will spend approxi - mately $5.0 billion on port infrastructure upgrades from 2012–2017, in preparation for the rst post-Panamax decade. That gure approximates the entire cost to expand the Panama Canal lock system, and is more than the planned annual CapEx for the top ve North American ports combined. In other words, the Southern Californian ports see the Panama Canal as a big deal, and intend to surrender nothing to East Coast ports. › Biggie-Size picture worth a thousand words: NORTH AMERICAN PORT ANALYSIS | WHITE PAPER | DECEMBER 2013 DAILY ACTIVITIES REPORTPanama Canal Expansion Program Contract No. CMC 221427Atlantic Locks 22 First Gate Unloading 22.08.2013 First Panama Canal expansion gates to be unloaded August 2013 for the Atlantic-side locks Source: PC Authority WWW.COLLIERS.COM/RESEARCH | P. 3 KEY TAKEAWAYS A lot has transpired since our Spring 2013 report, when the primary inuences were the growth of e-commerce and East Coast PPMX readiness. Now, the primary concerns have evolved to: i) demand for a new generation of dual fuel container vessels to address in-port environmental concerns; and ii) build-out of more intermodal and inland port infrastructure. The following exhibit captures Colliers’ view of the interrelated inuences with just a year to go until the rst post-Panamax decade (2015–2025). NORTH AMERICAN PORT ANALYSIS | WHITE PAPER | DECEMBER 2013 In addition to growth in container cargo trac through the Suez Canal to East Coast ports, and demand for a new generation of dual-fuel container ships, the other key ndings in this “Biggie Size It” outlook report are: › Labor issues remain front & center: In addition to the problematic July 1 implementation of the new hours-of-service (HOS) trucking regulations, expiration of the West Coast long - shoremen’s labor agreement in June 2014 is the primary labor concern for shippers head - ing into 2014. › Port winners and losers are emerging: The ports of Baltimore (auto import business), Virginia (fast-growing East Coast port), Cleveland (new express freight service to Europe), Charleston (best new inland port), Georgia (best in logisitics), Houston (most irreplaceable port), Tacoma (now PPMX-ready� and handling 1.0 million TEUs), and Tampa (new CSX Green Express service to Chicago to grow AG) have emerged with winning strategies in 2H 2013. On the other hand, the ports of Portland (loss of Hanjin Shipping), New York (ongoing labor and logisitics challenges), and Long Beach (political and port leadership turmoil) are struggling. DUAL FUEL Driven by environmental & fuel costs. Who can refuel LNG? E-COMMERCE growth means get your supply chain in order (10%/9%) PANAMA CANAL VS. SUEZ Suez TEUs up +5.6% to 12.2M vs. -2.4% 37.8M TEUs in Panama Canal THE “I”S HAVE IT Intermodal & inland ports are the good news: ILWU in 2014 is the bad news EAST COAST PORTS NOT JUST MILITARY ANYMORE West Coast, meet new competition! WWW.COLLIERS.COM/RESEARCH | P. 4 Port Diagnosis: “What’s up, Dock?” HEALTHY TEU PORT RHYTHM Many notable topics will be diagnosed as minor ailments or chronic conditions during the many upcoming scal year-end, state-of-the- port checkups. Among them are: › Anemic domestic and global GDP growth › Another delay in completion of the Panama Canal lock system project (now 2H 2015) › Suez Canal TEU container growth approaching one-third the volume of Panama Canal trac › A problematic launch of new HOS trucking rules › Another potential longshoremen’s labor disruption in 2014, this time aecting the West Coast ports › Continued Congressional dysfunction holding up vital funding for port CapEx projects (WRDA legislation) › Conict between the nation’s energy infrastructure policy (no new pipelines across my backyard) and a solution to port air- quality issues (dual-fuel ships powered by LNG while in port) › Innovative strategies being deployed by some of North America’s ports to garner a disproportionate share of promised post- Panamax era jobs Which are minor port aches and post-Panamax growing pains, and which are more chronic illnesses with (economic) life-threatening consequences? The starting point in any diagnosis is collecting data on the vital statistics. As many of you know, this report’s author has a healthy skepticism of government-generated survey data, and tends to rely more upon primary data produced by private industry, such as Trad - ing Economics.com (Global GDP electrocardiograms), ADP (the best private employment temperature reading), On Numbers Economic Index (MSA-level economic blood pressure reading), the Association of American Railroads’ Rail Time Indicators (intermodal and railroad blood ow), the Intermodal Association of North America (anatomy), and the USDA’s Ocean Shipping Container Availability Report (for TEU container count). Let’s begin with the GDP and employment metrics and move on to the port, rail and industrial measures, to see what’s ailing the ports. GDP The above EKG for the past six decades of U.S. GDP reveals the slow - ing of a mature economy. Emerging from WWII, the U.S. economy resembled a peak performance triathelete, with an annual GDP above 10% for most of the 1950s and 1960s, peaking at 17% in 1950. Today, though, our economy’s below-trend economic activity (.25%) resembles that of an overweight (debt burdened) sedentary smoker with hypertension (Congressional dysfunction). In fact, a closer look at the U.S. GDP for the period since 2008 reveals that 1H 2013 pro - duced the weakest GDP since the 2009 nancial crisis. The Bureau of Economic Analysis (BEA) initially estimated Q3 GDP at 2.8%, due primarily to a rise in inventories (not a good thing) rather than growth in consumption. In fact, consumption GDP was an anemic 1.7%. This weakness in consumer demand typically translates into a slowing in imported goods—especially from markets like Asia. 20151050-5-10-1520151050-5-10-1519501963197619892002 UNITED STATES GDP GROWTH RATE | % CHANGE IN GDP Source: www.tradingeconomics | U.S. Bureau of Economic Analysis 3.25% 1945-2013 average GDP First post-WWII decade, GDP hit all-time high in 1950, low in 1958 The U.S. GDP has been below 3.25% historic trend since 2013—or the past decade WWW.COLLIERS.COM/RESEARCH | P. 5 -10-8-6-4-20246 1.52-2.7-2-8.3200820102012-5.4 -5.4-0.4 -0.41.33.9 3.91.63.9 3.9-1.3 -1.3 2.8 2.8 2.82.8 2.8 2.83.2 3.21.4 1.44.9 4.93.7 3.71.22.8 2.80.11.12.5 2.5 UNITED STATES GDP GROWTH RATE Source: www.tradingeconomics | U.S. Bureau of Economic Analysis Note: 1H 2013 GDP weakest since 2009. Q3 est of 2.8% due to build in inventories. Q3 Consumption GDP just 1.7% Global GDP is not that robust either. Europe is still struggling to nd its sea legs after the 2009 global nancial crisis, and at the writing of this report, the Paris-based Organization for Economic Cooperation and Development (OECD) forecast the world economy would grow 3.6% in 2014 after growing just 2.7% in 2013. Why? The OECD explains that the primary reason is less growth in emerging countries. In aggregate, continued anemic growth in the U.S. and less growth from emerging markets means static to nominal growth in TEU ship - ping container trac. EMPLOYMENT: CHANGE IN NONFARM PRIVATE JOBS ADP private employment data provides a less volatile and more reli - able picture of U.S. job growth. Bureau of Labor Statistics (BLS) jobs data is highly revised, and there are even suspicions that underlying census data may have been manipulated or fabricated in 1H 2012. Looking at the trend in ADP private employment it is clear that private industries have been hiring fewer workers each month since late spring. Analysis of the private employment sectors producing the least and most jobs throughout 2013 reveals that the Trade & Transportation sector has been producing the largest number of private jobs. This trend continues into Q4 2013 in the October ADP Private Payrolls report (latest available at publication). Trade & Transportation led all private employment sectors in the October period by at least 2 to 1. While the growth in Trade & Transportation sector employment is encouraging for industrial real estate, it will be short-lived if, after the completion of port and transportation CapEx projects, U.S. business and consumer condence does not recover from the ongoing uncer - tainties in Washington, D.C., resulting in no resolution to budget, health care and tax legislation. 050100150200250300Thousands Oct 12Nov 12Dec 12Jan 13Feb 13Mar 13Apr 13May 13Jun 13Jul 13Aug 13Sep 13Oct 13148276209177198154124141190161151145130 CHANGE IN TOTAL NONFARM PRIVATE EMPLOYMENT Source: ADP, Inc., Moody’s Analytics -50-10510152025303540ThousandsOctober 2013 ConstructionManufacturingFinancial ActivitiesProfessional/Business Services Professional/Business ServicesTrade/Transportation/Utilities145-52040 CHANGE IN NONFARM PRIVATE EMPLOYMENT BY SELECTED INDUSTRY Source: ADP, Inc., Moody’s Analytics POST-PANAMAX PORT READINESS, TEU COUNT UPDATE Subsequent to Colliers’ inaugural 2011 North American Port Analy - sis, the ports of Baltimore, Mobile, Prince Rupert (Canadian Pacic coast), and Tacoma have become post-Panamax (PPMX) ready with the completion of dredging and/or new gantry crane upgrades. A total of eight North American ports are now capable of receiving the largest fully laden container vessels that will make passage through the Panama Canal in 2H2015. The West Coast ports have the most PPMX-ready ports (five), and the Gulf and East coasts each have two. Canada has one port (Prince Rupert), and the East Coast has the most ports scrambling to achieve PPMX status within the next 2–5 years (New York, Charleston and Miami). The following table updates this information. WWW.COLLIERS.COM/RESEARCH | P. 6 NORTH AMERICAN POST-PANAMAX PORT READINESS UPDATE PORT COAST 2013 TEUS (THOUSANDS) PPMX STATUS PPMX UPDATE 1 LA/Long Beach West 14,000 PPMX Ready LA 100% / LB 100%...but leadership ? 2 New York East 5,500 In Process Bayonne Bridge being raised 3 Savannah, GA East 3,100 Not before 2015 Dredging to 47 feet/has Super PPMX cranes 4 Seattle, WA West 3,000 PPMX Ready Increasing competition with Port Rupert 5 Norfolk, VA East 2,300 PPMX Ready First East Coast port to be PPMX 6 Houston Gulf 2,100 In Process Dredging and upgrading cranes 7 Oakland West 1,600 PPMX Ready Adding world-class Tr. & Logisitics Ctr 8 Charleston, SC East 1,550 Not before 2015 2018-2019 to complete dredging to 50 feet 9 Tacoma, WA West 1,100 PPMX Ready TEU growth % best among West Coast ports 10 Port Everglades East 1,000 Not before 2015 Dredging application in process 11 Miami East 950 In Process Super PPMX cranes being installed. 12 Port Prince Rupert West ,000 PPMX Ready A competitve threat to Seattle & Tacoma 13 Jacksonville, FL East ,000 Not before 2015 "Audible” call due to delayed PPMX funding 13 Portland West Not before 2015 Loss of Hanjin Ship Co. a wake-up call 15 Tampa Gulf Not before 2015 No plans to dredge or raise Skyway Bridge 16 Baltimore East PPMX Ready Joined PPMX Club in 2013 17 Mobile, AL Gulf PPMX Ready �Deepest port on Gulf @ 60 feet 18 Philadelphia East Bulk Not before 2015 Dredging Delaware River to 45-feet 19 New Orleans Gulf Bulk Not before 2015 No plans or funding to upgrade further N.AMERICAN PPMX READY PORTS: 8 Added Baltimore, Rupert & Tacoma since 2011/2012 port reports. N.AM. PPMX PORTS BY 2015: 11 Only 1 PPMX port in FL & 2 on Gulf coast. WWW.COLLIERS.COM/RESEARCH | P. 7 24%18%16%9%7%6%6%5%5%4% Los Angeles, LongBeach and NY/NJaccount for 58% Los AngelesLong BeachNY/NJSavannahOaklandNorfolkHoustonSeattleTacomaCharleston 2012 TOP 10 U.S. CONTAINER PORT MARKET SHARE Source: Calendar Year AAPA Statistics The one concern emerging for East Coast ports is excess PPMX port capacity, and the ROI on PPMX CapEx investment. Not all ports need to be PPMX-compliant to grow or be vital cargo and container ports in the rst PPMX decade. The ROI is suspect on dredging to 50-foot depths, upgrading berthing areas to 50-foot depths, and replacing gantry cranes with cranes having the height and reach to unload taller and wider container vessels. The Port of Tampa was probably the rst non-West Coast port to realize the ROI inadequacy and exaggeration of promised jobs by local economic development authorities advocating for PPMX appropriations. It has pursued a dierent course, focused on its agricultural roots and its potential to be the central distribution center port for Florida with a rail reach to the Midwest that rivals California’s. Jacksonville is coming to this realization as well (as recognized by our new “Best Audible” award). RAIL TIME INDICATORS & INTERMODAL TRAFFIC FLOW Forget the Federal Reserve’s Beige Book and plethora of quarterly manufacturing surveys, for a gauge on U.S. industrial activity go to the source that is the most correlated to U.S. GDP growth: AAR’s Rail Time Indicators (RT) . This comprehensive monthly data series collects primary data on all that moves by rail, and provides such meaningful metrics as U.S. freight trac, changes in rail car capacity and railroad employment, and growth in intermodal trac. The latest October data shows overall rail trac trending upward, modestly in sync with U.S. GDP. The October RT report, though, shows that record rail intermodal traf - c is a long-term trend, as is the increase in intermodal trac. Every year since the 2009 recession, intermodal trac has surpassed the prior year’s record level. 4%2%0%-2%-4%-6%20%0%-10%-20%-30%20102009201120122013 GDP (left scale)Rail Trac (right scale)* *Carloads excluding coal and grain + intermodal units.Rail trac excludes U.S. operations of Canadian railroads. (% change year-over-year) AS THE ECONOMY GOES, SO GOES MOST RAIL TRAFFIC Source: BEA, AAR 150,000200,000250,000300,000 2009 2010 2011 2012 2013JanFebMarAprMayJunJulAugSepOctNovDec AVERAGE WEEKLY U.S. RAIL INTERMODAL TRAFFIC Source: BEA, AAR The AAR ascribes this growth in intermodal trac to “more reliable rail intermodal service; massive railroad investments in new intermo - dal terminals, tunnel expansions, improved signal systems, and other infrastructure and equipment; conversion of freight from other rail car