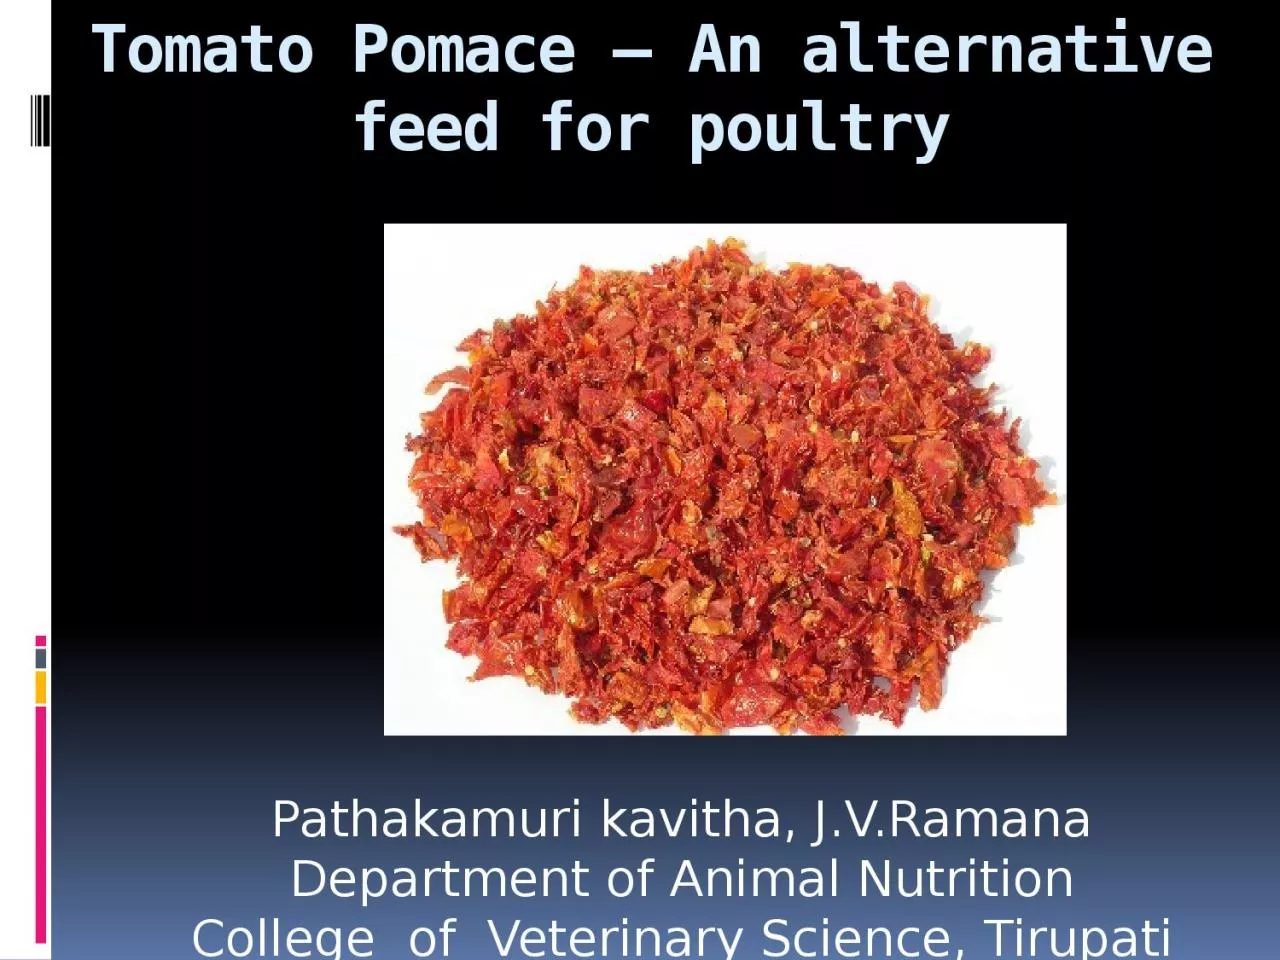
/
Tomato Pomace – An alternative feed for poultry Tomato Pomace – An alternative feed for poultry

Tomato Pomace – An alternative feed for poultry - PowerPoint Presentation

DreamCatcher
DreamCatcher . @DreamCatcher
Follow
343 views
Uploaded On 2022-08-02

Tomato Pomace – An alternative feed for poultry - PPT Presentation

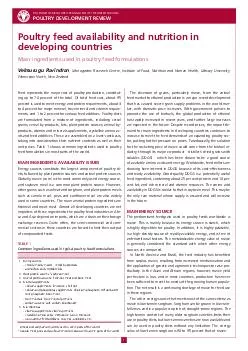
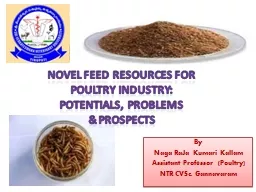
Pathakamuri kavitha JVRamana Department of Animal Nutrition College of Veterinary Science Tirupati Feed cost accounts for 7075 of total cost of production Availability and cost of feed ingradients for poultry diets are the major problems has prompted the need for seeking o ID: 932214

inclusion dtp effect amp dtp inclusion amp effect diets level feed broiler tomato total production 100 enzyme cholesterol protein

Share:

Link:

Embed:

Download Presentation from below link

Download Presentation The PPT/PDF document "Tomato Pomace – An alternative feed fo..." is the property of its rightful owner. Permission is granted to download and print the materials on this web site for personal, non-commercial use only, and to display it on your personal computer provided you do not modify the materials and that you retain all copyright notices contained in the materials. By downloading content from our website, you accept the terms of this agreement.


Presentation Transcript

Slide1

Tomato Pomace – An alternative feed for poultry

Pathakamuri

kavitha

,

J.V.Ramana

Department of Animal Nutrition

College of

Veterinary Science, Tirupati

Slide2

Feed cost accounts for 70-75 % of total cost of production.

Availability and cost of feed ingradients for poultry diets are the major problems, has prompted the need for seeking other feed resources, especially agricultural and industrial by-products.In India a shortage of 25% concentrates constituting 32% of protein requirement has been estimated (FAO,2013).

The wastes from fruit and vegetable industry can be used as a potential source of newer cheap feed resources.

Slide3

Tomato is one of the most important protective food crops of India. It is grown in

0.879 M ha area with

18.227

M MT

production and

20.7

MT/ha

productivity.

The major tomato producing states are Bihar, Karnataka, Uttar Pradesh, Orissa,

Andhra Pradesh, Maharashtra, Madhya Pradesh and West Bengal.

29% of total national production is from Andhra Pradesh.

Slide4

Tomato Production in India (

Source: Indian horticultural data base-2013)

Year

Area

(‘000 HA)

% of total veg. area

Production

(‘000 MT)

% of total veg. production

Productivity

(MT/HA)

2001-02

458.1

7.4

7462.3

8.0

16.3

2002-03

478.8

7.9

7616.7

9.0

15.9

2003-04

502.8

8.0

8125.6

8.7

16.2

2004-05

505.4

7.5

8825.4

8.7

17.5

2005-06

546.1

7.6

9820.4

8.9

18.0

2006-07

596.0

7.9

10055.0

8.7

16.9

2007-08

566.0

7.2

10303.0

8.0

18.2

2008-09

599.0

7.5

11149.0

8.6

18.6

2009-10

634.4

7.9

12433.2

9.3

19.6

2010-11

865.0

10.2

16826.0

11.5

19.5

2011-12

907.1

10.1

18653.3

11.9

20.6

2012-13

879.6

9.6

18226.6

11.2

20.7

Slide5

Tomato Production(‘000MT) Trend in India

Source: Indian Horticulture data base-2013

Slide6

State wise production(‘000MT) of Tomato in India

State

2012-13

A

ndhra

Pradesh

5218.1

Karnataka

1916.6

Madhya Pradesh

1845.0

Odisha

1382.78

Gujarat

1156.72

Bihar

1126.25

West Bengal

1125.6

Maharashtra

1050.0

Chhattisgarh

762.22

Himachal Pradesh

413.71

Others

2229.7

Total

18226.6

Slide7

Slide8

Tomato Pomace

The tomato pomace is a by-product obtained from the processing of tomatoes for concentrated paste, juice, puree, sauce and ketchup. The solid waste which remains after extraction process consists of peels, cores, seeds, trimmings and cull tomatoes.

About 2% of tomatoes are processed for value added products in India.

When tomatoes are processed into products, 10% to 30% of their weight becomes waste or “

pomace

”.

According to

Safamehr

et al(2011 )tomato

pomace

contains

90

% DM, 8.1%

fat,

19.68

%

protein

and

29.75%

crude fiber. Moreover, it contains 13% more lysine than soybean protein

(AL-

Betawi

, 2005), a good source of vitamin B, fair source of vitamin A and no known

antinutritive

factors,

and 2130 kcal/kg

metabolizable

energy (NRC, 1988).

Slide9

Chemical composition of DTP

Nutrient

DTP

Dry Matter (DM)

89.56

Organic Matter (OM)

90.99

Crude Protein (CP)

22.39

Ether Extract (EE)

12.23

Crude Fibre (CF)

40.10

Total Ash (TA)

9.01

Nitrogen Free Extract (NFE)16.27Acid Insoluble Ash (AIA)3.63Calcium (Ca)0.56Phosphorus (P)0.48

*

On dry matter basis except for DM

Slide10

Ingredient composition (%) of broiler starter diets (BIS,1992)

Ingradient

T

1

&T

2

T

3

& T

4

T

5

& T

6

T

7

& T8Maize525149.548Dried tomato pomace051015

Soybean meal

30

28

26

24

Fish meal

10

10

10

10

Mineral mixture with salt

3

3

3

3

Saw dust

5

3

1.5

0

Feed

additives

+

+

+

+

Total

100

100

100

100

Slide11

Chemical composition* (%) of broiler starter diets

Constituents

T

1

&T

2

T

3

& T

4

T

5

& T

6

T

7

& T8Dry matter90.9690.4990.3790.25Organic matter89.7489.5589.2389.20Crude protein

23.25

23.53

23.46

23.62

Ether extract

1.86

2.31

2.92

3.46

Crude fibre

6.81

7.43

8.36

9.21

Total ash

10.26

10.45

10.77

10.80

Nitrogen free extract

57.82

56.28

54.49

52.91

Acid insoluble ash

3.07

3.11

3.19

3.14

ME kcal / kg (calculated)

2712

2733

2738

2744

Protein : Energy ratio

1 : 116

1 : 116

1 : 116

1 : 116

Calcium

1.67

1.70

1.69

1.69

Phosphorus

1.02

1.04

1.01

1.00

Slide12

Ingredient composition (%) of broiler finisher diets

Ingradient

T

1

&T

2

T

3

& T

4

T

5

& T

6

T

7

& T8Maize6159.55856.5Dried tomato pomace051015Soybean meal21.5

19.5

17.5

15.5

Fish meal

10

10

10

10

Mineral mixture with salt

3

3

3

3

Saw dust

4.5

3

1.5

0

* Feed additives

+

+

+

+

Total

100

100

100

100

Slide13

Chemical composition* (%) of broiler finisher diets

Constituents

T

1

&T

2

T

3

& T

4

T

5

& T

6

T

7

& T8Dry matter90.3890.4390.4790.45Organic matter90.2790.0889.9589.79Crude protein

20.28

20.33

20.32

20.34

Ether extract

1.81

2.56

3.01

3.55

Crude fibre

6.37

6.99

8.01

8.91

Total ash

9.73

9.92

10.05

10.21

Nitrogen free extract

61.81

60.20

58.61

56.99

Acid insoluble ash

3.04

3.14

3.18

3.15

ME kcal / kg (calculated)

2781

2786

2791

2796

Protein : Energy ratio

1 : 137

1 : 137

1 : 137

1 : 137

Calcium

1.66

1.67

1.67

1.66

Phosphorus

0.99

0.98

0.97

0.98

Slide14

Composition of Polyzyme

Name of the enzyme

IU / gm

Xylanase

:

8000

Phytase

:

100

Cellulase

:

35

Beta glucanase

:

150

Pectinase

:100 Alpha – amylase:1500 Protease:500

Alpha-galactosidase

:

800

Beta-galactosidase

:

450

Slide15

Effect of level of DTP inclusion in broiler diets with or without enzyme supplementation on average

body weight gain (g)

Slide16

Effect of inclusion of different levels of DTP on body weight gain of broilers

Slide17

Effect of level of DTP inclusion in broiler diets with or without enzyme

supplementation on feed intake (g)

Slide18

Effect of inclusion of different levels of DTP on feed intake(g) of broilers

Slide19

Effect of level of DTP inclusion in broiler diets with or without enzyme supplementation on feed efficiency

Slide20

Effect of inclusion of different levels of DTP on feed intake/kg gain in broilers broilers

Slide21

Effect of level of DTP inclusion in broiler diets with or without enzyme supplementation on level of serum triglycerides and serum cholesterol

Slide22

Effect of inclusion of different levels of DTP on the

level of serum triglycerides and serum cholesterol

Slide23

Effect of level of DTP inclusion in broiler diets with or without enzyme supplementation on LDL-C (mg/dl)


Slide24

Effect of inclusion of different levels of DTP on the

level of serum LDL-C

Slide25

Effect of level of DTP inclusion in broiler diets with or without enzyme supplementation on breast muscle cholesterol (mg/100g of meat)


Slide26

Effect of level of DTP inclusion in broiler diets on breast muscle cholesterol (mg/100g of meat)

Slide27

Effect of level of DTP inclusion in broiler diets on thigh muscle cholesterol (mg/100g of meat)

Slide28

Effect of level of DTP inclusion in broiler diets on Feed cost/kg gain

Slide29

THANK YOU

Slide30

Veysel

Ayhan and Sedat

Aktan

(2004) suggested that DTP can be used as a feed ingradient in broiler ration with a level of 5%.

Melkamu

Bezabih

Yitbarek

(2012) reported that weight gain and feed efficiency are higher at 5% DTP inclusion in Rhode Island Red grower chicks.

Safamehr.et al .,2011 included DTP at 0,4,8 & 12 % levels with and without enzyme supplementation in layer rations and observed decreased serum cholesterol but had no effect on yolk cholesterol with increase in the DTP level and the better performance was observed at 8% level of inclusion. Enzyme supplementation increased egg weight, but did not affected the egg production.

Slide31

Jafari et al(2006) and Mansoori

et al (2008) reported that feeding laying hens with diets containing DTP at inclusion rates upto 120g/kg did not effect egg production, food consumption and efficiency of the hen as well as egg weight and shell thickness.

Md.Hamed Salajegheh et al (2012) reported DTP inclusion caused a significant increase in mean HDL cholesterol and decrease in serum LDL cholesterol content.