/
An Open Label Randomized Clinical Study To Evaluate The Impact Of Protein Supplement On An Open Label Randomized Clinical Study To Evaluate The Impact Of Protein Supplement On

An Open Label Randomized Clinical Study To Evaluate The Impact Of Protein Supplement On - PowerPoint Presentation

GymRat
GymRat . @GymRat
Follow
342 views
Uploaded On 2022-08-02

An Open Label Randomized Clinical Study To Evaluate The Impact Of Protein Supplement On - PPT Presentation

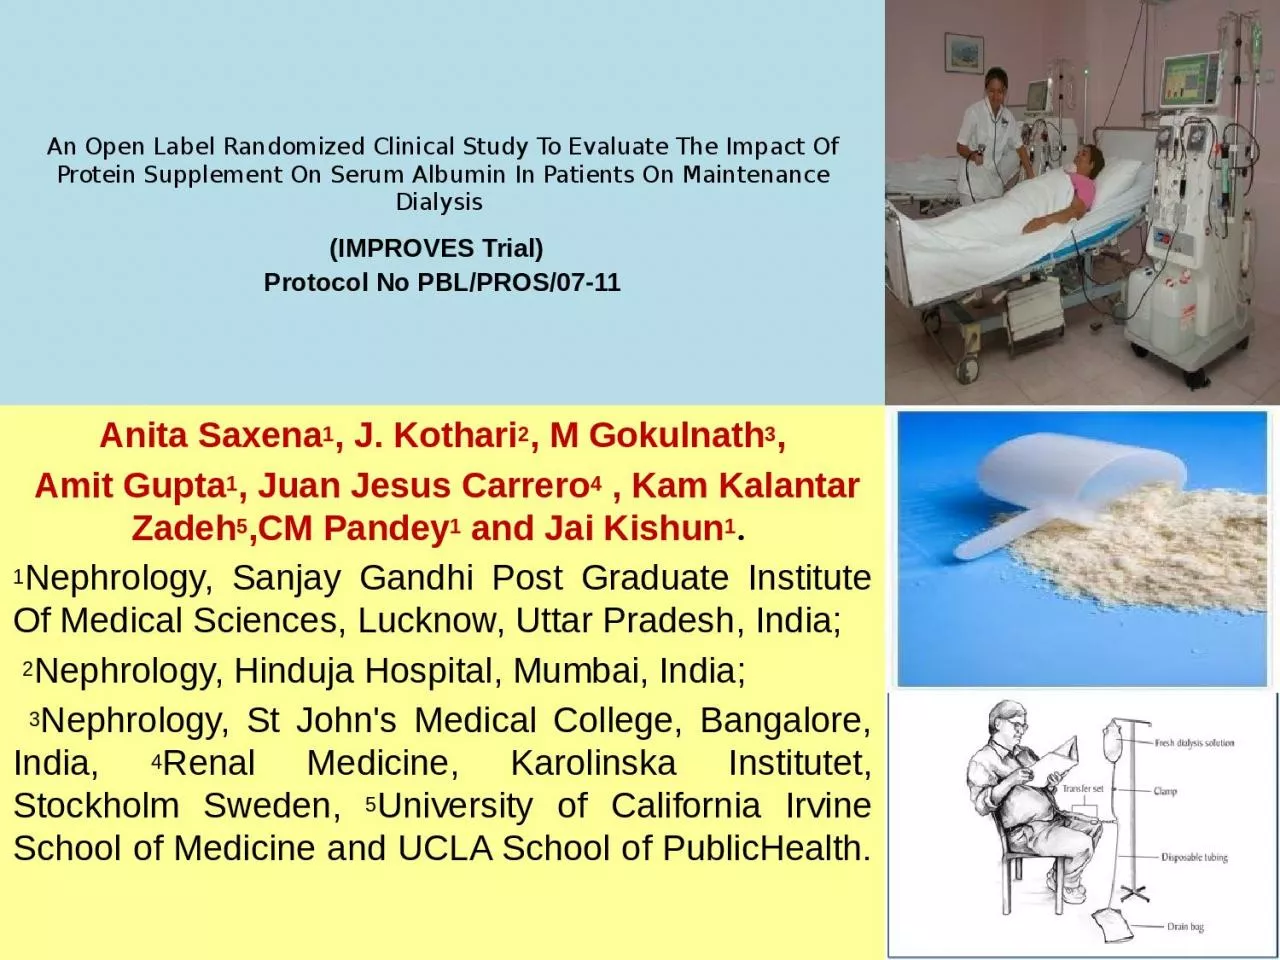
IMPROVES Trial Protocol No PBLPROS0711 Anita Saxena 1 J Kothari 2 M Gokulnath 3 Amit Gupta 1 Juan Jesus Carrero 4 Kam Kalantar Zadeh 5 CM Pandey ID: 932255

dialysis patients nutritional protein patients dialysis protein nutritional serum group albumin visit status energy intake hemodialysis study chronic supplemented

Share:

Link:

Embed:

Download Presentation from below link

Download Presentation The PPT/PDF document "An Open Label Randomized Clinical Study ..." is the property of its rightful owner. Permission is granted to download and print the materials on this web site for personal, non-commercial use only, and to display it on your personal computer provided you do not modify the materials and that you retain all copyright notices contained in the materials. By downloading content from our website, you accept the terms of this agreement.


Presentation Transcript

Slide1

An Open Label Randomized Clinical Study To Evaluate The Impact Of Protein Supplement On Serum Albumin In Patients On Maintenance Dialysis (IMPROVES Trial) Protocol No PBL/PROS/07-11

Anita Saxena1, J. Kothari2, M Gokulnath3, Amit Gupta1, Juan Jesus Carrero4 , Kam Kalantar Zadeh5,CM Pandey1 and Jai Kishun1. 1Nephrology, Sanjay Gandhi Post Graduate Institute Of Medical Sciences, Lucknow, Uttar Pradesh, India; 2Nephrology, Hinduja Hospital, Mumbai, India; 3Nephrology, St John's Medical College, Bangalore, India, 4Renal Medicine, Karolinska Institutet, Stockholm Sweden, 5University of California Irvine School of Medicine and UCLA School of PublicHealth.

Slide2

Introduction Dialysis is a hypercatabolic procedure which impacts nutritional status and survival. The protein loss induced by the HD treatment can contribute to the protein energy malnutrition. Patients undergoing dialysis frequently suffer from both malnutrition and cachexia from the very early stages of the initiation of dialysis. Cachexia

is characterised by defective food assimilation or utilization in the presence of hypercatabolism and systemic inflammation

Slide3

Malnutrition

Cachexia: defective food assimilation or utilization in the presence of hypercatabolism and systemic inflammation.Nutrient IntakeNutrient RequirementMalnutrition ImbalanceDiseaseLow protein and calorie intake is an important cause of malnutrition in chronic kidney disease. Protein energy malnutrition develops during the course of chronic kidney disease and is associated with adverse outcomes.

Slide4

Uremic Anorexia And DysgeusiaMalnutrition is reportedly present in 18%-75% of the maintenance dialysis patients. Uremic anorexia and dysgeusia lead to inadequate protein and calorie intake, in turn resulting in malnutrition and

adverse outcomes.

Slide5

Various factors contribute to the development of altered nutritional states in dialysis patients

Slide6

Loss of Nutrients

& Water soluble Vitamin in DialysateMalnutritionUremic toxicityAnorexiaLoss of tasteUnpalatable dietsDietary protein& energy intakeInflammationInfectionSuperimposed illness

Presence of

Comorbidity

Metabolic

Acidosis

Hormonal disorders

Resistance to anabolic

hormones

level of counter

regulatory hormones

Glucagon, PTH

Declining

Residual

Renal

F

unction

Anemia

loss of blood due to

GI bleed, frequent

blood sampling

Inadequate

Dialysis dose

Malnutrition is

Multifactorial

In CKD

Premature Ageing Of Dialysis Patients

Emotional Distress

Increased Mortality And Morbidity

Slide7

Most patients on dialysis have a lower than normal dietary energy and protein intake. It is estimated that 50%-70% of malnutrition cases are related to inadequate dietary intake. Judith A Beto etal Strategies to promote adherence to nutritional advice in patients with chronic kidney disease: a narrative review and commentary Int J

Nephrol Renovasc Dis. 2016; 9: 21–33.

Slide8

Relative risk of death increases with 1. Lower serum albumin and 2. Worse nutritional status as assessed by SGA and %LBMLow serum albumin level is associated with technique failure, increased rate of hospitalization and mortality.

CANUSA Study NDT1998; 13 (Suppl 6):158–63.

Slide9

When Patient Is On Maintenance DialysisFrom metabolic point of view, each dialysis session decreases plasma amino acid levels and as a consequence blunts intracellular protein synthesis. HD/session PD/24 hoursAmino Acid 10 to 12 g 2–3.5 g/24hProtein 1 to 3 g 5-15 g/24h average 9g.

Losses are higher during peritonitis 15g/d

Slide10

NKF-K/DOQI Guidelines MHD Guidelines 3-4

VariableLevelHalf LifeLimitationsPredialysis or stabilized Serum Albumin≥ 4.0g/dL~20 days Influenced (negatively) by inflammationTends to go down asinflammatory markers (CRP, IL-6, ferritin) go upInfluenced (negatively) by albuminuria and peritoneal albumin losses– Affected by hydration statusSerum Prealbumin ≥30 mg/dL ~2-3 daysLow levels Inflammation & StressLevels are increased in renal due to impaired degradation by kidneys.

Slide11

Intervention Clinical trials on ONS for dialysis patients have shown that enteral therapy is associated with improved nutrition status. Uremia induced inadequate dietary intake leads to metabolic disturbances, PEW, cachexia, and high rate of morbidity and mortality. Hypoalbuminemia

is a strong predictor of mortality among maintenance dialysis patients. Early identification of patients with eating behaviour disturbances can potentially reduce the burden of malnutrition through appropriate intervention.

Slide12

Primary Objective To evaluate the efficacy of nutritional supplement on the nutritional status of hypoalbuminemic malnourished patients on maintenance dialysis.

Slide13

Primary End Points For Efficacy And Safety Increase in parameters from baseline to visit 3. Serum Albumin BMI Total body fat percent Anthropometric measurements (biceps, triceps,

suprailliac and subscapular skin fold thickness mid upper arm circumference (MUAC), and waist-hip-ratio) Subjective global assessment (SGA) and Reduction in Edema

Slide14

Secondary Endpoints: Biochemical Factors That Impact On Morbidity And Mortality Decrease Blood Cholesterol : decrease in LDL, VLDL & increase in HDLBlood sugar : glycosylated haemoglobin HbA1cSerum sodium, potassium and phosphorousChange Coagulation factorDecrease of C- reactive protein

Slide15

Material And MethodsMulticenter randomized intervention on maintenance dialysis (MD) patients.Approved by institute’s ethics committee.Duration of supplementation : 6 months3 centers Sanjay Gandhi Post Graduate Institute Of Medical Sciences, Lucknow. Hinduja Hospital, Mumbai St John's Medical College, Bangalore

Slide16

Criteria For Selection Of Patients. Inclusion Criteria

Patient willing to sign informed consent form. Patients above the age of 18 years .Clinical PEW as per ISRNM criteria. Serum albumin < 3.8g/100ml Patients on maintenance dialysis for at least 3 months.Adequately dialyzed as per investigator Absence of uremic symptomsPatients from middle to high socioeconomic group. Exclusion CriteriaPatients with no clinical PEW as per ISRNM criteriaPatients with systemic infection like TB or Malaria. Patients on nutritional supplement or have discontinued use of ONSPlan for kidney transplantation within study period Pregnant or breast feeding femalesLife expectancy less than 6 month Patient changed from haemodialysis to peritoneal dialysis

Slide17

Serum Chemistry 1. Serum albumin level <3.8 g/dL 2. Serum pre-albumin level <30 mg/dL 3. Serum cholesterol level < 100 mg/dL

1. BMI<22 kg m2 (for age >65 years), and <23 kg m2 (for age <65 years) 2. Unintentional weight loss : 5% in three months; or 10% in 6 m Total body fat percent < 10%ISRNM Clinical Criteria For Diagnosing Protein-Energy-Wasting Serum ProteinBody Mass

Slide18

ISRNM Clinical Criteria For Diagnosing Protein-Energy-Wasting

1. Muscle wasting, reduced muscle mass 5% in three m; or 10% in 6 m2. Reduced mid-arm muscle circumference area >10 % reduction in relation to 50th percentile of reference population3. Creatinine appearance1. Unintentional low dietary protein intake <0.8 g/kg/d for at least 2 months for maintenance dialysis patients or <0.60 g/kg/d for patients with CKD stage 2-5 with 5 g/d of urinary protein loss.2. Unintentional low dietary energy intake <25 kcal/kg/d for least 2 monthsDietary IntakeMuscle Mass

Slide19

Study Design: Multicenter randomized intervention study.

Visit 0 Screening: Screening for Inclusion and Exclusion Criteria. Demography, Vital Signs, Income Group, Medical History Randomization 1:1 ratio Group I N =90 Group II N=90

S

tandard diet 1.2g/Kg/d protein without supplementation

Received 30 g of

Renal specific

soy based powder

supplementation

along with standard

diet 1.2g/Kg/d Protein.

180 patients from

3 centers

60 patients each center PD 36 and HD 144

Slide20

Soy Protein Powder was given daily in three divided doses of 10 g each.Compliance to intake of ONSONS Tins dispensed and number of Empty tins returned on the follow-up visit.

Administration and Compliance To ONS

Slide21

Anthropometriy

, Skin fold measure (biceps, triceps, suprailliac, and subscapular, Mid Upper Arm & waist circumference and waist hip ratio), BMI Grading (WHO), dialysis history, edema status, lab parameter, Subjective Global Assessment, Diet Calculation, QOL SF36Anthropometry (Skin fold measure (biceps, triceps, suprailliac, and subscapular),Mid Upper Arm & waist circumference and waist hip ratio), BMI Grading (WHO), dialysis history, edema status, lab parameter, Subjective Global Assessment, Diet Calculation, QOL SF36 Administration of ONS, Compliance and SafetyAnthropometriy : BMI (WHO), Skin fold measure, dialysis history, edema status, lab parameters, Diet Calculation Proseventy administration Compliance and Safety of ONS

Anthropometry, BMI Grading (WHO), Skin fold measure, dialysis history, edema status, lab parameter, Subjective Global Assessment, Diet

CalculationProseventy

administration, compliance, Safety,SF36

Visit 2:

3 Months (±5days from V1)

Visit 1-Baseline (30days±10days

)

Visit

3 6 Months

(±5days from V2)

Anthropometry, BMI Grading (WHO), Skin fold measure, dialysis history, edema status, lab parameter, Diet Calculation

Anthropometry, BMI Grading (WHO), Skin fold measure, dialysis history, edema status, lab parameter, Subjective Global Assessment, Diet Calculation,SF36

END OF THE STUDY

Group I

Group 2

Details of Visits And Evaluation

Slide22

Biochemical TestsSerum albuminSerum creatinine

Blood Urea nitrogenRandom blood glucoseHbA1c Sodium/PotassiumCalcium/PhosphorusLipid ProfileC-reactive protein (CRP) PTH Coagulation Tests Bleeding Time Clotting Time PT aPTT Coagulation Factor IX (optional)

Slide23

The SF-36 consists of eight scaled scoresEach scale is directly transformed into a 0-100 scale. The lower the score the more disability. The eight sections are: vitality physical functioning bodily pain general health perceptions physical role functioning emotional role functioning social role functioning mental health

Quality of Life SF36 Questionaire

Slide24

At inclusion, no statistically significant difference in the two groups age sex dietary intake SGA CRP and

biochemistry except serum albumin level. Results

Slide25

Results: Biochemical Profile ParametersVisit 1N= 91 N = 87Visit 2N= 77 N= 69Visit

3N= 70 N=58Group1Group2Group1Group2Group1Group2Hemoglobin g/dL9.8±1.89.6±0.79.8±1.719.6±1.810.0±1.69.5±1.56BUN67±35.874±39.674.2±42..479.0±42.59.94±23*87.4±.49Serum Albumin g/dL*3.2 ±0.413.37±0.353.3±0.473.4±0.43.9±0.483.3±0.51CRP * p .016 4.2 ±6.018.7±8.14.1±9.94.6±7.14.5±6.26.4±14.0HbA1c visit 1 and 36.0±1.217.1±1.41 NRN R6.5±1.557.1±1.2Serum LDL

VLDL

HDL

84.9±28.1

26.4±16.8

41.2±12.6

89.6±28.1

16.8±12.5

40.6±12.1

85.2±28.3

27.9±16.4

39.4±13

88.2±28

25.1±15

39±10.3

91±31.5

30.4±19.2

37±11.8

83.1±27

24.±15.7

36.4±11

Potassium

4.8±0.84

6.6±14.3

4.9±.89

5.3±.96

4.7±0.8

5.2±0.9

Phosphorus

4.6±1.17

4.7±1.5

4.5±1.2

4.7±1.6

4.76±1.514.6±1.55Serum Calcium8.1±1.278.2±1.28.3±0.858.4±0.68

8.2±1.38.3±0.75Coagulation PT aPPT12.8±2.134.2±10.512.8±2.534.0±6.912.7±1.834.5±9.912.4±1.935.5±8.013.4±2.0234.8±35.812.7±1.835.8±.94PTH 375±392385±362

NRNR411.6±69424±45

Slide26

Non Dialysis Day Calorie and Protein Intake Repeated Measures ANOVA (Wilk’s Lambda) Sign. Difference between groups p 0.000Visit 1Visit 2Visit 3

SupplementN=91ControlN=87SupplementN=77ControlN=69SupplementN=70ControlN=58Energy*1546.06±397.241607.41±396.721774.73±535.91730.49±408.151891.31±490.651813.26±464.82Protein*48.35±14.251.93±16.465.15±21.8663.49±19.467.05±20.765.36±19.1

Slide27

Dialysis Day Energy And Protein Intake Repeated Measures ANOVA Sign. Difference between groups p 0.000 Visit 1

Visit 2Visit 3SupplementN=91ControlN=87SupplementN=77ControlN=69SupplementN=70ControlN=58Energy1547.52±432.751460.77±418.841596.68±411.561597.14±526.501615.59±445.081585.83±425.93Protein52.9± 17.3448.36±14.161.88±15.97

56.77±15.9

103.09±

363.9

58.98±

15.9

Slide28

24 Hour Dietary Recall - Energy And Protein Intake Repeated Measures ANOVA Sign. Difference Between Groups p 0.000 Visit 1Visit 2

Visit 3SupplementN=91ControlN=87SupplementN=77ControlN=69SupplementN=70ControlN=58Energy1495.06±429.401556.58±428.061571.3±449.691616.63±552.421706.93±490.411686.98±520.73Protein57±19.3159.18±23.453.28±17.6551.37±17.9

61.62±

22.21

59.96±

19.5

Slide29

Effect of ONS on Serum Albumin: Serum albumin significantly increased

(3.3 ±0.48 vs 3.4 ±0.43) and at 6 months serum albumin was higher the controls p= 0.000VariableSupplementN=91ControlN=87SupplementN=77ControlN=69SupplementN=70ControlN=58SupplementN=91ControlN=87SupplementN=77ControlN=69SupplementN=70ControlN=58S Albumin*3.2 ±0.413.37±0.353.3±0.473.4±0.43.9±0.483.3±0.51

Slide30

Paired Comparison using Anova Analysis Significant Difference in Albumin level at 3 and 6 months p=0.000 Higher in supplemented group The serum albumin levels increased significantly to 3.9 g/dL by 6 months in supplemented group and declined significantly in controls (2.0±0.74).

3.3±0.483.4±0.43

Slide31

Change in Hemoglobin from Visit 1 to Visit 3

ParametersVisit 1N= 91 N = 87Visit 2N= 77 N= 69Visit 3N= 70 N=58Group1Group2Group1Group2Group1Group2Hemoglobin g/dL9.8±1.89.6±0.79.8±1.719.6±1.810.0±1.69.5±1.56

Slide32

Effect of ONS on Biceps and Triceps SkinfoldSignificant Difference in visit 2 and 3 p 0.000 Higher in Supplemented Group

VariableVisit 1 N= 89/84Visit 2Visit 3SupplementControlSupplementControlSupplementControlBiceps*10.2±7.28.9 ±5.910.3±7.29.6±5.913.0±7.19.1±6.0Triceps*14±6.012.1±5.014.0±5.613.1±5.116.1±5.112.1±5.1

Slide33

Effect of ONS On Subscapular and Suprailliac Skinfold Significant difference at visit 2 and 3 p=0.000 Higher in supplemented group

Visit 1 N= 89/84Visit 2Visit 3VariableSupplementControlSupplementControlSupplementControlSubscapular*16.9±6.716.5±6.618.5±6.416.5±7.917.0±7.216.4±6.9Supra Illiac*15.9±8.715.2±8.615.1±8.416.0±9.418.1±8.716.8±8.7

Slide34

SGA Score Baseline and at 6 monthsLower SGA Score In Supplemented Group Better Nutritional Status Compared To Controls .

VariableVisit 1 N= 89/84Visit 2Visit 3SupplementControlSupplementControlSupplementControlSGA Score11±5.011±4.5 --8.7±1.89.6±2.3

Slide35

Lower CRP levels In Supplemented Group compared to ControlsParametersVisit 1N= 90 N = 87

Visit 2N= 74 N= 73Visit 3N= 30 N=90CRP * p .016 4.2 ±6.018.1±8.14.1±9.94.6±7.14.5±6.26.4±14.0

Slide36

SF36 Questionnaire: Comparison of Visit 1 and 3.

NoQuestionsP valuesSupplementedGroup p valuesControl Group1In general, would you say your health .0260.0452Compared to one year ago, your health now.0100.0933Vitality: limitation in movements 4400.4024Problems with work or regular daily activities as a result of physical health.0011425Problems with work or other regular daily activities as a result of any emotional problems .004.2436Physical health or emotional problems interfered with normal social activities.005.0817Bodily pain .199

.5668

Social

Role Functioning:

Pain interference

with

work both outside the home and housework

.102

.024

9

Mental Health

.001

.242

10

General health perceptions

0.554

564

11

Final Score

0.001

improved

.047 Poor

Slide37

DISCUSSION

Slide38

DISCUSSION Malnutrition is common in patients with chronic kidney disease (CKD) and adversely affects prognosis. Uremia induced inadequate dietary intake leads to metabolic disturbances, PEW, cachexia, and high rate of morbidity and mortality.

Slide39

HD Treatment Is A Catabolic Event Decreases circulating amino acidsAccelerates rates of whole body and muscle proteolysisPromotes muscle release of amino acids, and Enhances net whole body and muscle protein loss and increases resting energy expenditure (REE HD patients rises from 8 to 16% ). HD patients lose their appetite and reduce their protein and energy intakes spontaneously which makes it difficult to fulfill their daily nutritional requirements and thus promote development of protein energy wasting.

Slide40

DiscussionFurthermore, relatively increased nutritional demands in many dialysis patients magnifies the effects of inadequate protein and calorie intake. The biological relationship is more complicated because of markers such as serum albumin underlying inflammation or illness, rather than poor intake alone.

Slide41

DiscussionThe present study explored effect of renal specific nutritional supplement on hypoalbuminimic patients on maintenance dialysis. Several studies have shown positive effect of ONS on serum albumin level and nutritional status of patients on dialysis.

Slide42

Siren Sezer Long-Term Oral Nutrition Supplementation ImprovesOutcomes in Malnourished Patients With Chronic KidneyDisease on Hemodialysis Journal of Parenteral and

Enteral Nutrition Volume 38 Number 8 2014Sezer etal 2014 conducted a similar study: 3 daily servings of ONS given for 6 months improves serum albumin and anthropometric measures, as well as reduces EPO dose, in patients with CKD.

Slide43

Siren Sezer Long-Term Oral Nutrition Supplementation ImprovesOutcomes in Malnourished Patients With Chronic KidneyDisease on Hemodialysis Journal of

Parenteral and Enteral Nutrition Volume 38 Number 8 2014 ,.

Slide44

Therapeutic Effects of Oral Nutritional Supplements during Haemodialysis : Physician’s Experience Arun B Shah Journal of the association of physicians of india • vol 62 • december, 2014.

Slide45

SH Han & DH Han

Nutrition in Patients on peritoneal dialysisNature Reviews Nephrology 8, 163-175 (March 2012)Effects of oral supplements on nutritional status in patients on peritoneal dialysis

Slide46

Our StudyProtein-rich renal specific nutritional supplement given daily along with standard nutritional diet of 1.2 g/kg/d raised serum albumin and increased skin fold thicknes in patients with PEW undergoing dialysis.Hemoglobin level increased in supplemented group but the difference between groups was not significant.Body composition improved

significantly (p 0.003) as evident from increased of skinfold thickness in the supplemented group compared to controls.At the end of the study, patients in supplemented group showed improvement in nutritional status compared to controls.

Slide47

Our StudyThe functional capability as per SGA score improved significantly in supplemented group compared to control (p=0.001).There was significant

improvement in Quality of life of supplemented group after 6 months in terms of vitality, emotional, mental and social health.

Slide48

Our StudyBUN and serum potassium and HbA1c were significantly high in the control group compared to supplemented group.There was no significant difference between groups in serum calcium , phosphorus, lipid profile coagulation profile and PTH levels.

Slide49

ConclusionProtein intake is a key point to maintain an adequate nutritional status in hemodialysis (HD) patients.Given the poor dietary intake of adequate energy and protein in dialysis patients, renal specific dietary supplements form the most effective measure to improve nutritional status and quality of life

of patients on dialysis to correct PEW.

Slide50

References1. Kovesdy CP, Kalantar-Zadeh Why is protein-energy wasting associated with mortality in chronic kidney disease? Semin Nephrol. 2009;9:3-14.2.

Lowrie EG, Lew LN Death risk in hemodialysis patients: the predictive value of commonly measured variables and an evaluation of death rate differences between facilities. Am J Kidney Dis. 1990;15:458-482.3. Dukkipati R, Kopple JD Causes and prevention of protein-energy wasting in chronic kidney failure. Semin Nephrol. 2009;29:39-49.4. Caglar K Therapeutic effects of oral nutritional supplementation during hemodialysis. Kidney Int. 2002;62:1054-1059.5. Siren Sezer Long-Term Oral Nutrition Supplementation Improves Outcomes in Malnourished Patients With Chronic Kidney Disease on Hemodialysis JPEN J Parenter Enteral Nutr 2014 Nov; 38(8): 960–965.6. SH Han & DH Han Nutrition in Patients on peritoneal dialysis Nature Reviews Nephrology 8, 163-175 (March 2012)7. Plata-Salaman CR. Leptin and anorexia in renal insufficiency. Nephron Clin Pract 2004;97:c73–5.

Slide51

ReferencesSharma M, Rao M, Jacob S, Jacob CK. A controlled trial of intermittent enteral nutrient supplementation in maintenance hemodialysis patients.

J Ren Nutr. 2002;12:229-237. Cano NJ, Fouque D, Roth H, et al; French Study Group for Nutrition in Dialysis. Intradialytic parenteral nutrition does not improve survival in malnourished hemodialysis patients: a 2 year multicenter, prospective, randomized study. J Am Soc Nephrol. 2007;18:2583-2591.Moretti HD, Johnson AM, Keeling-Hathaway TJ. Effects of protein supplementationin chronic hemodialysis and peritoneal dialysis patients. J Ren Nutr. 2009;19:298-303. Beutler KT, Park GK, Wilkowski MJ. Effect of oral supplementation on nutrition indicators in hemodialysis patients. J Ren Nutr. 1997;7:77-82.Kuhlmann MK, Schmidt F, Kohler H. High protein/energy vs. standard protein/energy nutritional regimen in the treatment of malnourished hemodialysis patients. Miner Electrolyte Metab. 1999;25:306-310.Holley JL, Kirk J. Enteral tube feeding in a cohort of chronic hemodialysis patients. J Ren Nutr. 2002;12:177-182. Kalantar-Zadeh K, Braglia A, Chow J, et al. An anti-inflammatory and antioxidant nutritional supplement for hypoalbuminemic hemodialysis patients: a pilot/feasibility study. J

Ren

Nutr. 2005;15:318-331.Scott MK, Shah NA,

Vilay

AM, Thomas J III, Kraus MA, Mueller BA. Effects of

peridialytic

oral supplements on nutritional status and quality of life in chronic

hemodialysis

patients.

J

Ren

Nutr

. 2009;19:145-152.

Slide52

THANKYOU

Slide53

An Open Label, Randomized Clinical Study To Evaluate The Impact Of ProSeventy Efficacy & Safety In Dialysis Patients IMPROVES Trial Protocol No PBL/PROS/07-11