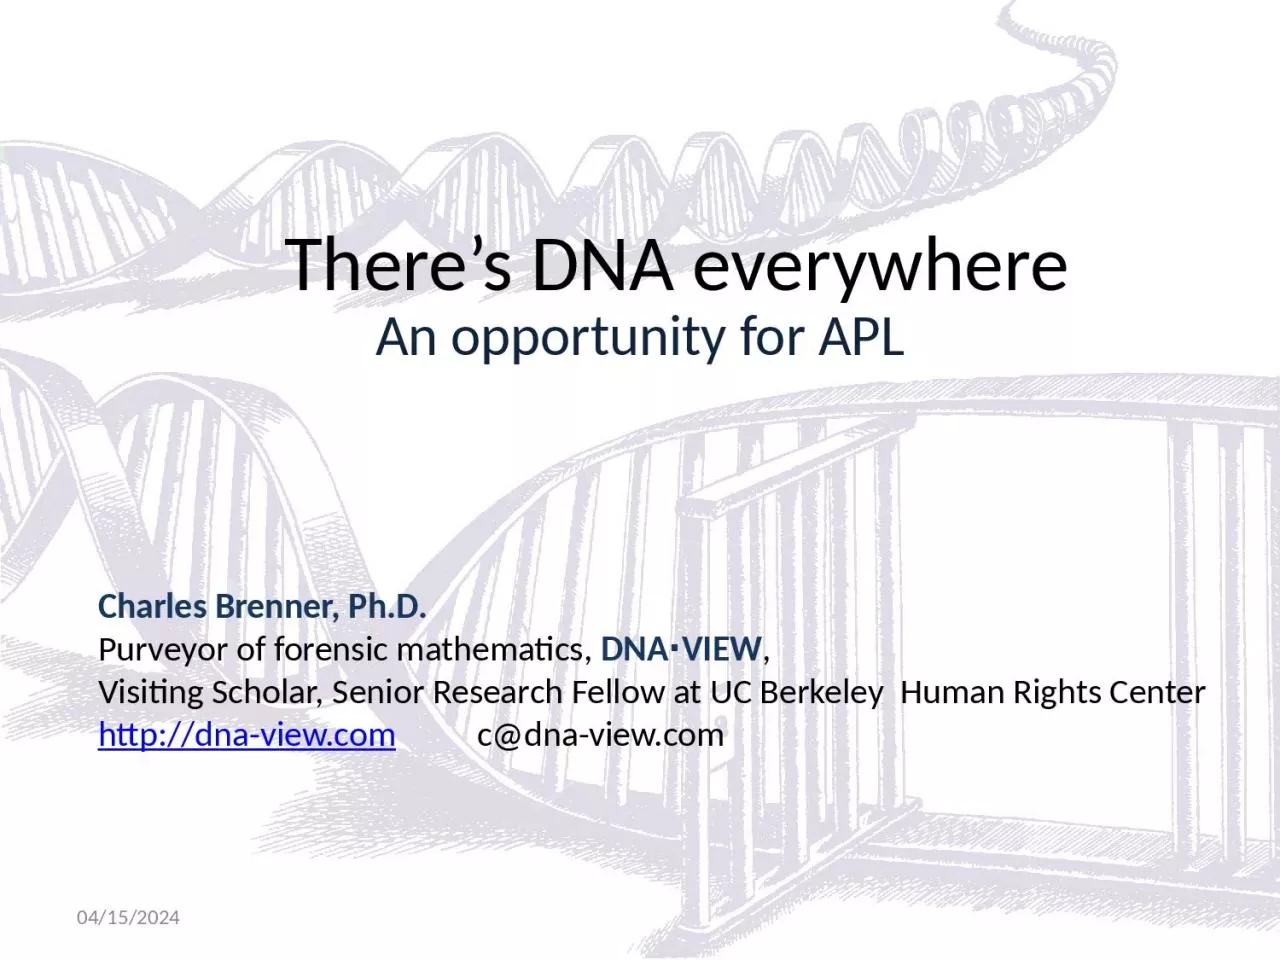
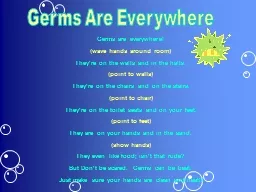
/
There’s DNA everywhere There’s DNA everywhere

There’s DNA everywhere - PowerPoint Presentation

Honeybunches
Honeybunches . @Honeybunches
Follow
342 views
Uploaded On 2022-08-01

There’s DNA everywhere - PPT Presentation

Charles Brenner PhD Purveyor of forensic mathematics DNAVIEW Visiting Scholar Senior Research Fellow at UC Berkeley Human Rights Center httpdnaviewcom cdnaviewcom ID: 932052

2014 amp dna mixture amp 2014 mixture dna forensic suspect 1unk peak proportions copies model likelihood pairs 2unk contributor

Share:

Link:

Embed:

Download Presentation from below link

Download Presentation The PPT/PDF document "There’s DNA everywhere" is the property of its rightful owner. Permission is granted to download and print the materials on this web site for personal, non-commercial use only, and to display it on your personal computer provided you do not modify the materials and that you retain all copyright notices contained in the materials. By downloading content from our website, you accept the terms of this agreement.


Presentation Transcript

Slide1

There’s DNA everywhere

Charles Brenner, Ph.D.Purveyor of forensic mathematics, DNA∙VIEW,Visiting Scholar, Senior Research Fellow at UC Berkeley Human Rights Centerhttp://dna-view.com c@dna-view.com

9/21/2014

An opportunity for APL

Slide2
DNA Mixtures past & future

What –

traditional (rape, murder(fingernail), …)Now (gun grip, ski mask, grab touch)Lots more mixturesCases with many suspectsMixtures with many possible references, or total # of contributors Calculation historyBinary (combinatory; exclusion)Square pegsSimplifications favor the guiltyContinuousUndefined terms – careless definitions impede progresscontributor

9/21/2014

Slide3

The broad picture

DNA·VIEW® forensic DNA software since 1988APL since 1967IBM, STSC, self (Sharp, DNA)Mathematics since 19-aught-50Struggling with Windows since 20049/21/2014

Slide4

D7 allele frequencies

What & why forensic mathematics?

Forensic DNA properties

Digital

Individualizing

Genetic

Applications

Direct match

Kinship (paternity, body id, inheritance)

Mixtures

9/21/2014

Slide5

Mole troubles?

Call Avogadro 6.02×10²³How many base-pairs in the human genome?3.6 picograms of DNA/cell (usually cited as 5-6pg)660 daltons per nucleotide pair (A&T or G&C)nucleo

side←sugar+base←A or T or G or Cn’

t

ide

pair←2×n’

t

ide←phosphate+n’

s

ide

I.e

. 660 g of DNA is Avogadro # of pairs

Gram of DNA is (

Avog

#)/660 = 0.94×10

21

pairs

One cell of DNA

is 0.94x10

21

x

3.6x10

-12

=3.3×10

9 pairs

mouse<human<tobacco9/21/2014

Slide6

Size of the human genome

2m = stretched length of DNA from 1 cell1km if scaled to the thickness (1μm) of spider webIn total 1mm of which would represent the 15-20 segments (“loci”) typically used for forensic identification.9/21/2014

Slide7

7

Human Genomehttp://www.ncbi.nlm.nih.gov/genome/guide/

1 2 3 4 5 6 7 8 9 10 11 12

13 14 15 16 17 18 19 20 21 22 X Y

46 chromosomes

Two each of 1-22 (

autosomal

)

XY or XX are the 23

rd

pair (sex).

Slide8

8

Forensic STR markerslocus TH01 (tyrosine hydroxylase), at position 11p15.5. (one locus, two loci)Tetrameric repeat (AATG)3-13E.g. a person might be {8,10} at TH01 – 8 tandem copies of the motif on one #11 chromosome, 10 copies on the other.

A DNA profile

is typically

16

or so loci – e.g. {13,15}, {28,28}, {8,10}, …

Slide9
Mixture analysis

9/21/2014

Suspect: (13,16) (29,32.2) (8,11) (11,12) …Forensic calculation: Ratio of likelihoods to see this mixture picture if(Hprosecution) the suspect was a contributor, versus(Hdefense) the suspect was not a contributor.What is “this mixture picture”? Olden days: the list of alleles (x-axis numbers) observed.Recent 2-5 years: Try to also consider the peak heights.

Slide10

PCR process (where the data comes from)

9/21/2014Double stranded DNA (“sense” & “anti-sense”) template [variable repeat region]▪ ▪ ▪ (P1 binding site) ▪ ▪ ▪ GATA GATA GATA GATA ▪ ▪ ▪ ▪ ▪ ▪ ▪ ▪ ▪ CTAT

CTAT CTAT

CTAT

▪ ▪ ▪ (P2 binding site)

DNA “template” (infinite in both directions)

Copies of template (infinite in one direction)

Copies of copies (short

amplicons

)⌊

2c copies after c cycles

2

c-1

copies after c cycles

Slide11
PCR amplification

Polymerase Chain Reaction

cell → 229 copies of the 16 pairs of forensic loci40 cells enough “copies”Amplicons (molecules), 70-300bpFlorescent dyeCapillary electrophoresis9/21/2014

Slide12
Mixture analysis – height variation

9/21/2014

Peak heights vary becauseDifferent #s of cells left by different donors (e.g.80 vs 300)± random variation fromimperfect PCR replication processmolecular sampling (pippeting etc post-amplification)Consequences#1→peak heights correlated between loci“dropout”: allele peak too small to notice

Slide13

Why peak-height sensitive analysis?

ProsHandle dropout!More accurateOld models dishonestOld models biased against the innocentConsMuch more difficultAllele sizes (12, 13 etc) are independent across loci ∴ compute per-locus & multiplyPeak heights are correlated across lociHow to iterate through 1039 genotypes?

9/21/2014

Slide14
Towards a more realistic model

Must cope with dropout

Suspect allele not seen (at threshold)Can’t exclude suspect; we know dropout possibleCan’t ignore the locus – unfair to suspect.⇒Need probabilistic dropout treatment.⇒Model dropout as stochastic phenomenon⇒Consider continuum of signal intensity⇒Continuous model9/21/2014

Slide15
Recall the forensic math context

9/21/2014

Suspect: (13,16) (29,32.2) (8,11) (11,12) …Forensic calculation: Ratio of likelihoods to see this mixture picture if(Hprosecution) the suspect was a contributor, versus(Hdefense) the suspect was not a contributor.More specifically …

Slide16
How does Mixture Solution™ work?

Mixture profile = observed signals & intensities

Compare hypotheses Hp & Hd; Hypotheses Hi are e.g.: “Mixture is explained as references C, T, & maybe some unknowns.”LR (likelihood ratio) is a ratio of L’s (likelihoods):9/21/2014

Mixture model (in part)

Slide17

Visualizing an

Hp(Prosecution)W= Victim + Tug Scumbag + 1 unknown 9/21/2014

expected height

Slide18
Planning

Mixture SolutionThe guts is the likelihood function L:

L=Pr(evidence | hypothesis)Evidence: the mixture alleles & heights as observedHypothesis: Mixture comes from … S+ 2 unknownsEvaluation of L depends on our model(old way) mixture is a collection of alleles(new way) … and also of heights (clue to dosage)9/21/2014

Slide19

70:30

9/21/2014

Slide20

30:70

9/21/2014

Slide21

30unk:70

9/21/2014

Slide22
What goes into calculating L?

DNA profiles: mixture (including peak height); references.

There are some “nuisance variables”: # of unknownsGenotypes of unknownsMixture contributor proportions for references & unknownsRace of each unknownAtomic calculation = Pr(Mixture | references & specific a-d)L = Atomic calc & eliminate all nuisance variables either byOptimizing – find & use best value (races, # unknowns), or Averaging over all possible values (genotypes, mixture proportions)E.g. consider all 1039

genotypic combinations of 3 unknowns

9/21/2014

0? 2?

(11,12)(11,13) (8,9.3)(9,10)

Slide23
Why old way easy & new way hard

Old way: just alleles

Evidence E={ED8, EvWA,…}L = Pr(E|H) = Pr(ED8|H)xPr(EvWA|H) …because junk DNA uncorrelated between lociCalculations: (15 loci)x(20 genotype-pairs/locus)=300 Pr’sNew way: also heightsInter-locus info connectedBig signals tend to have same sourcePr’s not independent; seemingly can’t multiply.

Calculations: (20 genotype-pairs)(15 loci

)

=

1E20 Pr’s

9/21/2014

D8

10 11 14 16

vWA

7 9 10 12

10 11 14 16

7 9 10 12

Slide24
Organizing out of trouble

L computation includes

(old way’s) “combinatorial factor” – can iterate per locus, wholesale computing all the pairs (let’s say) of unknown genotypes (“unks”)“fit factor” – sticking point as depends on template quantities.TroubleFor each of the 1e20 combinations of unks, some pair of template quantities maximizes the Pr(Evidence|these unks)One out: MCMC, limiting consideration to the important profiles.Better ideaOuter loop iterates/searches through mixture proportionsConditional on mixture proportions, loci ARE independent.Then loop on lociLoop on unks (handle both combination & fit factors).

9/21/2014

Slide25
Out of trouble

Calculation, not simulation

All genotype combinations for unknownsFast, with attendant benefitsEasier to test, debug, use, validateEasier to see the forestWhat’s the total solutionIntegrate over mixture proportionsComplicated forensic cases have many possible references, many mixture computations9/21/2014

Slide26

9/21/2014

multiway mixture analysisLots of Hp’s

Slide27

9/21/2014

multiway mixture analysisLots of Hp’s

Lots of

Hd’s

Lots of combinations to consider, e.g.

Hp = SVB + unknown Caucasian

vs

Hd

= V + unknown Korean + 2 unknown Black

V

V

ictim

S Tug

S

cumbag

B

B

oyfriend(?)

Automated expertise

Slide28
Results so far

5 mixture exercises from NIST (gov’t

agency)100+ labs, all leading programs submittedMixture Solution alone got all correctExercise for “mixture jamboree” (next week)2 suggested references, paradox detected by M.S.:Included one is non-contributor; non-included isTesting by various labsCautious use in casework9/21/2014

Slide29

Where does it stand?

Current stateWorks extremely well alreadyProgram explores alternatives, decidesSome labs experimenting with it.Fast & easy to use.PlansWindows release this year. Lots of work remainingMixture Solution features & infrastructureLater add remaining DNA·VIEW modules (Kinship, Paternity, MVI, etc.)I need help!Questions? Comments?

9/21/2014

DNA garden

Charles Brenner, PhD

c@dna-view.com

http://dna-view.com

Slide30
Visual aids

Stochastic variation model

9/21/2014One σ of peak height ratioModeling simplification – one stochastic rule explains allelic height variation / peak height ratio stutter variation dropout

dropin

Slide31
Mixture analysis concepts

Traditional

Likelihood ratioTwo hypothesesAlleles seen“Contributor”# contributorsModernLikelihood ratioMany hypothesesLikelihoodFlorescent signalContinuumFuture: quantized?Degree of contribution

9/21/2014

Slide32
Mixture Solution™ example

Samples

W = sexual assault mixture, ≥20rfu V = Victim reference profileS = suspect Tug Scumbag profileLikely hypotheses – W consists of …Hp: V, S, & 0+ unknownsHd: V & some unknowns9/21/2014

Slide33

Visual aid –

EPG & contributor proportions Hd(Defense)W= Victim + 2 unknowns

9/21/2014

Slide34

(artificial) hypothesis fits data well

Hp(Prosecution)W= Victim + Tug Scumbag +

?B

oyfriend

9/21/2014

Slide35

Likelihood Ratios against Tug S

cumbag9/21/2014LR Hp/Hd

Hd1=VB&1unk

Hd1=VB&2unk

Hd0=V&2unk

Hd0=V&3unk

Hd0=V&1unk

Hp1=VBS&0unk

6.07E+10

1.60E+15

1.89E+26

1.32E+30

4.00E+55

Hp1=VBS&1unk

2.90E+06

7.65E+10

9.03E+21

6.29E+25

1.91E+51

Hp0=VS&1unk

1/439700

0.06004

7.09E+09

4.94E+13

1.50E+39

Hp0=VS&2unk

1/7.775e9

1/294600

400900

2.79E+09

8.47E+34

LRs at optimum (i.e. maximum likelihood) mixture proportions

(4 minutes)

LR Hp/

Hd

Hd1=VB&1unk

Hd0=V&2unk

Hp1=VBS&0unk

2.69E+10

5.84E+24

Hp0=VS&1unk

1/656800

3.30E+08

Averaged over mixture proportions

(10 minutes)

Legitimate hypotheses

Best answer

Artificial hypotheses

Slide36

Maximum likelihood proportions why?

No good reason. Tired?Should average over all proportions.Averaged ( ∫ ) over all proportionsLR ( VS&1unk / V&2unk) = 3.3E+08results – likelihood ratios

9/21/2014

LR Hp/

Hd

Hd

=V&2unk

Hd

=V&3unk

Hd

=V&1unk

Hp=VS&1unk

7.09E+09

4.94E+13

1.50E+39

Hp=VS&2unk

400900

2.79E+09

8.47E+34

Hp=VS&0unk

0

0

0

At optimum (i.e. maximum likelihood) mixture proportions

Slide37
Input & output

Import mixture & reference profiles

Allele calls, peak heights, etcOsiris or GeneMapperThreshold: minimal (30rfu?)ChooseMixture Hypotheses (any #)Range of #s of unknownsRace(s) of interestAdvanced parametersStochastic modelTime budgetOutputLikelihood ratiosVisual Aids

9/21/2014

Slide38
Model attributes

Biochemical model

As complicated as necessaryAs simple as possibleTesting, speed, flexibility, reliabilityCasework modelMany suspects and/or possible hypothesesAutomatic evaluation decides among hypothesesSimple yet conservative?Defense-friendly stochastic model 9/21/2014

Slide39
Validation & Verification

Validation

Visual aids help greatlyRobust: not sensitive to parameter variationExcellent NIST 2013 & ISHI test resultsTest against known mixture suitesTest against special casesCalibrationshould use comparable validation samples (but see ►)9/21/2014►

Related Contents


Next Show more