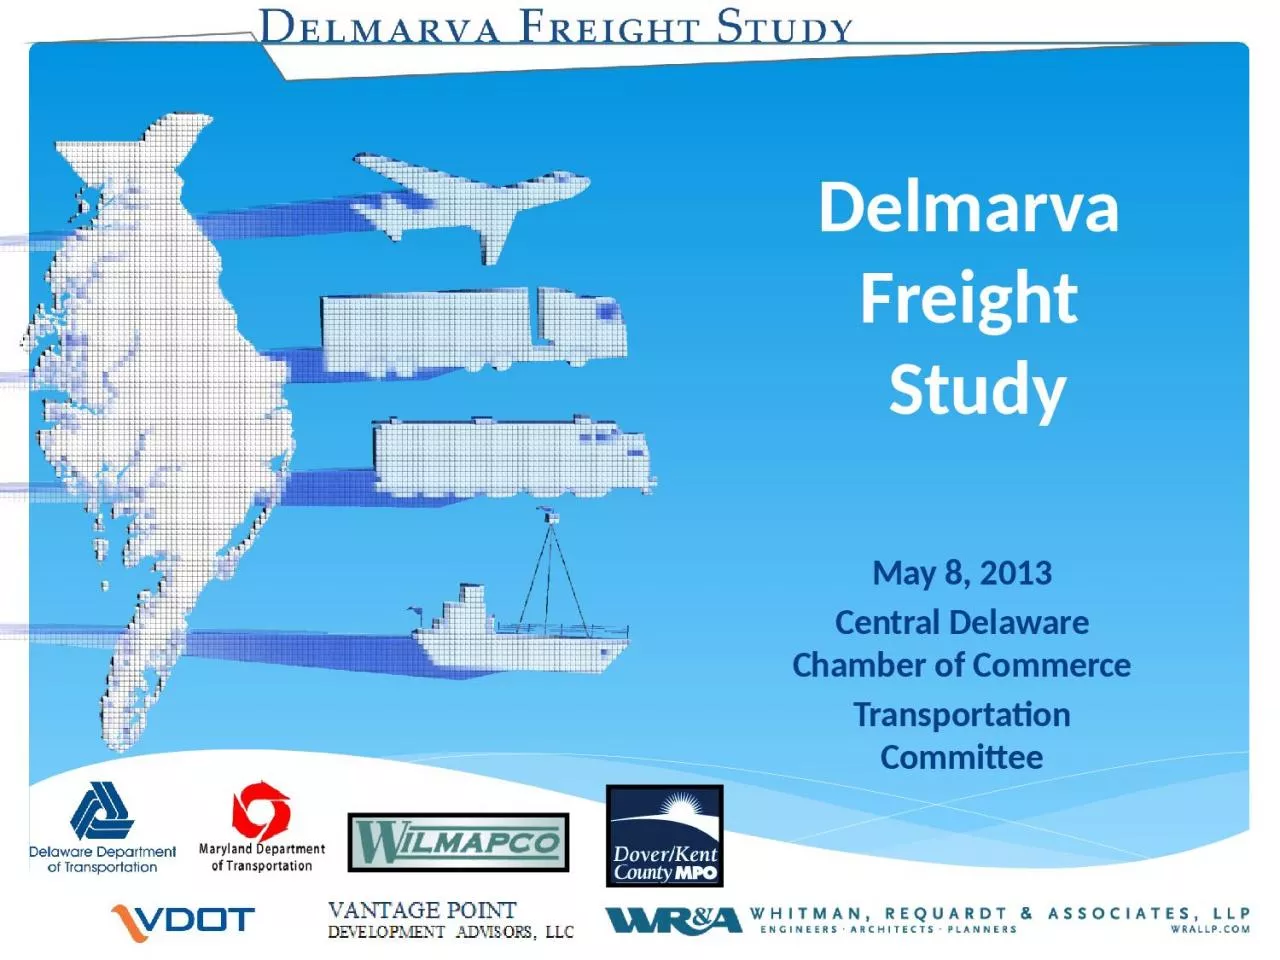
/
May 8, 2013 Central Delaware Chamber of Commerce May 8, 2013 Central Delaware Chamber of Commerce

May 8, 2013 Central Delaware Chamber of Commerce - PowerPoint Presentation

Hulksmash
Hulksmash . @Hulksmash
Follow
343 views
Uploaded On 2022-07-28

May 8, 2013 Central Delaware Chamber of Commerce - PPT Presentation

Transportation Committee Delmarva Freight Study Agenda What is the Delmarva Freight Study Moving Ahead for Progress in the 21 st Century MAP21 ID: 931377

amp freight rail transportation freight amp transportation rail delmarva industry related county infrastructure outreach economic truck potential traffic factors

Share:

Link:

Embed:

Download Presentation from below link

Download Presentation The PPT/PDF document "May 8, 2013 Central Delaware Chamber of ..." is the property of its rightful owner. Permission is granted to download and print the materials on this web site for personal, non-commercial use only, and to display it on your personal computer provided you do not modify the materials and that you retain all copyright notices contained in the materials. By downloading content from our website, you accept the terms of this agreement.


Presentation Transcript

Slide1

May 8, 2013Central Delaware Chamber of CommerceTransportation Committee

Delmarva Freight Study

Slide2

Agenda

What is the Delmarva Freight Study?

- Moving Ahead for Progress in the 21

st

Century

MAP-21

2. Efforts to date

- Economic/Industry Factors

- Data Collection- Development of CUBE Cargo3. Possible Scenarios/Document Development4. Next Steps

Slide3

A multi-state, multi-MPO effort to develop a comprehensive, multi-modal evaluation of the freight transportation system and its operations along the Delmarva Peninsula.

According to MAP-21, States

are highly recommended to have a freight plan which can improve their

ability to

meet

National

Freight

Policy goals & objectives.

Not a requirement, but in order for some projects to be eligible for fed $, they

must come from a freight plan

! What is the Delmarva Freight Study?

Slide4

Key Functions of Study

Collect Most Recent Commodity Flow Data:

- Transearch

, FAF2, FAF3,

- Surface Transportation Board Waybill

Conduct Outreach

(Agencies, Industries & Shippers)

Develop

CUBE Cargo ModelGenerate Current/Future Freight Forecasts for Multiple Modes (Truck, Rail, Water, Pipeline)Analyze Future Freight Planning Scenarios

Slide5

ECONOMIC/ INDUSTRY FACTORS

Freight traffic in Delmarva region is highly concentrated. Five commodity groups constitute over 70% of the region’s truck traffic.

Slide6

Demographic Data AnalysisCommodity Flow & Households

Growth in Households

willDrive

Internal Peninsula Shipments

of Secondary

Traffic to

Meet the Demand

of Consumers.

Employment

in the Top

4 Freight Related Industries is over 1/3 Total Employment, Half of which is in Trade, Transportation & Utilities.ECONOMIC/ INDUSTRY FACTORS

Slide7

Industrial OutlookU.S. Spends Only 1.7% of its GDP on Transportation Infrastructure while

CanadaSpends 4% & China Spends 9% . (Source: KC Smartport

Supply Chain Centered)Infrastructure

Deficiency Decreases Productivity Per Worker, Critical Job

Opportunities

are Lost in Highly Skilled & Well-Compensated

Non-Transportation

Sectors

Throughout the Economy.

(Source; Report by American Society of Civil Engineers, 2011

)Implications for Delmarva: With the Major Congestion Issues, ResidentialEncroachment, the Need for Improved Motor Freight, Barge & Potential RailService is Critical, there is a Strong need to Address the InfrastructureDeficiencies

& Provide Support / Improvement Where Possible.

Peak

Seasonal Traffic Coincides with the Need for Motor Freight Traffic to

Serve

Peak

Seasonal Population, Creates Additional Congestion Issues Related

to

Freight

Movement, Economic Stability & Quality of Life.

Slide8

Data Collection

Transearch (IHS Global Insight)FAF 2, FAF 3STB Waybill (Rail)

Slide9

Transearch

(IHS Global Insight)

Slide10

Delmarva’s Major Industries Have Different Freight Flow Characteristics:

FoodPetroleum

Slide11

Analysis and Stakeholder Research

Slide12

Status Updates

Stakeholder Outreach

Online Survey: Specific Problems / Areas of Concern

Slide13

Status Updates

Stakeholder Outreach

Online Survey: Key Infrastructure Related Improvements

Slide14

Status Updates

Stakeholder Outreach

Online Survey: General Comments

36% Miscellaneous Infrastructure Improvements

25% Truck Restrictions (height, weight, width, hazmat)

17% Northeast Corridor Constraints

11% Rail Restrictions (height, weight, width)

11% Short Line Railroad Support

Slide15

Rail

NEC / Chesapeake Connector

Delmarva Secondary / Indian River Coal75 Rail Car Capacity

Cape Charles Rail Car Float

Ports

Post-Panamax

New Markets

Inland Waterways

Nanticoke & Wicomico Rivers

Spoil Sites for Dredged Materials

Motor FreightSeasonal / Tourist-Based CongestionSecondary Roads / BridgesFuel Taxes / Toll Rates / Weight LimitsParking & Rest Areas

Air Freight

Areas of Concern (from Outreach):

NEC

Indian River

Coal Plant

Delmarva

Secondary

Baltimore

VA or …

PA or …

Wilmington

Nanticoke

Wicomico

Cape Charles

Rail Car Float

Slide16

Sussex

County

Wicomico

County

Cecil

County

New Castle

County

NASA

Salisbury

Seaford

Dogfish Head

Brewery

PBF Energy

Poultry

Fracking

Growth & Industry

Cecil County

New Castle County

Sussex County

Wicomico County

DAFB Civil Air Terminal

Site-Specific Issues

PBF Energy Rail Expansion

Dogfish Head Brewery Expansion

Seaford Multimodal Connectivity

Salisbury Multimodal Connectivity

NASA Wallops Flight Facility

Import-Export

Fracking Materials to Marcellus Shale

Crude Oil from Canada or Midwest

Grain

from

Midwest

Frozen Poultry to Russia

Enterprise Zones / Other Incentives

Areas of Opportunity (from Outreach):

Petroleum

Grain

Crude Oil

Slide17

Scenario Development

Slide18

Scenario Planning

Performance Based Approach

Include performance measures

to guide freight-related transportation decisions

Retain consistency w/ the

National Freight Strategic Plan

Tie each measure to each goal

to indicate how well the system is achieving that goal

Reflect measures of

conditions

of infrastructure and of service performanceReflect outcomes that are directly important to system users and the general publicAvoid measures that are not of direct importance to users or the general public

Slide19

Scenario Planning

Economic Evaluation

Qualitative screening relative to scenario-specific issuesReview of low-medium-high levels of impact

Review of global factors or unknowns vs. potential for “missed” opportunities

Address industry-specific

impacts of changes

in:

Freight costs, availability, reliability, and time

Related impacts

on jobs and

payrollsSecondary / multiplier effects on jobs and payrollsSecondary / multiplier effects on fiscal and tax impactsAdd’l research: cost of goods movement as a % of overall costsAdd’l research: industry-specific elasticities (e.g., tourist impact vs. congestion)

Slide20

Scenario Planning

Cube Cargo Evaluation

Potential Measures of Effectiveness include:Travel Time

to Market by Mode

Level of Service

Delay

Transportation Cost by commodity and mode

Emissions

Truck Volumes

on Roadways

Freight Demand by ModeAdd’l research: Cost assumptions for freight movement by mode

Slide21

Potential Scenarios: Two Types

NASA

Dogfish Head

Brewery

PBF Energy

Poultry

Petroleum

Grain

Crude Oil

NEC

Indian River

Coal Plant

Delmarva

Secondary

Cape Charles

Rail Car Float

Factors to

React to

. . .

Rail Service Loss

Port Expansion or Market Shifts

Post-

Panamax

Impacts

Inland Waterway Loss

Truck Transportation Costs

Energy Market Trends (Coal

, Oil)

Fulfillment Services Trends

Factors to

Influence

. . .

Rail Service Efficiencies

Intermodal Infrastructure

Port Access Enhancements

Infrastructure Preservation

Truck Transportation Policies

Freight Network Connectivity

Land Use Preservation

POLICIES

&

PROJECTS

Slide22

Next Steps

PART 1

PART 2

Slide23

Establish Regional Advisory GroupMAP 21 (Section 1117): Establish a state freight advisory committee consisting of a representative cross-section of public and private sector freight stakeholders, including representatives of ports, shippers, carriers, freight-related associations, the freight industry workforce, the transportation department of the state, and local governments.

Other Steps

Advise the State on

freight-related priorities

, issues, projects, and funding needs;

Serve as a

forum for discussion

of State decisions affecting freight transportation;

Communicate and coordinate

regional priorities with other organizations;

Promote the sharing of information between the private and public sectors on freight issues Participate in the development of the State’s Freight Plan and it’s implementation.

Slide24

Other Steps

Delaware Chemical Supply Chain Analysis

Produce detailed supply flows into Delaware’s chemical supply chains and emerging chemical industry market trends or logistics practices to identify potential opportunities for economic development or changes in the State’s freight system that could strengthen supply chain performance.

Status: Pending approval from WILMAPCO Council in May

Potential

Supply

Chain

Analyses

Agriculture / Poultry

Secondary Traffic Export-Related Locations Others !

Slide25

Questions???