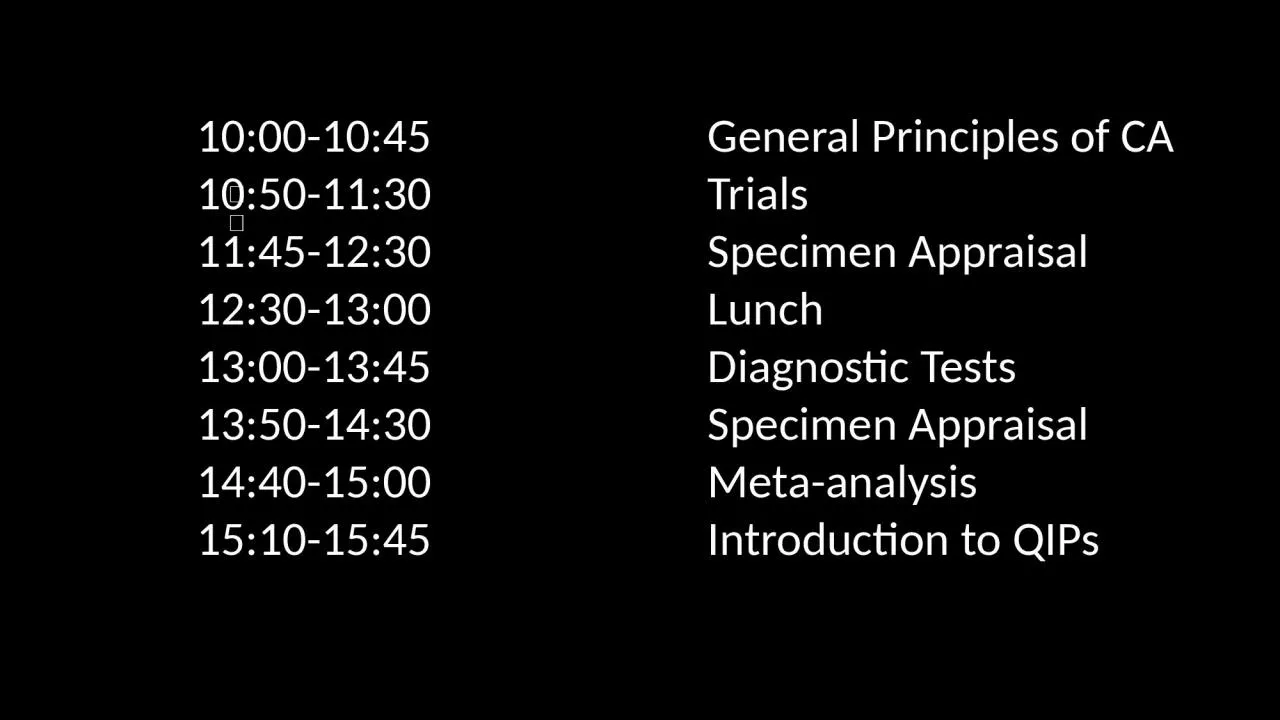
10501130 Trials 11451230 Specimen Appraisal 12301300 Lunch 13001345 Diagnostic Tests 13501430 Specimen Appraisal 14401500 Metaanalysis 15101545 Introduction to QIPs ID: 934970
Download Presentation The PPT/PDF document " 10:00-10:45 General Principles of ..." is the property of its rightful owner. Permission is granted to download and print the materials on this web site for personal, non-commercial use only, and to display it on your personal computer provided you do not modify the materials and that you retain all copyright notices contained in the materials. By downloading content from our website, you accept the terms of this agreement.
Slide1
10:00-10:45
General Principles of CA
10:50-11:30
Trials
11:45-12:30
Specimen Appraisal
12:30-13:00
Lunch
13:00-13:45
Diagnostic Tests
13:50-14:30
Specimen Appraisal
14:40-15:00
Meta-analysis
15:10-15:45
Introduction to QIPs
Slide2Principles of Critical AppraisalAdrian Boyle MD FCEM
Slide3Aims and objectivesWhat explains a study findingThe top five
Slide4Best Buys
Slide5Other Best Buys
Slide6Observational studiesCase-controlCohort Cross-sectional Think in terms of Time, Outcome, Exposure and Population
Slide7COHORT STUDIES
Exposure
No Exposure
?Outcome
?Outcome
Time
Slide8CASE CONTROL STUDIES
Outcome
No Outcome
? Exposure
? Exposure
Time
Slide9Cross-Sectional design
Outcome
No Outcome
? Exposure
? Exposure
Slide10Mystery Study Design
Exposure
No Exposure
?Outcome
?Outcome
Time
Slide11Other observational studiesEcological studiesMigrant studiesCase seriesCase reports
Slide12Intervention studiesExposure status of the subject is assigned by the investigatorRandomisation and blinding
Slide13Reliability and ValidityReliability Validity= =Repeatibility Relationship to truth
Slide14Validity Measured value
Reliability
High
Low
High
Low
Slide15The traditional hierarchyMeta-analysis and Systematic reviewsRCTs with significant resultsRCTs without significant resultsCohort studiesCase control studiesCross-sectional studiesCase reports and series
Slide16Actual StudyTo evaluate the role of hard contact lens as a risk factor for keratoconus, 162 keratoconus patients were compared to 1248 individuals who wore soft contact lens The ‘soft’ group was observed over six years. The authors found that 26.5% of the keratoconus patients wore hard contact lens before diagnosis and only one ‘soft’ patient developed keratoconus
Slide17Actual StudyThe authors conclude that hard contact lens use is associated with keratoconusWhat study design is used?Do you agree with the authors?
Slide18Actual StudyThis study is not comparing the rate of exposure among cases and controls (Case control)This study is not comparing the rate of outcome among exposed and non-exposed (Cohort)This is uninterpretable
Slide19The Big FiveBiasConfoundingChanceFraudCausality
Slide20Point of statisticsEvaluate role of chanceHow likely is it that this result could have occurred by chance?Quantify effectHow many of my patients will get better if I give them this treatment?Adjust for multiple confoundersRegression analysis
Slide21ChancePowerWhat is the chance of detecting a difference if one truly existed95% Confidence IntervalsLarger studies have less random error around the estimate ‘Increased Precision’Preferable to p-values as confirm both a hypothesis and indicate precision
Slide2295% Confidence IntervalsCRASH 2 Relative Risk 0·91, 95% CI 0·85–0·97; p=0·00353CPO Relative Risk 0.85, 95% CI 0.82-1.03, p= 0.056 Relative Risk 0.89, 95% CI 0.02-10.5, p= 0.23
Slide23Confidence Interval of the differenceMeasure the differencebetween two means and estimate the precision of that difference ‘The difference between the two groups was 10 (95% CI 8-12)’
Slide24Confounding ‘A variable that is associated with both the exposure and the outcome of interest’
Smoking
Cirrhosis
Slide25Confounding ‘A variable that is associated with both the exposure and the outcome of interest’
Smoking
Cirrhosis
Boozer
Slide26Adjusting for multiple confounders
Exposure
Outcome
Slide27Aim of regression analysis
Exposure
Outcome
Slide28BiasA systematic distortion of the attributes of the population, exposure or outcome that undermines the validity of the findingsE.g response bias, a postal survey of 1000 patients one week after discharge from ITU found that all were very pleased with their care, response rate of 20%
Slide29FraudHarder to detectLook for conflicts of interestBe wary of commercially sponsored trials in highly selected patientsBe wary of the pretty woman bearing muffinsSeeding studies
Slide30Obvious and not so obvious fraud
Slide31CausalitySome interventions do workHow do you know whether an association is causal?Try to decide whether they work with your patients
Slide32Causal? Bradford Hill CriteriaStrong associationConsistent across study designsPlausibleTemporalSpecificBiological gradientCoherenceExperimental evidence RCTAnalogy
Slide33Measures of effectRelative risk reductionincidence in exposed incidence in non exposedAbsolute risk reductionincidence in exposed – incidence in non- exposed
Slide34Number Needed to Treat / HarmInverse of the absolute risk reductionRandomised controlled trial of asprin and thrombolysis versus nothing for MIs, outcome death at 7 days
Slide35Results : relative risk
16% Died
20% Died
Intervention
No Intervention
What is the relative risk reduction ?
Slide36Results : relative risk
16% Died
20% Died
Intervention
No Intervention
Relative risk reduction is
0.16/ 0.2
0.8
Slide37Results : absolute risk
16% Died
20% Died
Intervention
No Intervention
What is the absolute risk reduction and the Number Needed To Treat?
Slide38Results : absolute risk
16% Died
20% Died
Intervention
No Intervention
Absolute risk reduction is
0.2 – 0.16
0.04
Slide39Number needed to treat1/ 0.04 = 25
Slide40Sources of biasSelection Performance Losses to follow up Detection
Slide41What bias is there here?
Population 200
Exposure 1
100
Outcome
10
Randomisation
Exposure 2
100
Outcome
12
15
Slide42Is this bias?
Population 2000
Exposure1
100
Outcome
10
Randomisation
Exposure 2
100
Outcome
50
Slide43What bias is there here?
Population 200
Exposure1
100
Outcome
10
Randomisation
Exposure 2
100
Outcome
20
No
Outcome 60
No
Outcome 80
Slide44Outcome measureDoes the outcome mean anything to you?Beware surrogate outcomesBeware composite outcome especially if industry funded
Slide45ConclusionsCritical appraisal is not hardIdentify the study designConsider the five reasons for any observed finding in study Practice