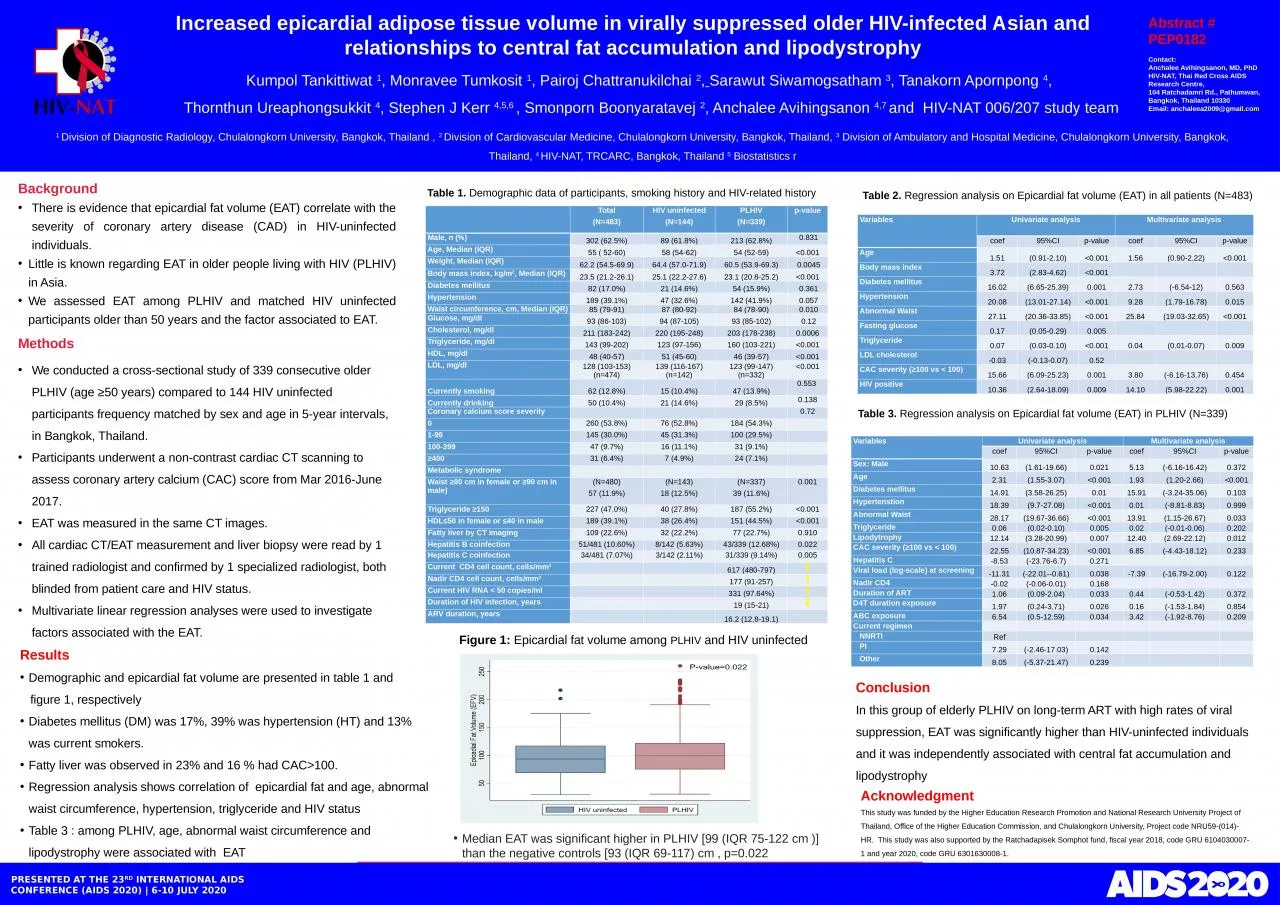
epicardial fat volume EAT correlate with the severity of coronary artery disease CAD in HIVuninfected individuals Little is known regarding EAT in older people living with HIV PLHIV in Asia ID: 932525
Download Presentation The PPT/PDF document "Background There is evidence that" is the property of its rightful owner. Permission is granted to download and print the materials on this web site for personal, non-commercial use only, and to display it on your personal computer provided you do not modify the materials and that you retain all copyright notices contained in the materials. By downloading content from our website, you accept the terms of this agreement.
Slide1
Background
There is evidence that epicardial fat volume (EAT) correlate with the severity of coronary artery disease (CAD) in HIV-uninfected individuals. Little is known regarding EAT in older people living with HIV (PLHIV) in Asia. We assessed EAT among PLHIV and matched HIV uninfected participants older than 50 years and the factor associated to EAT.
Increased epicardial adipose tissue volume in virally suppressed older HIV-infected Asian and relationships to central fat accumulation and lipodystrophy
Kumpol Tankittiwat 1, Monravee Tumkosit 1, Pairoj Chattranukilchai 2, Sarawut Siwamogsatham 3, Tanakorn Apornpong 4, Thornthun Ureaphongsukkit 4, Stephen J Kerr 4,5,6 , Smonporn Boonyaratavej 2, Anchalee Avihingsanon 4,7 and HIV-NAT 006/207 study team
PRESENTED AT THE 23
RD
INTERNATIONAL AIDS CONFERENCE (AIDS 2020) | 6-10 JULY 2020
Methods
We conducted a cross-sectional study of 339 consecutive older PLHIV (age ≥50 years) compared to 144 HIV uninfected participants frequency matched by sex and age in 5-year intervals, in Bangkok, Thailand.
Participants underwent a non-contrast cardiac CT scanning to assess coronary artery calcium (CAC) score from Mar 2016-June 2017. EAT was measured in the same CT images. All cardiac CT/EAT measurement and liver biopsy were read by 1 trained radiologist and confirmed by 1 specialized radiologist, both blinded from patient care and HIV status. Multivariate linear regression analyses were used to investigate factors associated with the EAT.
Table 1. Demographic data of participants, smoking history and HIV-related history
Total(N=483)HIV uninfected(N=144)PLHIV(N=339)p-valueMale, n (%)302 (62.5%)89 (61.8%)213 (62.8%) 0.831Age, Median (IQR)55 ( 52-60)58 (54-62)54 (52-59)<0.001Weight, Median (IQR)62.2 (54.5-69.9)64.4 (57.0-71.9)60.5 (53.9-69.3) 0.0045Body mass index, kg/m2, Median (IQR)23.5 (21.2-26.1)25.1 (22.2-27.6)23.1 (20.8-25.2)<0.001Diabetes mellitus82 (17.0%)21 (14.6%)54 (15.9%) 0.361Hypertension189 (39.1%)47 (32.6%)142 (41.9%) 0.057Waist circumference, cm, Median (IQR)85 (79-91)87 (80-92)84 (78-90) 0.010Glucose, mg/dl93 (86-103)94 (87-105)93 (85-102) 0.12Cholesterol, mg/dl211 (183-242)220 (195-248)203 (178-238)0.0006Triglyceride, mg/dl143 (99-202)123 (97-156)160 (103-221)<0.001HDL, mg/dl48 (40-57)51 (45-60)46 (39-57)<0.001LDL, mg/dl128 (103-153) (n=474)139 (116-167)(n=142)123 (99-147)(n=332)<0.001 Currently smoking62 (12.8%)15 (10.4%)47 (13.9%)0.553 Currently drinking50 (10.4%)21 (14.6%)29 (8.5%)0.138Coronary calcium score severity 0.720260 (53.8%)76 (52.8%)184 (54.3%) 1-99145 (30.0%)45 (31.3%)100 (29.5%) 100-39947 (9.7%)16 (11.1%)31 (9.1%) ≥40031 (6.4%)7 (4.9%)24 (7.1%) Metabolic syndrome Waist ≥80 cm in female or ≥90 cm in male)(N=480)57 (11.9%)(N=143)18 (12.5%)(N=337)39 (11.6%)0.001Triglyceride ≥150227 (47.0%)40 (27.8%)187 (55.2%)<0.001HDL≤50 in female or ≤40 in male189 (39.1%)38 (26.4%)151 (44.5%)<0.001Fatty liver by CT imaging109 (22.6%)32 (22.2%)77 (22.7%)0.910Hepatitis B coinfection51/481 (10.60%)8/142 (5.63%)43/339 (12.68%)0.022Hepatitis C coinfection34/481 (7.07%)3/142 (2.11%)31/339 (9.14%)0.005Current CD4 cell count, cells/mm3 617 (480-797) Nadir CD4 cell count, cells/mm3 177 (91-257) Current HIV RNA < 50 copies/ml 331 (97.64%) Duration of HIV infection, years 19 (15-21) ARV duration, years 16.2 (12.8-19.1)
Table 2. Regression analysis on Epicardial fat volume (EAT) in all patients (N=483)
VariablesUnivariate analysisMultivariate analysiscoef95%CIp-valuecoef95%CIp-valueAge1.51(0.91-2.10)<0.0011.56(0.90-2.22)<0.001Body mass index3.72(2.83-4.62)<0.001 Diabetes mellitus16.02(6.65-25.39)0.0012.73(-6.54-12)0.563Hypertension20.08(13.01-27.14)<0.0019.28(1.79-16.78)0.015Abnormal Waist27.11(20.36-33.85)<0.00125.84(19.03-32.65)<0.001Fasting glucose0.17(0.05-0.29)0.005 Triglyceride0.07(0.03-0.10)<0.0010.04(0.01-0.07)0.009LDL cholesterol-0.03(-0.13-0.07)0.52 CAC severity (≥100 vs < 100)15.66(6.09-25.23)0.0013.80(-6.16-13.76)0.454HIV positive10.36(2.64-18.09)0.00914.10(5.98-22.22)0.001
Table 3. Regression analysis on Epicardial fat volume (EAT) in PLHIV (N=339)
VariablesUnivariate analysisMultivariate analysiscoef95%CIp-valuecoef95%CIp-valueSex: Male10.63(1.61-19.66)0.0215.13(-6.16-16.42)0.372Age2.31(1.55-3.07)<0.0011.93(1.20-2.66)<0.001Diabetes mellitus14.91(3.58-26.25)0.0115.91(-3.24-35.06)0.103Hypertenstion18.39(9.7-27.08)<0.0010.01(-8.81-8.83)0.999Abnormal Waist28.17(19.67-36.66)<0.00113.91(1.15-26.67)0.033Triglyceride0.06(0.02-0.10)0.0050.02(-0.01-0.06)0.202Lipodytrophy12.14(3.28-20.99)0.00712.40(2.69-22.12)0.012CAC severity (≥100 vs < 100)22.55(10.87-34.23)<0.0016.85(-4.43-18.12)0.233Hepatitis C-8.53(-23.76-6.7)0.271 Viral load (log-scale) at screening-11.31(-22.01--0.61)0.038-7.39(-16.79-2.00)0.122Nadir CD4-0.02(-0.06-0.01)0.168 Duration of ART1.06(0.09-2.04)0.0330.44(-0.53-1.42)0.372D4T duration exposure1.97(0.24-3.71)0.0260.16(-1.53-1.84)0.854ABC exposure6.54(0.5-12.59)0.0343.42(-1.92-8.76)0.209Current regimen NNRTIRef PI7.29(-2.46-17.03)0.142 Other8.05(-5.37-21.47)0.239
ConclusionIn this group of elderly PLHIV on long-term ART with high rates of viral suppression, EAT was significantly higher than HIV-uninfected individuals and it was independently associated with central fat accumulation and lipodystrophy
ResultsDemographic and epicardial fat volume are presented in table 1 and figure 1, respectively Diabetes mellitus (DM) was 17%, 39% was hypertension (HT) and 13% was current smokers.Fatty liver was observed in 23% and 16 % had CAC>100. Regression analysis shows correlation of epicardial fat and age, abnormal waist circumference, hypertension, triglyceride and HIV status Table 3 : among PLHIV, age, abnormal waist circumference and lipodystrophy were associated with EAT
1 Division of Diagnostic Radiology, Chulalongkorn University, Bangkok, Thailand , 2 Division of Cardiovascular Medicine, Chulalongkorn University, Bangkok, Thailand, 3 Division of Ambulatory and Hospital Medicine, Chulalongkorn University, Bangkok, Thailand, 4 HIV-NAT, TRCARC, Bangkok, Thailand 5 Biostatistics r
AcknowledgmentThis study was funded by the Higher Education Research Promotion and National Research University Project of Thailand, Office of the Higher Education Commission, and Chulalongkorn University, Project code NRU59-(014)-HR. This study was also supported by the Ratchadapisek Somphot fund, fiscal year 2018, code GRU 6104030007-1 and year 2020, code GRU 6301630008-1.
Abstract # PEP0182Contact: Anchalee Avihingsanon, MD, PhDHIV-NAT, Thai Red Cross AIDS Research Centre,104 Ratchadamri Rd., Pathumwan, Bangkok, Thailand 10330Email: anchaleea2009@gmail.com
Figure 1: Epicardial fat volume among PLHIV and HIV uninfected
Median EAT was significant higher in PLHIV [99 (IQR 75-122 cm )] than the negative controls [93 (IQR 69-117) cm , p=0.022