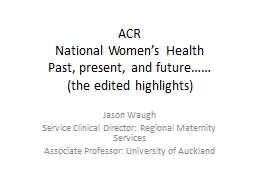
Past present and future the edited highlights Jason Waugh Service Clinical Director Regional Maternity Services Associate Professor University of Auckland The Annual Clinical Report ID: 932546
Download Presentation The PPT/PDF document "ACR National Women’s Health" is the property of its rightful owner. Permission is granted to download and print the materials on this web site for personal, non-commercial use only, and to display it on your personal computer provided you do not modify the materials and that you retain all copyright notices contained in the materials. By downloading content from our website, you accept the terms of this agreement.
Slide1
ACRNational Women’s HealthPast, present, and future……(the edited highlights)
Jason Waugh
Service Clinical Director: Regional Maternity Services
Associate Professor: University of Auckland
Slide2The Annual Clinical Report.What to talk about ?Why me ?Where shall I start :
Why is NWH unique ?
Who do we benchmark ourselves against ?
What is
MOST
important to us going forward ?
What can we expect in the next ACR ?
Slide3AcknowledgementsThe ACR is a phenomenal resource !!Congratulations to all who contributed but especially :
Marjet
Pot
Lynn Sadler
Nancy Li
Emily Clark
Slide4What shall we compare ourselves to ?Locally – changes over time2006-2018
Previous data is in a different format
Nationally – NZ data
MoH
NZ maternity indicators are from 2017 but still relevant
Internationally – UK; Australia; US…………
RCOG data from 2014-2015 – uses similar metrics
Slide5The Unique LMC mix
43% MW LMC
30% Private Obstetrician
20% NWH Comm Teams
7% NWH MFM
Slide61994 – a different time.
9000 births
3000 public
2500 GP
IDMW
Private
Obs’
1000 High Risk
Slide7Not aged well !!
Slide8What do we do ?The women we care for.
The end results
The Service
Slide9The women we care for.
Table 1: Mother and baby numbers: NWH 2018
Total number of mothers birthing at NWH
6448
Mothers birthing before arrival (BBA)
33
Total number of mothers
6481
Total number of babies born at NWH
6564
Babies born before arrival (BBA)
33
Total number of babies
6597
Twins 114 pairs
Slide10Older, more diverse, skewed, biggerwealthy as well as poor, complex.
Maternal Age
Parity
Ethnicity
Ethnicity / age
Ethnicity / smoking
Ethnicity / BMI>35
Slide11Why is NWH unique.NZ’s leading Tertiary/Quaternary provider of obstetric services (55%/100% of NZ’s population)Unique demographic
casemix
which is very different to other NZ units
We are popular (34% from outside ADHB catchment)
LMC -
Deprivation4/5
Slide12The end result
Slide13Maternal M and MIn 2018 there was one maternal death among women who birthed at ACH.
Diagnosis
2016
2017
2018
N=7241
N=6846
N=6481
n
(/1000)
n
(/1000)
n
(/1000)
Emergency peripartum hysterectomy
5
0.7
7
1.0
8
1.2
Ruptured uterus
2
0.3
2
0.3
3
0.5
Amniotic fluid embolism
0
0
0
Eclampsia
1
0.1
0
1
0.2
Transfusion
>
4 units red cells*
NA
NA
23
0.4
Admission to DCCM/CVICU
26
3.66910.48212.7
Hysterectomy
ICU admission ventilation
Slide14ICUIn 2017 and 2018, there were more admissions to DCCM/CVICU72 admissions to DCCM19 to CVICU
11 women were antenatal
72 women postnatal.
One woman had both antenatal and postnatal admissions to intensive care.
Four pregnant women were admitted to DCCM at ACH who did not birth at NWH/ACH.
Slide15ICU admissions
Maternity admissions to intensive care EWS 2015/16
Slide16Perinatal mortality rate, perinatal related mortality rate, fetal death rate and neonatal mortality rate NWH 1991-2018 (all rates expressed as deaths/1000 births)
In 2018, (38) 46% of all perinatal related deaths that occurred
at NWH were to women who did not reside in the ADHB area.
Slide17In 2018 there were no stillbirths at 41+0 or greater gestation.
Total neonatal deaths
N=26
< 37 weeks n=22
>
37
weeks
n=4
n
%
n
%
n
%
Extreme prematurity
8
31
8
36
0
Congenital abnormality
14
54
10
46
4
100
Infection
2
8
2
9
0
Neurological
1
4
1
5
0
Cardio-respiratory disorders
0
0
0
Other
1
4
1
5
0
Survival of babies admitted to NICU
Slide19Outcomes for babies
The hypoxic
ischaemic
encephalopathy rate per 1000 term births at NWH for 2006-2018 was 0.73 (95%CI 0.56-0.94).
This rate is significantly lower than the national rate (1.21/1000 term births 2010-2016 (PMMRC 2018)).
The rate of severe IVH was very low in 2018. Only one baby (23 weeks gestation), was diagnosed with a grade IV /III IVH.
In 2018, 91% of NWH babies admitted to NICU at <32 weeks gestation received some antenatal corticosteroids
Slide20Term Neonatal morbidity
Patterns of Maternity care
in NHS trusts 13/14
RCOG 2016
Slide21% Resp distress 37+ weeksMOH Maternity Clinical Indicators 2017
Slide22The Service.Booking
Antenatal care
Labour
Mode of Birth
PN Care
Slide23NZ National data
Table 17: New Zealand Maternity Clinical Indicators 2017 (NWH and NZ Facility rates for all secondary and tertiary facilities)
Indicator
NWH 2017
NZ 2018
Comment
Reference
%
%
1
Registration with a LMC in the first trimester of pregnancy
75.9
72.6
No Concern
2
Standard primiparae who have a spontaneous vaginal birth
47.1
58.3
Concern
Figure 94
3
Standard primiparae who undergo an instrumental birth
25.1
19.5
Concern
Table 103
4
Standard primiparae who undergo Caesarean section
27.1
21.0
Concern
Table 103
5
Standard primiparae who undergo induction of labour
11.3
8.8
Concern
Figure 87
6
Standard primiparae with an intact lower genital tract (no 1
st
- to 4
th
-degree tear or episiotomy)
6.8
19.0
Concern
Figure 116
7
Standard primiparae undergoing episiotomy and no 3rd or 4th degree perineal tear
49.2
30.0
Concern
Figure 117
8
Standard primiparae sustaining a 3rd or 4th degree perineal tear and no episiotomy
3.6
4.2
No concern
9
Standard primiparae undergoing episiotomy and sustaining a 3rd or 4th degree tear
2.2
2.1
No concern
10
Women having a general anaesthetic for caesarean section
6.1
8.2
No concern
11
Women requiring a blood transfusion with caesarean section
2.9
3.1
No concern
12
Women requiring a blood transfusion with vaginal birth
3.0
2.4
No concern
13
Diagnosis of eclampsia at birth admission
0.004
0.003
No concern
14
Women having a peripartum hysterectomy
0.0130.056No concern 15Women admitted to ICU and requiring ventilation during the pregnancy or postnatal period0.0040.016No concern 16Maternal tobacco use during postnatal period1.19.9Excellent !!!!!! 17Preterm birth8.38.4No concern 18Small babies at term (37 - 42 weeks’ gestation)3.93.2No concern 19Small babies at term born at 40 – 42 weeks’ gestation23.430.4Excellent !!!!!!! 20Babies born at ≥37 weeks’ gestation requiring respiratory support2.92.2ConcernFigure 130
Slide24The Service.Booking
Antenatal care
Labour
Mode of Birth
PN Care
Slide25Registration with an LMC in the first trimester of pregnancy
MOH Maternity Clinical Indicators 2017
Slide26Maternal tobacco use in postnatal periodMOH Maternity Clinical Indicators 2017
Slide27The Service.Booking
Antenatal care
Labour
Mode of Birth
PN Care
Slide28Preterm birth ratesMOH Maternity Clinical Indicators 2017
MOH Maternity Clinical Indicators 2017
Slide29Contributors to PTB
Slide30Diabetes services
Slide31SGA
Figure 49: Perinatal related mortality rate (/1000 births) among SGA, AGA, and LGA singleton non-anomalous babies born at ≥26 weeks 2008-2018
Slide32% SGA 40+ weeksMOH Maternity Clinical Indicators 2017
Slide33Hypertensive disease
Slide34Drivers to IOL rates
10% hypertension
12% Diabetes
SGA detection rates
Reduced
FM
awareness is very topical
Demographics (Age, IVF, BMI, ….)
ALL PUSH IOL RATES UP
Slide35The Service.Booking
Antenatal care
Labour
Mode of Birth
PN Care
Slide36Table 3: Mode of onset of birth NWH 2018
Birthing Mothers
N=6481
n
%
Spontaneous onset of labour
2633
40.6
Iatrogenic onset of birth
3848
59.4
CS Elective
1336
20.6
Emergency CS before onset of
labour
222
3.4
Induction of labour
2290
35.3
Patterns of Maternity care
in NHS trusts 13/14
RCOG 2016
Mode of onset of Birth
Slide37IOL (Primips)
MOH Maternity Clinical Indicators 2017
Slide38VBAC attempts
Patterns of Maternity care
in NHS trusts 13/14
RCOG 2016
Slide39VBAC success15.9% - overall (from 699 women)
Patterns of Maternity care
in NHS trusts 13/14
RCOG 2016
Slide40The System.Booking
Antenatal care
Labour
Mode of Birth
PN Care
Slide41SVD amongst standard primips
MOH Maternity Clinical Indicators 2017
Patterns of Maternity care in NHS trusts 13/14
RCOG 2016
Slide42Caesarean birth
Table 4: Mode of birth by parity NWH 2018
Birthing Mothers
Nullipara
Multipara
N=6481
N=3183
N=3298
n
%
n
%
n
%
Spontaneous Vertex Birth
2998
46.3
1145
36.0
1853
56.2
Vaginal Breech Birth
36
0.6
19
0.6
17
0.5
Operative Vaginal Birth
915
14.1
756
23.8
159
4.8
Forceps
302
4.7
251
7.9
51
1.5
Ventouse
613
9.5
505
15.9
108
3.3
Caesarean Section
2532
39.1
1263
39.7
1269
38.5
CS Elective
1336
20.6
394
12.4
942
28.6
CS Emergency
1196
18.5
869
27.3
327
9.9
Patterns of Maternity care
in NHS trusts 13/14
RCOG 2016
Slide43Caesarean section (Primips)
MOH Maternity Clinical Indicators 2017
Slide44Instrumental
MOH Maternity Clinical Indicators 2017
Slide45Intact perineumMOH Maternity Clinical Indicators 2017
Slide46Episiotomy
MOH Maternity Clinical Indicators 2017
Slide473rd 4th degree tear with Epis’
3
rd
4
th
degree tear no
Epis
’
MOH Maternity Clinical Indicators 2017
Slide483rd 4th degree tears
Slide49Table 7: Maternal postpartum outcomes NWH 2018
Birthing mothers
n
%
PPH
>
1000mls
6481
655
10.1
Spontaneous vaginal birth
3034
239
7.9
Instrumental vaginal birth
915
124
13.6
Caesarean section
2532
292
11.5
Episiotomy among vaginal births
3949
1308
33.1
Third / fourth degree tears among vaginal births
3949
142
3.6
Postpartum blood transfusions
6481
166
2.6
Patterns of Maternity care
in NHS trusts 13/14
RCOG 2016
Slide50The Service.Booking
Antenatal care
Labour
Mode of Birth
PN Care
Slide51What’s happening in PN
Great breastfeeding figures
Great smoking figures
Complaints are rising in this area
Significant staffing pressures
Slide52What’s good……
Neonatal outcomes
Maternity outcomes – severe morbidity
Complaints
Governance
The quality chapter –
3
The service is responding to the challenges.
Slide53What’s still a challenge
The
“intervention rate”
:
IOL ??? - maybe
Elective CS
Primips
VBAC
Emergency CS
Primips
Full dilatation CS
Perineal trauma ??? – maybe
Slide54Age of staff
Slide55The quality agenda (Ch 3)
Seems to be proven to work as areas of focus are the best areas in the report.
No real areas identified within the quality framework that might address some of the service outcomes / pressures in the ACR
Slide56Thank you
I am so glad to be back !!