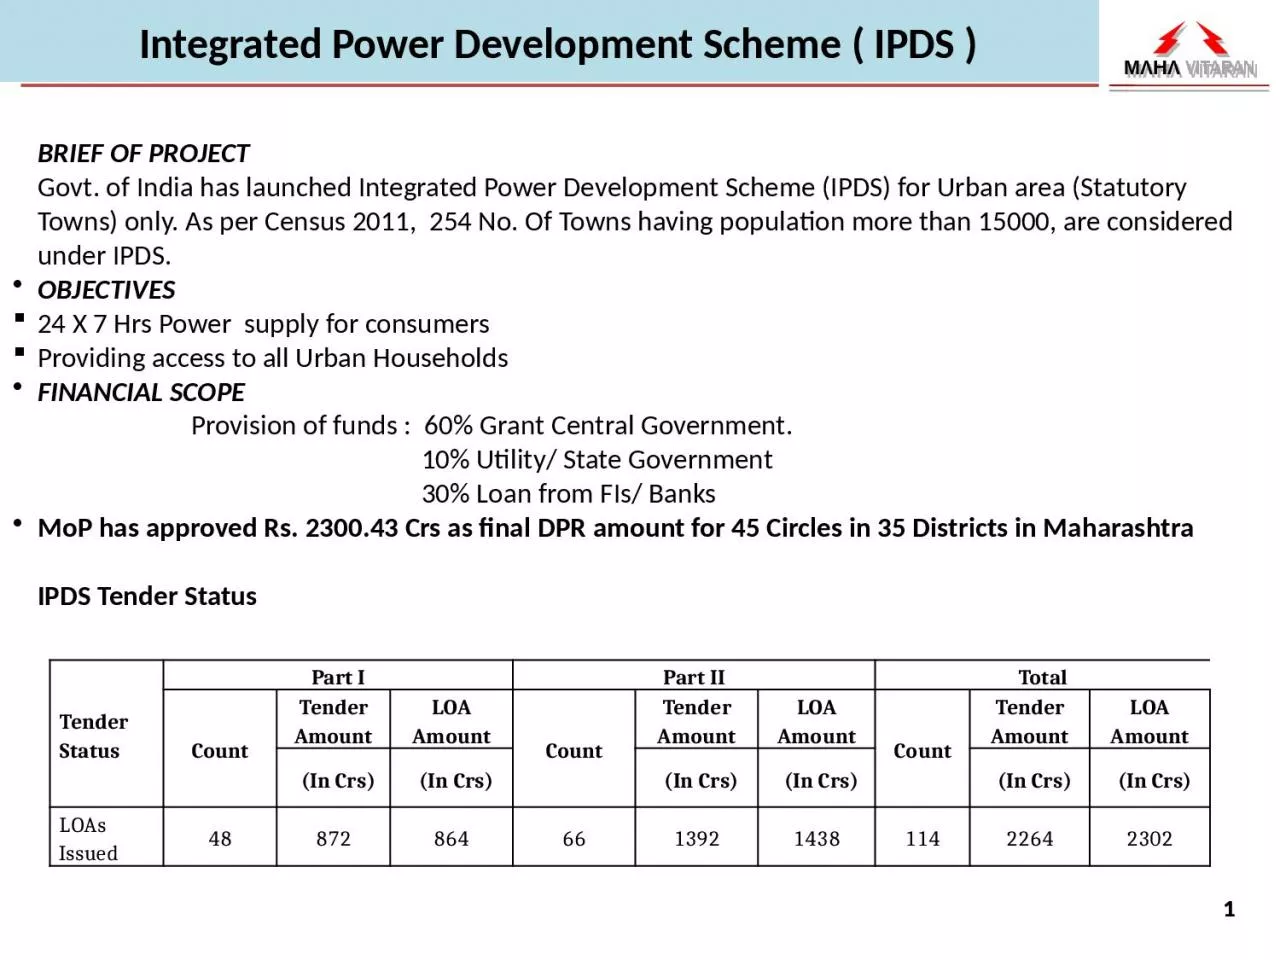
BRIEF OF PROJECT Govt of India has launched Integrated Power Development Scheme IPDS for Urban area Statutory Towns only As per Census 2011 254 No Of Towns having population more than 15000 are considered under IPDS ID: 930232
Download Presentation The PPT/PDF document "Integrated Power Development Scheme ( IP..." is the property of its rightful owner. Permission is granted to download and print the materials on this web site for personal, non-commercial use only, and to display it on your personal computer provided you do not modify the materials and that you retain all copyright notices contained in the materials. By downloading content from our website, you accept the terms of this agreement.
Slide1
Integrated Power Development Scheme ( IPDS )
BRIEF OF PROJECTGovt. of India has launched Integrated Power Development Scheme (IPDS) for Urban area (Statutory Towns) only. As per Census 2011, 254 No. Of Towns having population more than 15000, are considered under IPDS. OBJECTIVES24 X 7 Hrs Power supply for consumers Providing access to all Urban HouseholdsFINANCIAL SCOPE Provision of funds : 60% Grant Central Government. 10% Utility/ State Government 30% Loan from FIs/ BanksMoP has approved Rs. 2300.43 Crs as final DPR amount for 45 Circles in 35 Districts in Maharashtra IPDS Tender Status
Tender Status
Part I
Part II
Total
Count
Tender Amount
LOA Amount
Count
Tender Amount
LOA Amount
Count
Tender Amount
LOA Amount
(In Crs)
(In
Crs
)
(In Crs)
(In Crs)
(In Crs)
(In Crs)
LOAs Issued
48
872
864
66
1392
1438
114
2264
2302
Slide2Sanctioned Scope of Work under IPDS ( 2300.43 Crs
) Sr. No.CircleDPR CostNew Substation Augmentation of Power T/F
Additional power T/F
HT Line
LT Line
New DTC Total
DTC Aug Total
Crs
No
No
No
Km
Km
No
No
1
Akola
17.96
2
0
0
57.48
28.30
52.00
18.00
2
Buldhana
17.35
3
0
0
47.50
26.60
47.00
8.00
3
Washim
12.92
1
0
0
31.66
50.76
68.00
22.00
4
Amravati
124.38
7
4
0
425.72
128.00
204.00
63.00
5
Yavatmal
13.11
2
0
0
33.16
26.09
44.00
10.00
6
Bhandara
16.79
1
0
0
62.35
43.00
73.00
47.00
7
Gondia
28.21
3
3
3
84.00
53.85
75.00
75.00
8
Chandrapur
68.74
8
0
0
212.00
107.00
208.00
63.00
9
Gadchiroli
27.80
3
0
1
109.50
59.55
57.00
61.00
10
Wardha
34.87
3
2
4
104.30
20.50
98.00
52.00
11
Nagpur U
198.15
5
0
1
529.80
256.80
157.00
30.00
12
Nagpur R
119.38
1
4
0
410.25
961.60
136.00
31.00
13
Latur
56.40
1
4
0
126.46
186.51
213.00
130.00
14
Beed
48.16
0
8
1
101.21
167.19
252.00
180.00
15
Osmanabad
65.82
7
2
1
333.70
250.05
190.00
157.00
16
Nanded
91.35
4
4
2
332.92
208.60
197.00
70.00
17
Hingoli
29.98
2
0
0
180.93
185.62
83.00
53.00
18
Parbhani
63.40
9
0
0
146.05
155.62
137.00
133.00
19
Auranagbad
U
111.09
6
3
2
202.52
153.70
256.00
330.00
20
Auranagbad
R
29.87
1
0
0
119.93
122.00
161.00
76.00
21
Jalna
35.08
3
0
2
106.80
183.98
86.00
43.00
22
Jalgaon
100.66
7
6
2
338.00
312.28
402.00
245.00
Slide3Sanctioned Scope of Work under IPDS ( 2300.43 Crs
) Sr. No.CircleDPR CostNew Substation Augmentation of Power T/F
Additional power T/F
HT Line
LT Line
New DTC Total
DTC Aug Total
Crs
No
No
No
Km
Km
No
No
23
Dhule
59.31
5
2
0
175.17
231.76
337.00
211.00
24
Nandurbar
38.10
4
2
1
165.50
62.00
123.00
135.00
25
Ahmednagar
85.41
8
5
1
366.50
183.72
233.00
147.00
26
Nashik
U
30.60
3
1
0
161.10
100.20
94.00
69.00
27
Nashik
R
65.65
6
0
1
171.67
12.00
157.00
129.00
28
Bhiwandi
31.47
0
0
0
24.70
41.40
33.00
46.00
29
Thane U
59.14
2
0
0
63.85
51.60
122.00
19.00
30
Vashi
20.65
0
0
0
4.00
139.00
10.00
30.00
31
Ratnagiri
38.98
0
1
1
125.06
209.00
107.00
83.00
32
Sindhudurg
40.32
1
0
0
138.83
111.64
54.00
30.00
33
Kalyan
I
64.03
1
0
0
40.00
146.00
121.00
158.00
34
Kalyan
II
52.03
3
0
0
105.00
137.48
55.00
70.00
35
Vasai
94.65
5
0
0
273.30
162.46
137.00
26.00
36
Pen
21.63
0
0
0
31.00
244.45
30.00
28.00
37
Baramati
26.65
0
0
1
42.30
148.40
90.00
33.00
38
Satara
26.84
1
1
0
87.23
31.49
55.00
99.00
39
Solapur
27.11
0
1
1
73.86
113.28
165.00
116.00
40
Rastapeth
71.35
6
0
0
174.95
14.00
91.00
15.00
41
Ganeshkhind
36.00
3
0
0
71.16
28.35
99.00
0.00
42
Pune
R
9.69
0
0
0
33.50
26.00
29.00
10.00
43
Kolhapur
56.4656
2
0
0
178.39
279.81
214.00
187.00
44
Sangli
32.89
0
3
0
90.14
152.00
80.00
106.00
Total
2300.43
129.00
56.00
25.00
6693.45
6313.62
5632.00
3644.00
Slide4IPDS Work Status Sept 2021
Particulars Unit Freezed Scope Completed / Commissioned %Progress
New Substation
Nos
120
120
100
Augmentation of PTF
Nos
68
68
100
Add. Power Transformer
Nos
32
32
100
HT Line (OH+UG)
Km
4555
4555
100
LT Line (OH+UG)
Km
2842
2842
100
New DTC
Nos
5057
5057
100
Augmentation of DTC
Nos
4118
4118
100
Slide5Region Wise Summary – Nagpur Region
Sr NoZoneCircleLOA Cost (Rs In Crs)Scheme Cost (In Rs Crs.)
New Substation
Augmentation
Power of Transformer
Additional of Power Transformer
New DTC
DTC Augmentation
LT Line
HT Line
% Progress
Scope
Comm/Comm
Scope
Comm/Comm
Scope
Comm/Comm
Scope
Comm/Comm
Scope
Comm
/
Comm
Scope
Comm
/
Comm
Scope
Comm/Comm
1
Amravati
Yavatmal
12.36
13.11
2
2
0
0
0
0
57
57
10
10
10
10
29
29
100%
2
Amravati
121.94
124.38
7
7
5
5
0
0
201
201
102
102
116
116
284
283
100%
Amravati Total
134
137.49
9
9
5
5
0
0
258
258
112
112
126
126
313
312
100%
3
Chandrapur
Chandrapur
64
68.74
7
7
0
0
0
0
127
127
83
83
28
28
123
123
100%
4
Gadchiroli
32
27.80
3
3
0
0
1
1
56
56
62
62
16
16
77
77
100%
Chandrapur Total
96
96.54
10
10
0
0
1
1
183
183
145
145
43
43
200
200
100%
5
Akola
Akola
21
17.96
2
2
0
0
0
0
43
43
20
20
10
10
37
37
100%
6
Buldhana
20
17.35
3
3
0
0
0
0
42
42
11
11
6
6
31
31
100%
7
Washim
15
12.92
1
1
0
0
0
0
68
68
22
22
22
22
16
16
100%
Akola Total
55
48.22
6
6
0
0
0
0
153
153
53
53
38
38
84
84
100%
8
Nagpur
Nagpur R
113
119.38
1
1
5
5
0
0
133
133
18
18
249
249
341
341
100%
9
Nagpur U
133
141.07
4
4
0
0
1
1
157
157
214
214
311
311
553
553
100%
10
Nagpur DF
57
57.08
3
3
0
0
3
3
191
191
98
98
64
64
148
148
100%
11
Wardha
37
34.87
3
3
2
2
4
4
82
82
43
43
9
9
101
101
100%
Nagpur Total
340
352.40
11
11
7
7
8
8
563
563
373
373
633
633
1143
1143
100%
12
Gondia
Bhandara
20
16.79
1
1
0
0
0
0
68
68
52
52
21
21
35
35
100%
13
Gondia
33
28.21
3
3
3
3
3
3
73
73
74
74
23
23
63
63
100%
Gondia Total
53
44.99
4
4
3
3
3
3
141
141
126
126
44
44
97
97
100%
Nagpur Total
678
680
40
40
15
15
12
12
1298
1298
809
809
884
884
1838
1837
100%
Slide6Region Wise Summary – Aurangabad Region
Sr NoZoneCircleLOA Cost (Rs In Crs)Scheme Cost (In Rs Crs.)New Substation
Augmentation of Power Transformer
Additional of Power Transformer
New DTC
DTC Augmentation
LT Line
HT Line
% Progress
Scope
Comm
/
Comm
Scope
Comm/Comm
Scope
Comm/Comm
Scope
Comm/Comm
Scope
Comm/Comm
Scope
Comm/Comm
Scope
Comm/Comm
14
Nanded
Hingoli
28
29.98
2
2
0
0
0
0
80
80
53
53
80
80
55
55
100%
15
Nanded
91
91.35
4
4
4
4
2
2
197
197
68
68
161
161
157
157
100%
16
Parbhani
68
63.40
5
5
2
2
3
3
103
103
133
133
43
43
100
100
100%
Nanded Total
187
184.74
11
11
6
6
5
5
380
380
254
254
284
284
313
313
100%
17
Latur
Beed
47
48.16
0
0
8
8
1
1
244
244
163
163
112
112
48
48
100%
18
Latur
59
56.40
1
1
4
4
0
0
205
205
130
130
102
102
145
145
100%
19
Osmanabad
69
65.82
7
7
2
2
0
0
147
147
135
135
139
139
142
142
100%
Latur Total
175
170.37
8
8
14
14
1
1
596
596
428
428
353
353
334
334
100%
20
Auranagbad
Aurangabad U
106
111.09
5
5
7
7
2
2
242
242
306
306
46
46
119
119
100%
21
Aurangabad R
34
29.87
1
1
0
0
0
0
135
135
86
86
53
53
45
45
100%
22
Jalna
36
35.08
3
3
2
2
1
1
86
86
56
56
55
55
48
48
100%
Auranagbad Total
176
176.04
9
9
9
9
3
3
463
463
448
448
153
153
213
213
100%
Auranagbad Total
538
531
28
28
29
29
9
9
1439
1439
1130
1130
790
790
860
860
100%
Slide7Region Wise Summary – Pune
Region Sr NoZoneCircleLOA Cost (Rs In Crs)Scheme Cost (In Rs Crs.)
New Substation
Augmentation of Power Transformer
Additional of Power Transformer
New DTC
DTC Augmentation
LT Line
HT Line
% Progress
Scope
Comm
/
Comm
Scope
Comm/Comm
Scope
Comm
/
Comm
Scope
Comm
/
Comm
Scope
Comm
/
Comm
Scope
Comm/Comm
Scope
Comm/Comm
23
Baramati
Satara
26
26.84
1
1
1
1
0
0
42
42
95
95
8
8
50
50
100%
24
Baramati
28
26.65
0
0
0
0
1
1
38
38
22
22
85
85
37
37
100%
25
Solapur
27
27.11
0
0
0
0
2
2
150
150
108
108
78
78
36
36
100%
Baramati Total
81
80.59
1
1
1
1
3
3
230
230
225
225
171
171
123
123
100%
26
Pune
Pune
R
10
9.69
0
0
0
0
0
0
21
21
10
10
16
16
11
11
100%
27
Rastapeth
71
71.35
6
6
0
0
0
0
71
71
13
13
12
12
147
147
100%
28
Ganeshkhind
39
36.00
3
3
0
0
0
0
94
94
0
0
48
48
87
87
100%
Pune Total
120
117.04
9
9
0
0
0
0
186
186
23
23
76
76
245
245
100%
29
Kolhapur
Kolhapur
68
56.47
2
2
0
0
0
0
79
79
169
169
112
112
86
86
100%
30
Sangli
28
32.89
0
0
3
3
0
0
88
88
144
144
27
27
44
44
100%
Kolhapur Total
96
89.36
2
2
3
3
0
0
167
167
313
313
138
138
129
129
100%
Pune Total
297
287
12
12
4
4
3
3
583
583
561
561
385
385
497
497
100%
Slide8Region Wise Summary – Konkan
Region Sr NoZoneCircleLOA Cost (Rs In Crs)Scheme Cost (In Rs Crs.)
New Substation
Augmentation of Power Transformer
Additional of Power Transformer
New DTC
DTC Augmentation
LT Line
HT Line
% Progress
Scope
Comm/Comm
Scope
Comm
/
Comm
Scope
Comm
/
Comm
Scope
Comm/Comm
Scope
Comm/Comm
Scope
Comm/Comm
Scope
Comm/Comm
31
Konkan
Ratnagiri
36
38.98
0
0
1
1
1
1
79
79
119
119
140
140
90
90
100%
32
Sindhudurg
46
40.32
1
1
0
0
0
0
33
33
30
30
38
38
80
80
100%
Konkan Total
83
79.30
1
1
1
1
1
1
112
112
149
149
178
178
170
170
100%
33
Jalgaon
Jalgaon
95
100.66
7
7
6
6
2
2
326
326
215
215
53
53
187
187
100%
34
Nandurbar
37
38.10
3
3
2
2
1
1
130
130
163
163
21
21
107
107
100%
35
Dhule
64
59.31
4
4
1
1
1
1
250
250
208
208
65
65
73
73
100%
Jalgaon Total
197
198.08
14
14
9
9
4
4
706
706
586
586
139
139
368
368
100%
36
Kalyan
Vasai
86
94.65
5
5
0
0
0
0
155
155
113
113
82
82
248
248
100%
37
Kalyan II
50
52.03
3
3
0
0
0
0
37
37
60
60
6
6
39
39
100%
38
Kalyan I
66
64.03
1
1
0
0
0
0
63
63
179
179
51
51
31
31
100%
Kalyan Total
202
210.71
9
9
0
0
0
0
255
255
352
352
140
140
318
318
100%
39
Bhandup
Bhiwandi DF
30
31.47
0
0
0
0
0
0
45
45
107
107
9
9
25
25
100%
40
Pen
22
21.63
0
0
0
0
0
0
39
39
25
25
66
66
11
11
100%
41
Vashi
21
20.65
0
0
0
0
0
0
8
8
27
27
58
58
2
2
100%
42
Thane U
54
59.14
2
2
0
0
0
0
112
112
12
12
8
8
55
55
100%
Bhandup Total
127
132.89
2
2
0
0
0
0
204
204
171
171
141
141
93
93
100%
43
Nashik
Ahmednagar
87
85.41
7
7
8
8
2
2
220
220
160
160
81
81
231
231
100%
44
Malegaon
50
65.65
4
4
0
0
1
1
154
154
131
131
14
14
86
86
100%
45
Nashik
U
43
30.60
3
3
2
2
0
0
86
86
69
69
88
88
95
95
100%
Nashik Total
180
181.66
14
14
10
10
3
3
460
460
360
360
184
184
412
412
100%
Konkan Total
788
803
40
40
20
20
8
8
1737
1737
1618
1618
782
782
1361
1361
100%
Grand Total
2301
2300
120
120
68
68
32
32
5057
5057
4118
4118
2842
2842
4556
4555
100%